Binance Coin (BNB) Resumes Selling Pressure as the Altcoin Faces Rejection at $600 High
Estimated Reading Time: 2 minutes
Don’t invest unless you’re prepared to lose all the money you invest. This is a high-risk investment and you are unlikely to be protected if something goes wrong. Take 2 minutes to learn more

Binance Coin (BNB) Long-Term Analysis: Bearish
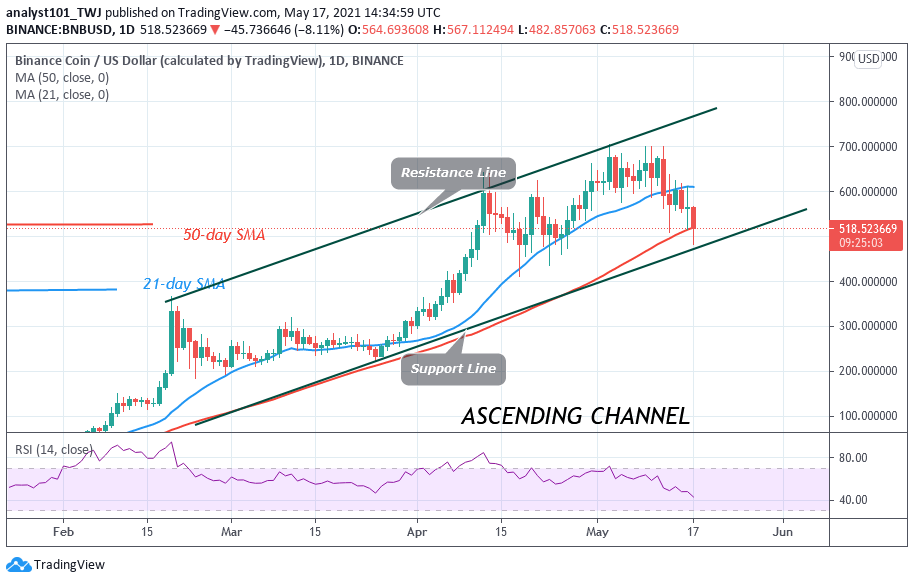
Since May 3, the bulls have been retesting the $700 resistance zone. Buyers were repelled after failing to break above the resistance level. BNB dropped sharply to $527 and later retested the $600 resistance. After the retest, Binance Coin declined to $480 low. The bulls bought dip to push the altcoin upward. However, the selling pressure resumes after retesting the high of $540.
Binance Coin (BNB) Indicator Analysis
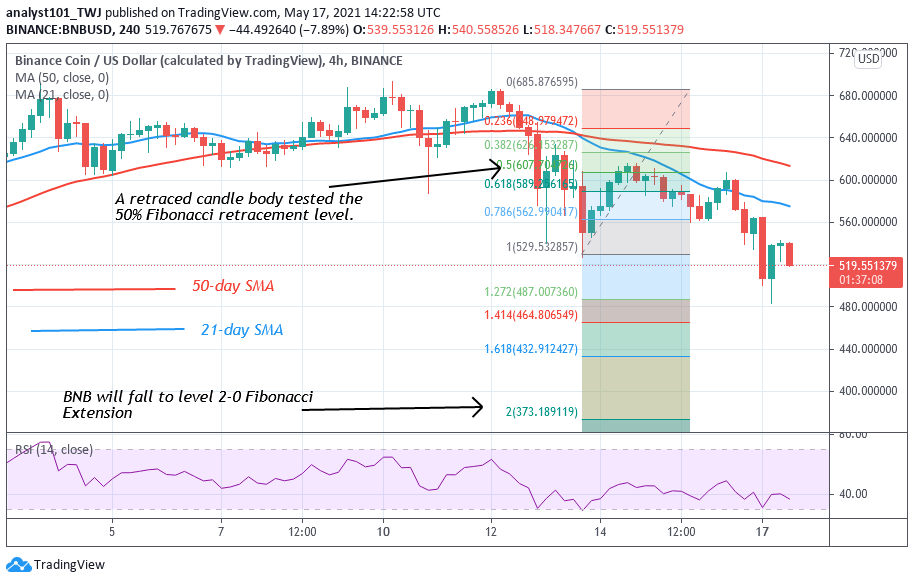
The crypto’s price has broken the 21-day SMA and it is approaching the 50-day SMA. A break below the SMAs implies that BNB will resume a downward move. Also, BNB is at level 43 of the Relative Strength Index period 14. It indicates that the altcoin is in the bearish trend zone and that BNB is capable of falling.
Technical indicators:
Major Resistance Levels – $640, $660, $680
Major Support Levels – $540, $520, $500
What Is the Next Direction for Binance Coin (BNB)?
Binance Coin is still in a downward move. The downtrend resumes as the coin faces rejection at the $600 high. Meanwhile, On May 13 downtrend, a retraced candle body tested the 50% Fibonacci retracement level. The retracement indicates that the market will rise to level 2.0 Fibonacci extension or the low of $373.18.
Note: cryptosignals.org is not a financial advisor. Do your research before investing your funds in any financial asset or presented product or event. We are not responsible for your investing results