$SPONGE (SPONGE/USD) – A Brewing Storm Before the Breakout?
Estimated Reading Time: 3 minutes
Don’t invest unless you’re prepared to lose all the money you invest. This is a high-risk investment and you are unlikely to be protected if something goes wrong. Take 2 minutes to learn more

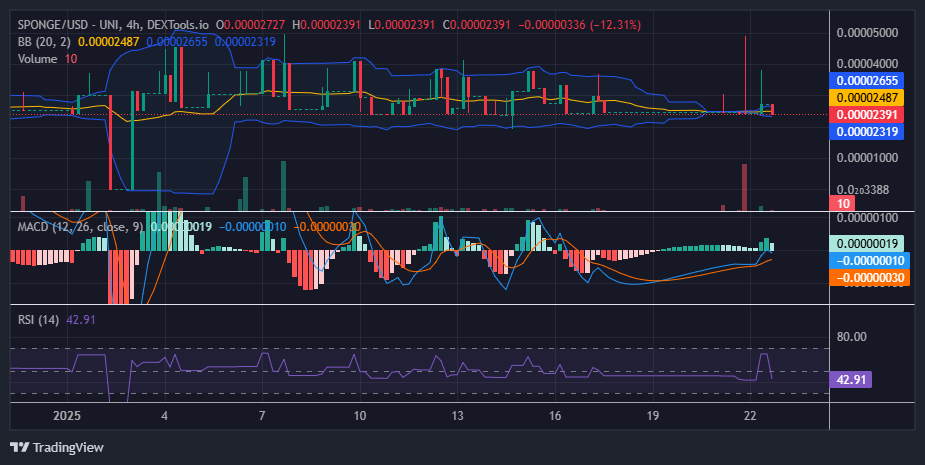
The SPONGE/USD market is undergoing a phase of intense consolidation, resembling the tension of a coiled spring. After a recent bearish dip, the price has stabilized around the $0.000024 mark, accompanied by a notable decrease in volatility. This “volatility squeeze” is often a classic indicator of an impending significant price movement, signaling the potential for a decisive breakout.
Despite the subdued price action, it is essential to highlight that the critical support level at $0.0000006 remains steadfast, with bulls defending the $0.000023 level. This resilience reflects the bulls’ determination to maintain their upward momentum and signals their unwavering commitment to sustaining a bullish trajectory.
Key Market Dynamics:
- Resistance Levels: $0.00005, $0.000055, $0.000060
- Support Levels: $0.000020, $0.0000195, $0.000019
$SPONGE (SPONGE/USD) Technical Analysis
The Bollinger Bands, a key volatility indicator, have tightened significantly, reflecting the SPONGE/USD market’s current state of indecision. This “band squeeze” highlights a fierce struggle between bullish and bearish forces, with neither side asserting a decisive advantage.
A recent spike in trading activity briefly pushed prices toward the $0.00004 level, accompanied by a notable increase in trading volume. However, as outlined in yesterday’s analysis, this upward momentum has been followed by descending peaks, signaling growing selling pressure. Despite this, bulls are steadfast in defending the $0.000024 level.
Interestingly, the trade volume indicator lacks histogram reflections, suggesting that bears may lack the strength to breach the critical $0.000024 support level. This dynamic in the crypto signal underscores the ongoing tug-of-war, with bulls demonstrating resilience amidst mounting pressure.
$SPONGE (SPONGE/USD) 1-Hour Chart Observations
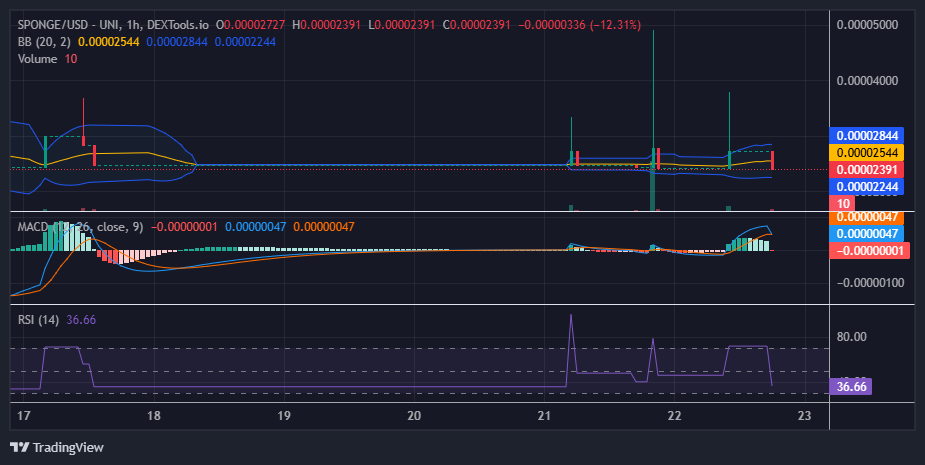
The Moving Average Convergence and Divergence (MACD) indicator continues to signal a bullish market bias, despite showing signs of a bearish crossover above the zero level. This suggests that while bearish momentum is advancing, the bulls are demonstrating remarkable resilience by maintaining their position against the pressure.
Earlier market activity, characterized by small price spikes, caused the Bollinger Bands’ bandwidth to expand, resulting in increased market swings and oscillations. Despite this volatility, the bulls have successfully defended the $0.000024 level. A potential bounce from this level remains a hopeful possibility, reflecting the bulls’ determination to sustain upward momentum.
Buy $SPONGE!
W’s in the chat pic.twitter.com/OyFulB59Nr
— $SPONGE (@spongeoneth) January 22, 2025
Join the SPONGE community and be part of the next big crypto sensation! Buy Sponge ($SPONGE) today!