$SPONGE (SPONGE/USD): Bulls Charge Towards $0.00006 Resistance
Estimated Reading Time: 2 minutes
Don’t invest unless you’re prepared to lose all the money you invest. This is a high-risk investment and you are unlikely to be protected if something goes wrong. Take 2 minutes to learn more

The $SPONGE market is clawing its way up the price chart! After a period of consolidation around $0.000045, the bulls emerged on April 26th with a sudden surge. This bullish stampede pushed the price towards $0.00006, but it seems the climb might have winded some investors. A short-lived correction followed, pulling the price back down towards support.
But here’s the good news for the bulls: according to the crypto signal below, $SPONGE has bounced back and is now on a gradual ascent. This could be their second chance to breach the $0.00006 resistance level.
Key Market Dynamics:
- Resistance Levels: $0.0010, $0.0011, and $0.0012.
- Support Levels: $0.000035, $0.000030, and $0.000025.
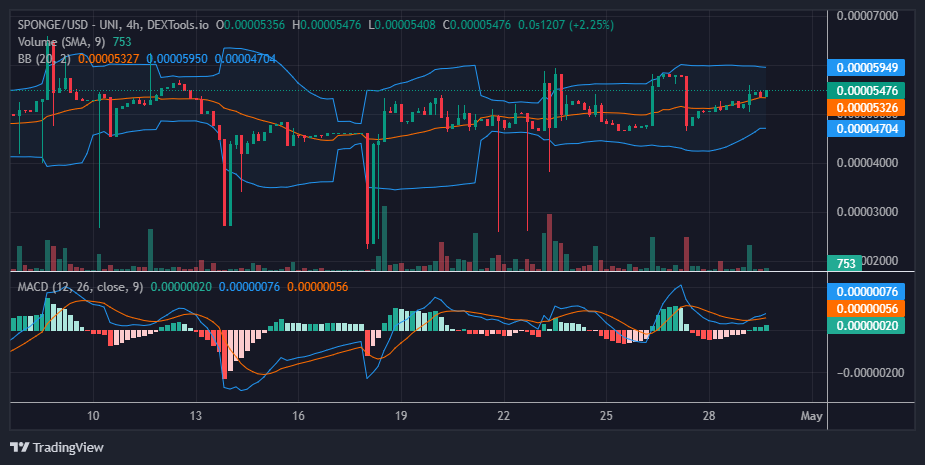
Delving into Technical Analysis for $SPONGE (SPONGE/USD)
The Bollinger Bands are hinting at a potential bull run, with the lower Bollinger Band trending upwards. This upward movement often indicates increasing price volatility and, potentially, upward momentum. However, the $0.00006 resistance level remains strong despite the lower band’s movement.
A sustained uptrend impacting the resistance level and pushing it upward would solidify the bullish case. Such a development would increase the likelihood of the current bull run surpassing the current resistance. The recent rejection at this level may have temporarily strengthened the resistance. Nonetheless, consistent bullish pressure, even a gradual one as seen currently, could pave the way for a future breakout.
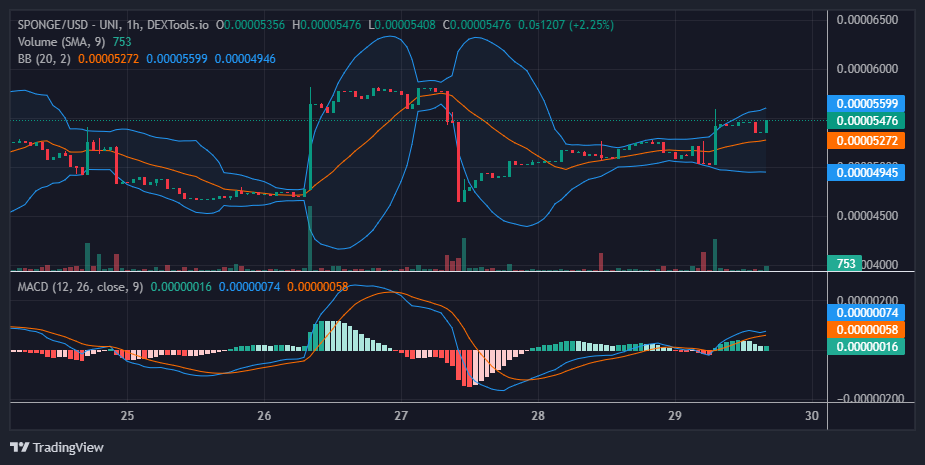
Insights from the 1-Hour Perspective:
The hourly chart confirms the bullish trend but also reveals a bump in volatility around $0.000050, evident by the wider Bollinger Bands. Luckily, the bulls found support at $0.000053. If they can defend this level against resistance, they might just maintain their upward trajectory towards the much-desired $0.00006 mark.
Absorb the damp with SPONGE/USD!
Did someone say, damp…? 🧽 💦 $SPONGE #SpongeV2 #MemeCoin pic.twitter.com/seUpTv6bUF
— $SPONGE (@spongeoneth) April 26, 2024
Invest in the hottest and best meme coin. Buy Sponge ($SPONGE) today!