dYdX’s DYDX Token Surges 45% Ahead of Massive Unlock Event

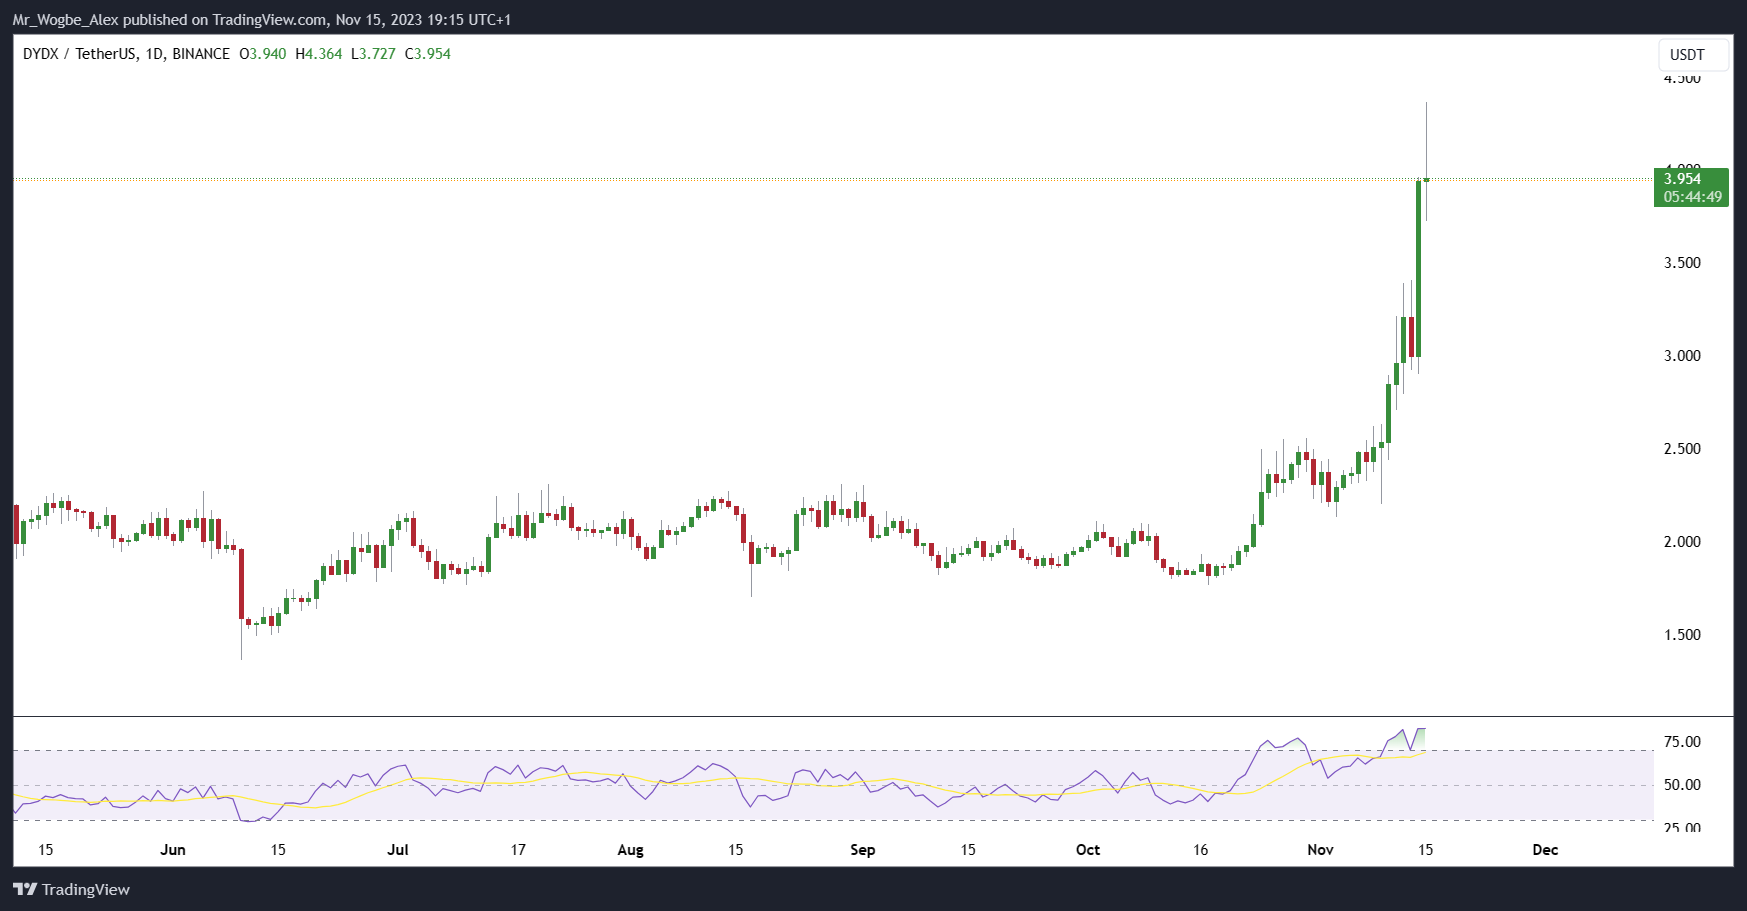
The native token of decentralized exchange (DEX) dYdX, has surged by over 45% within the last 48 hours, reaching a peak of $4.364—a pinnacle not witnessed since April 2022. This impressive rally unfolds just 16 days before a pivotal token unlock event set to unleash over $500 million worth of DYDX to early investors and core team members, as reported by CoinDesk.

dydx daily chart
DYDX/USDT Daily Chart

dYdX, a DEX renowned for facilitating spot, margin, and perpetual contracts on diverse crypto assets, recently unveiled its layer-1 blockchain based on Cosmos. This strategic move aims to enhance scalability, security, and the overall user experience for the DEX while allowing validators to earn a share of trading revenue as a reward for staking.

The migration of the DYDX token from Ethereum to the new blockchain accompanied the launch of its own chain. Acting as a governance and utility token, DYDX empowers holders to participate in voting on proposals, access exclusive features, and earn rewards. Over the past month, the cryptocurrency has more than doubled in price as anticipation for the token’s transition grew among speculators.

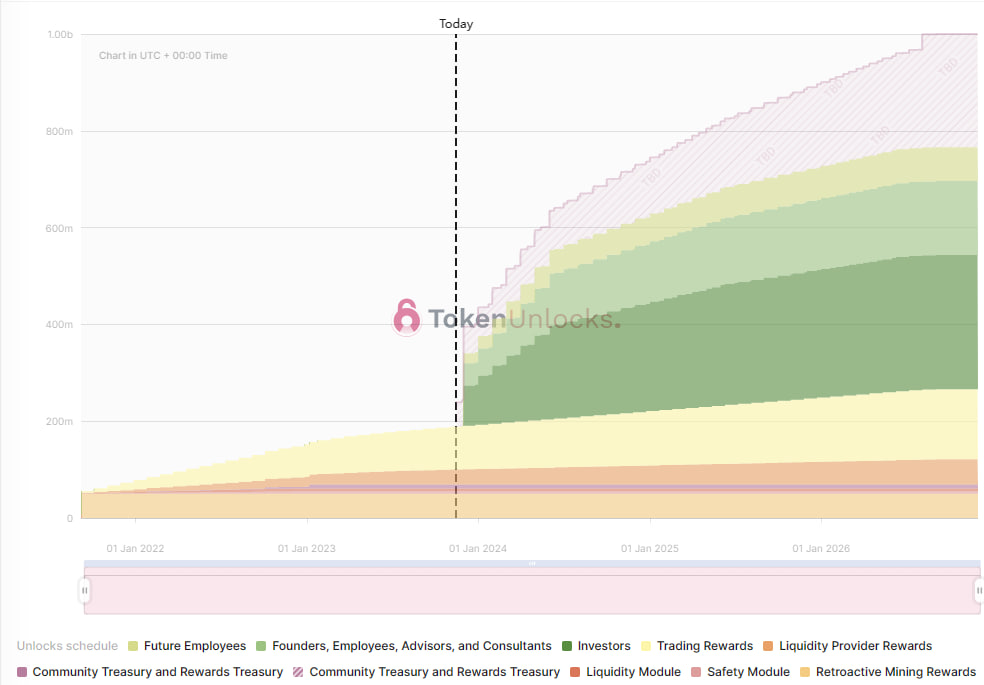
However, a potential challenge looms in the form of a substantial unlock event scheduled for December 2, 2023. This event is poised to elevate the circulating supply of DYDX from 179 million to 395 million, marking a significant 120% increase. Concerns arise about potential selling pressure as investors may opt to cash in their profits.

dydx token unlock
Source: token.unlocks

dYdX CEO Proposes Incentive for Stakers

To counterbalance this risk, dYdX CEO Antonio Juliano has unveiled a new incentive program for staking the cryptocurrency. In an announcement on X, Juliano stated that stakers would receive “cold hard USDC,” a stablecoin pegged to the US dollar, and validators would enjoy 100% of trading fees. This innovative approach aims to encourage more users to stake their tokens, thereby mitigating the potential inflationary impact of the impending unlock.

With $409 million in total value locked and an impressive daily trading volume surpassing $800 million, dYdX stands as one of the leading DEXs in the crypto space. The community’s loyalty and continuous growth underscore the anticipation surrounding the impact of the upcoming token unlock on dYdX’s price and popularity.


Interested In Learning How To Use Leverage While Trading? Find Out Here

Litecoin (LTC/USD) Trade Retraces, Aiming for a Recoup at $70

Litecoin Price Prediction – November 15
The indices note that the LTC/USD market is portending, as the possibility of seeing the price push downward more than the current trade zone of $71.929271 seems unrealistic, given the crypto-economic trade retraces against the point of $75, aiming for a recoup at $70.

After a move to average the crucial underlying support level of $65, yesterday’s session offered arguments for today’s high of $71.975427 and a low of $70.511849. Regarding investors, the prices being maintained thus far are still reasonable enough to let the trade run for a while before taking advantage of higher valuation points. Traders should never place their positions with excessive leverage.

LTC/USD Market
Key Levels:
Resistance levels: $80, $85, $90
Support levels:$65, $60, $55

LTC/USD – Daily Chart
The LTC/USD daily chart showcases that the crypto-economic market retraces after witnessing a resistance around the line of $75, aiming for a recoup at $70.

The stochastic oscillators are positioned southward, as the blue line has dipped into the oversold region. The Bollinger Band trend lines are beginning to face northward directions to denote that buying orders are in top-notch formation. A bullish candlestick is in the making around the trending axis of the middle Bollinger Band, raising the notion that sellers are again gradually quitting the market.
Litecoin (LTC/USD) Trade Retraces, Aiming for a Recoup at $70
If the LTC/USD market is required to revisit $65 and its surroundings, how might sellers respond?
Any price actions that could possibly make the LTC/USD market operations go back to the lower point of $65 could give rise to the opinions of getting back decent investment placement orders as the crypto market retraces from around the barrier line of $75, aiming for a recoup at $70 at the time of this write-up.

Long-term positioners would do better to place rapid execution orders if the price simply intended to drop back sharply, followed by a brief rallying motion sign. However, traders who adhere to the investing philosophy ought to take this opportunity to return.

A scared reversal force against the motion may result in an entry for sellers to enter the market, as there has been a sign that the price is trying to draw up around the middle Bollinger Band trend line. And if that conjecture holds water, the price will probably drop for a quick retest of support near $65 to signal the end of it.
Litecoin (LTC/USD) Trade Retraces, Aiming for a Recoup at $70
LTC/BTC Price Analysis
In contrast, the LTC/BTC daily price analysis chart showcases the trade retraces underneath the upper Bollinger Band trend line against the worth of Bitcoin, aiming for a recoup around the line of the lower Bollinger Band at the moment.

The positional construction of the Bollinger Bands indicators indicates that there is still some pressure on the base crypto economy. However, the current market line shows that it has the ability to fortify itself in order to seize profitable opportunities against the correlated cryptocurrency. In order to confirm that buyers will experience higher volatility than sellers, stochastic oscillators have been displaying buying signals.

Note: Cryptosignals.org is not a financial advisor. Do your research before investing your funds in any financial asset or presented product or event. We are not responsible for your investing results.

You can purchase Lucky Block here. Buy LBLOCK

Chiliz (CHZUSD) Trades Downhill

CHZUSD Analysis: Buyers Face Repulsion

Chiliz (CHZUSD) trades downhill. The price of Chiliz has been declining, with buyers being repelled lower. The $0.08640 significant level has proved to be a strong rejection point for buyers. It therefore allows sellers to reverse the crypto price. The buy traders have not been able to break through this key level since April this year.

Although buy-in growth has been in session since the middle of October, the Chiliz market has lacked the depth of both buy and sell influence before then. The cryptocurrency price had a low liquidity drive for a while before buyers made a pull.

Chiliz Key Levels

Resistance Levels: $0.14700, $0.13920
Support Levels: $0.09830, $0.66400

Chiliz (CHZUSD) Trades Downhill

The Bollinger Band indicator shows that the bulls finally broke above the $0.06640 price zone. However, the next target, the $0.08640 price zone, has not yet been broken and is being held strong.

For now, buyers need to readjust their tenacity before making further dives into the market. There has been a progressive decline in the buying market. The bulls have gone cold for now, and sellers are hoping to win back their strength.

Chiliz (CHZUSD) Trades Downhill

Market Expectation

The sellers and traders are posing a serious threat to the crypto buyers. Nevertheless, the buyers of Chiliz are not ready to give up yet. They, however, need to get back up to sustain their bullish tendency.

The bulls need to overcome these challenges to resume the uptrend. If not, they need to look for buying opportunities in the lower band or the oversold zone. The bears, on the other hand, could take advantage of the downward momentum and target the lower band.

You can purchase Lucky Block here.  Buy LBLOCK

Note: Cryptosignals.org is not a financial advisor. Do your research before investing your funds in any financial asset or presented product or event. We are not responsible for your investing results.

Dogecoin (DOGE/USD) Price Loses Momentum, Following a Rise

Dogecoin Price Prediction – November 15
Activities that have been featured to demonstrate bulls’ gravitational weights in the DOGE/USD market against the US coin are making a reversal sign, given that the crypto-economic trade loses momentum around the point of $0.080, following a rise.

The anticipated bullish trading cycle has been amassing positions from various strong lower trading zones in anticipation of appreciating above its most recent highs after regaining the necessary energy to do so. This is now speculatively turning into a shift in the game. If that assumption holds true, investment trade philosophies must generally be upheld since the majority of abandoned crypto economies have mechanisms in place to ensure that the best appreciation motions are obtained in the ensuing operations.

DOGE/USD Market
Key Levels:
Resistance levels: $0.080, $0.085, $0.090
Support levels: $0.065, $0.060, $0.055

DOGE/USD – Daily Chart
The DOGE/USD daily showcases that the crypto-economic price loses momentum around the psychological resistance point of $0.080, following a rise.

The stochastic oscillators are primarily positioned southward, as the blue line has been placed in the oversold region. Yet pointing to the downside in the area. However, a trading candlestick shows the base crypto is making efforts to push back against the counter-trading instrument. The Bollinger Band indicators are in a northward-moving mood, portending that the crypto market is trying to formulate a bullish flay pattern.
Dogecoin (DOGE/USD) Price Loses Momentum, Following a Rise
How crucial would it be for the bears in the DOGE/USD market to push through the $0.065 level as it hovers at $0.0734?
As it is, levels of falls have been featuring to checkmate continuous uprising forces as the DOGE/USD market loses momentum around the resistance of $0.080 in recent activities, following a rise.

Currently, it seems that sellers have gained a trading window into which to build entries in order to prevent free increases around or slightly over the $0.080 mark. That being said, in the event that the market makes a new and unprecedented breakout against the point, short-position takers might need to hold off on entering the market around that value line with a keen understanding of when to execute a stop-loss order.

According to this technical analysis, a bullish candlestick is developing around the middle Bollinger Band trend line, signaling the start of a rebound for long position takers. In the near future, nevertheless, there may be more lows that are close to or to the downside of the lower Bollinger Band. Investors are to maintain their positions through all circumstances.
Dogecoin (DOGE/USD) Price Loses Momentum, Following a Rise
DOGE/BTC Price Analysis
In contrast, the Dogecoin market loses momentum around the upper Bollinger Band trend line against the purchasing power of Bitcoin, following a rise.

Despite this, the Bollinger Band trend lines are positioned lower to support the possibility of seeing a bullish flag pattern. To create a faint hint of range-bound formation, the stochastic oscillators have been veering upward and downward through various locations. Based on an overall analysis, the primary cryptocurrency is gaining momentum in opposition to the crypto that is being counter-traded.

Note: Cryptosignals.org is not a financial advisor. Do your research before investing your funds in any financial asset or presented product or event. We are not responsible for your investing results.


You can purchase Lucky Block here. Buy LBLOCK

Ethereum Suffers a Setback as It Loses the Psychological Price Barrier of $2,000

Ethereum Price Long-Term Analysis: Bullish
Ethereum’s (ETH) price faces rejection at $2,131.50 as it loses the psychological price barrier of $2,000. Buyers were unable to maintain their bullish momentum after being rejected at the high of $2,100. The altcoin would have reached previous highs if it had reached the $2,200 peak.However, selling pressure has returned as a result of the bear’s break of the $2,000 psychological price level.

First, the altcoin will fall to the $1,900 support level or the 21-day SMA. If the 21-day SMA support is maintained, the present uptrend will resume. The downtrend will resume if the bears breach the $1,920 support or the 21-day SMA. Ether will fall to a low above the $1,746 breakthrough barrier. At the moment, ETH/USD is trading at $1,973.

      Ethereum Suffers a Setback as It Loses the Psychological Price Barrier of $2,000
ETH/USD – Daily Chart

Technical indicators:
Major Resistance Levels – $2, 600, $2,800, $3,000
Major Support Levels – $1.600, $1, 400, $1,200

Ethereum Indicator Analysis
On the 4-hour chart, the bears have breached below the moving average lines, indicating that the cryptocurrency will continue to fall. The price bars on the daily chart are above and approaching the 21-day SMA. If the 21-day SMA is violated, the present rally may come to an end.

Conclusion
Ethereum is in decline below the psychological price barrier of $2,000. Ether was restrained twice before its recent high before falling. The altcoin is getting close to the important support level of $1,920. Following a collapse below the $2,000 support, the bears will seek to breach below the 21-day simple moving average. If the bears are successful, the decline will resume.

      Ethereum Suffers a Setback as It Loses the Psychological Price Barrier of $2,000
ETH/USD – 4 Hour Chart


You can buy crypto coins here. Buy LBLOCK

Note: Cryptosignals.org is not a financial advisor. Do your research before investing your funds in any financial asset or presented product or event. We are not responsible for your investing results

Dash 2 Trade Price Prediction for Today, November 15: D2TUSD Shows Stability as it approaches the $0.00550 Level

Dash 2 Trade Price Forecast: D2TUSD Shows Stability as it approaches the $0.00550 Level (November 15)
D2TUSD price will keep rising based on the outlook. The crypto at the moment is currently recovering and shows stability as it approaches the upper resistance channel. After the downward correction is over, the crypto is likely to continue rising if the current support at $0.00472 holds and the daily chart closes above the $0.00542 resistance level. If this happens, there’s a good chance the price will rise to its most recent swing high, which is the resistance trend line at $0.00553 resulting in an intraday gain and a potential buy signal for the coin holders.

Key Levels:
Resistance levels: $0.01500, $0.01600, $0.01700
Support levels: $0.01200, $0.01100, $0.01000

D2T (USD) Long-term Trend: Bullish (4H)
The chart below shows that the D2TUSD pair is in a bullish market zone in its higher time frame. Right now, the price is rising and is trading above the EMA-9. This is an indication of an uptrend.
Dash 2 Trade Price Prediction for Today, November 15: D2TUSD Shows Stability as it approaches the $0.00550 Level
The bullish reversal at the $0.00485 high value in the previous action has sustained the crypto above the trend line in its recent high.

As a result of price rejection in the previous action, buyers have been able to push the price of Dash 2 Trade higher to a $0.00487 high level above the moving average lines as the 4-hour session opens today. More gains are possible if the bulls can put extra effort into the price action.

Thus, closing the 4-hourly session above the $0.00553 previous supply barrier will put the trade more on the buy side.

Notably, the upward-pointing momentum indicator then implies that the bullish trend will continue. In light of this, the price of D2TUSD might possibly retest the previous high of $0.00553 value which can further extend to the $0.01000 upper resistance value in the upcoming days in its long-term outlook.

D2T (USD) Medium-term Trend: Bullish (1H)
Analyzing the chart below, it is evident that the D2TUSD is in a strong bullish market zone. The price is currently approaching the main upper resistance area making higher highs and higher lows above the two EMAs.
Dash 2 Trade Price Prediction for Today, November 15: D2TUSD Shows Stability as it approaches the $0.00550 Level
The increase in the momentum by the bulls at the $0.00485 supply value during yesterday’s session has enabled the Dash 2 Trade price to stay strong above the resistance lines in its recent price level.

The market price of D2TUSD has just broken up the two EMAs at the $0.00487 supply level as the 1-hour chart opens today. This will give the crypto a high tendency to rise further.

Furthermore, the daily stochastic signals an uptrend, if the bulls could push harder and sustain the coin price above the $0.00520 previous high, the resulting rally may surpass the $0.00550 level and hit the $0.01000 psychological level at the upside in the day ahead in its medium-term perspective.

Is a historic ruling that will serve as the ultimate catalyst for the cryptocurrency bull run about to happen, or will there be another rejection that could scuttle recent price rallies as the deadline of November 17th approaches?


Want a coin that has a huge potential for massive returns? That coin is Dash 2 Trade. Buy D2T now.

Cardano Retraces above $0.34 as It Resumes a New Upswing

Cardano (ADA) Price Long-Term Forecast: Bullish
Cardano (ADA) achieved the $0.3787 historical price barrier on November 10 as it resumes a new upswing. The altcoin reached a peak of $0.3952 before reverting.The price of ADA retraced to $0.34 before holding above the moving average lines. The cryptocurrency’s price is likely to rise further as long as it remains above the moving average lines.

The coin will increase and retest or break the $0.38 barrier level. If buyers are successful, Cardano will return to prior highs of $0.42 and $0.46. On the downside, if the bears breach the 21-day SMA, the present upswing would come to an end. The cryptocurrency will fall to a low of $0.30.

  Cardano Retraces above $0.34 as It Resumes a New Upswing
ADA/USD – Daily Chart

Technical Indicators:
Major supply zones: $1.0, $1.05, $1.10
Major demand zones: $0.25, $0.20, $0.15

Cardano (ADA) Indicator Analysis
Cardano retraces and maintains above the 21-day $MA, implying that the market will rise to previous highs. If the bears had broken below the 21-day SMA, the negative momentum would have continued until the bottom was above the 50-day SMA. The cryptocurrency’s price has broken below the moving average lines on the 4-hour chart but has remained above the $0.34 support.

What Is the Next Move for Cardano (ADA)?
Cardano stays above the 21-day simple moving average as it resumes a new upswing. The price of ADA is growing, reaching a high of $0.35. To achieve the prior highs, the current uptrend must break through the $0.40 resistance zone. Meanwhile, the previous high of $0.38 has not been surpassed since May 28.

  Cardano Retraces above $0.34 as It Resumes a New Upswing
ADA/USD – 4 Hour Chart


You can purchase crypto coins here. Buy LBLOCK

Note: Cryptosignals.org is not a financial advisor. Do your research before investing your funds in any financial asset or presented product or event. We are not responsible for your investing results

FTX and Alameda Shuffle $438 Million in Asset, Sparks Speculation

In a whirlwind of strategic asset movements, embattled FTX and Alameda Research have orchestrated transfers exceeding $438 million across 42 tokens since early November, according to blockchain analytics platform Spot On Chain. Today’s $24 million deposit of SOL, MATIC, and ETH to Kraken and OKX further intensifies the speculation surrounding their motives.

SOL, the favored token in these transfers, has been a cornerstone of FTX and Alameda’s investments, particularly in the Solana blockchain, according to a CryptoPotato report. Despite the significant transfers, a substantial amount of SOL remains in cold storage, gradually unlocking over the next few years (from next year to 2027/2028). This move raises questions about their long-term plans, with potential implications for market dynamics and SOL prices.

Former Associates to FTX and Alameda Boss Start New Crypto Project, Raises Brows

Adding a twist to the narrative, two former associates of Sam Bankman-Fried, FTX and Alameda’s CEO, are launching a new exchange called Trek Labs. Can Sun, FTX’s former general counsel, and Armani Ferrante, a former Alameda software developer, successfully raised $20 million in funding, half of which came from FTX’s venture arm. Trek Labs plans to launch its beta version this month, offering a 10% stake and valuing the platform at over $100 million.

Ferrante’s disclosure about losing funds on FTX due to its collapse amid fraud charges against Bankman-Fried adds a layer of drama to the story. As Trek Labs enters the scene, the industry watches with anticipation, considering the implications of FTX and Alameda’s asset maneuvers and the potential competition from the new exchange.

The evolving crypto landscape is laden with intrigue and scrutiny. Investors and traders are advised to keenly observe these developments and consider their potential impact on the crypto market.


Interested In Learning How To Use Leverage While Trading? Find Out Here

Polygon (MATIC/USD) Price Consolidates Positively, Eyeing $1

Polygon Price Prediction – November 14
Bulls in the market operations that involve Polygon and the US Dollar have continued to outpace the activities of bears as the cryptocurrency trade consolidates positively, eyeing the resistance of $1.

As of this technical piece, the market’s trend pattern does not offer a good entry point for sellers to make a recovery. In a promissory note, there has been an indication to expect additional rising forces beyond the current trading price of $0.0938 at a positively adjusted average percentage rate of 6.23. An extension in valuation will take effect without a clear entry pattern if sellers are discovered to be hesitant to delay the advances northward at this time.

MATIC/USD Market
Key Levels:
Resistance levels: $1, $1.10, $1.20
Support levels: $0.75, $0.65, $0.55

MATIC/USD – Daily Chart
The MATIC/USD daily chart showcases the crypto market consolidating positively alongside the upper Bollinger Band trend line, eyeing the resistance level of $1.

Variant candlesticks have formed alongside the pathway of the upper Bollinger Band trend line; the middle trend line points toward the north direction, with the lower side staying below the point of $0.60. The stochastic oscillators are in a repositioning condition, trying to point back northward, close to 40 to around 80 values.
Polygon (MATIC/USD) Price Consolidates Positively, Eyeing $1
What kind of challenging resistance trade scenario might thwart the bullish momentum in the MATIC/USD market presently?
Over time, MATIC/USD trade buyers have been pushing northwardly alongside the way of the upper Bollinger Band indicator, given that the crypto trade consolidates positively, eyeing the resistance line of $1.

A strong pullback coupled with a sudden reversal at a specific moment would enable bears in the MATIC/USD market to launch a forceful move against some of the established appreciation values. Short-position takers should exercise caution before entering the market in the interim, particularly if the price appears to be forming a slow-and-steady upward trend.

When viewed from a technical perspective, long-position placers seem to have possessed the necessary marginal inclination to enter a bullish trading cycle. Assuming that the assumption materializes as expected, investors ought to adopt the trading spirit strategy of purchasing and holding until the complete upsurge sessions unfold in the coming months.
Polygon (MATIC/USD) Price Consolidates Positively, Eyeing $1
MATIC/BTC Price Analysis
In comparison, the Polygon market consolidates positively against the valuation of Bitcoin, eyeing some resistances above the upper Bollinger Band trend line.

The higher Bollinger Band trend lines extend northward along a string of daily bullish candlesticks, while the lower line remains well below them. The center line then points northward from the lower section. From about the value of 80, the stochastic oscillators are moving northward. In contrast to the counter-trading crypto economy, the basic cryptocurrency has built up a formidable speed toward attaining most rises rather than falling victim to declines. Furthermore, these presumptions typically come to pass in subsequent endeavors.

Note: Cryptosignals.org is not a financial advisor. Do your research before investing your funds in any financial asset or presented product or event. We are not responsible for your investing results.


You can purchase Lucky Block here. Buy LBLOCK