Bitcoin Cash (BCHUSD) Pulls Back From Local Highs as Buyers Defend Key Support Zone

Bitcoin Cash Price Prediction — January 7th

Bitcoin Cash (BCHUSD) is trading around $630.0 after failing to sustain the recent advance toward the $650.0 supply area. Price action on both the daily and 4-hour charts remains technically constructive relative to November lows. Nevertheless, the market is clearly in a pause/pullback phase following an overextended upswing.

Bitcoin Cash (BCHUSD) Market Key Levels

Resistance levels: $650.0, $630.0
Support levels: $613.0, $520.0

Bitcoin Cash (BCHUSD) Pulls Back From Local Highs as Buyers Defend Key Support Zone

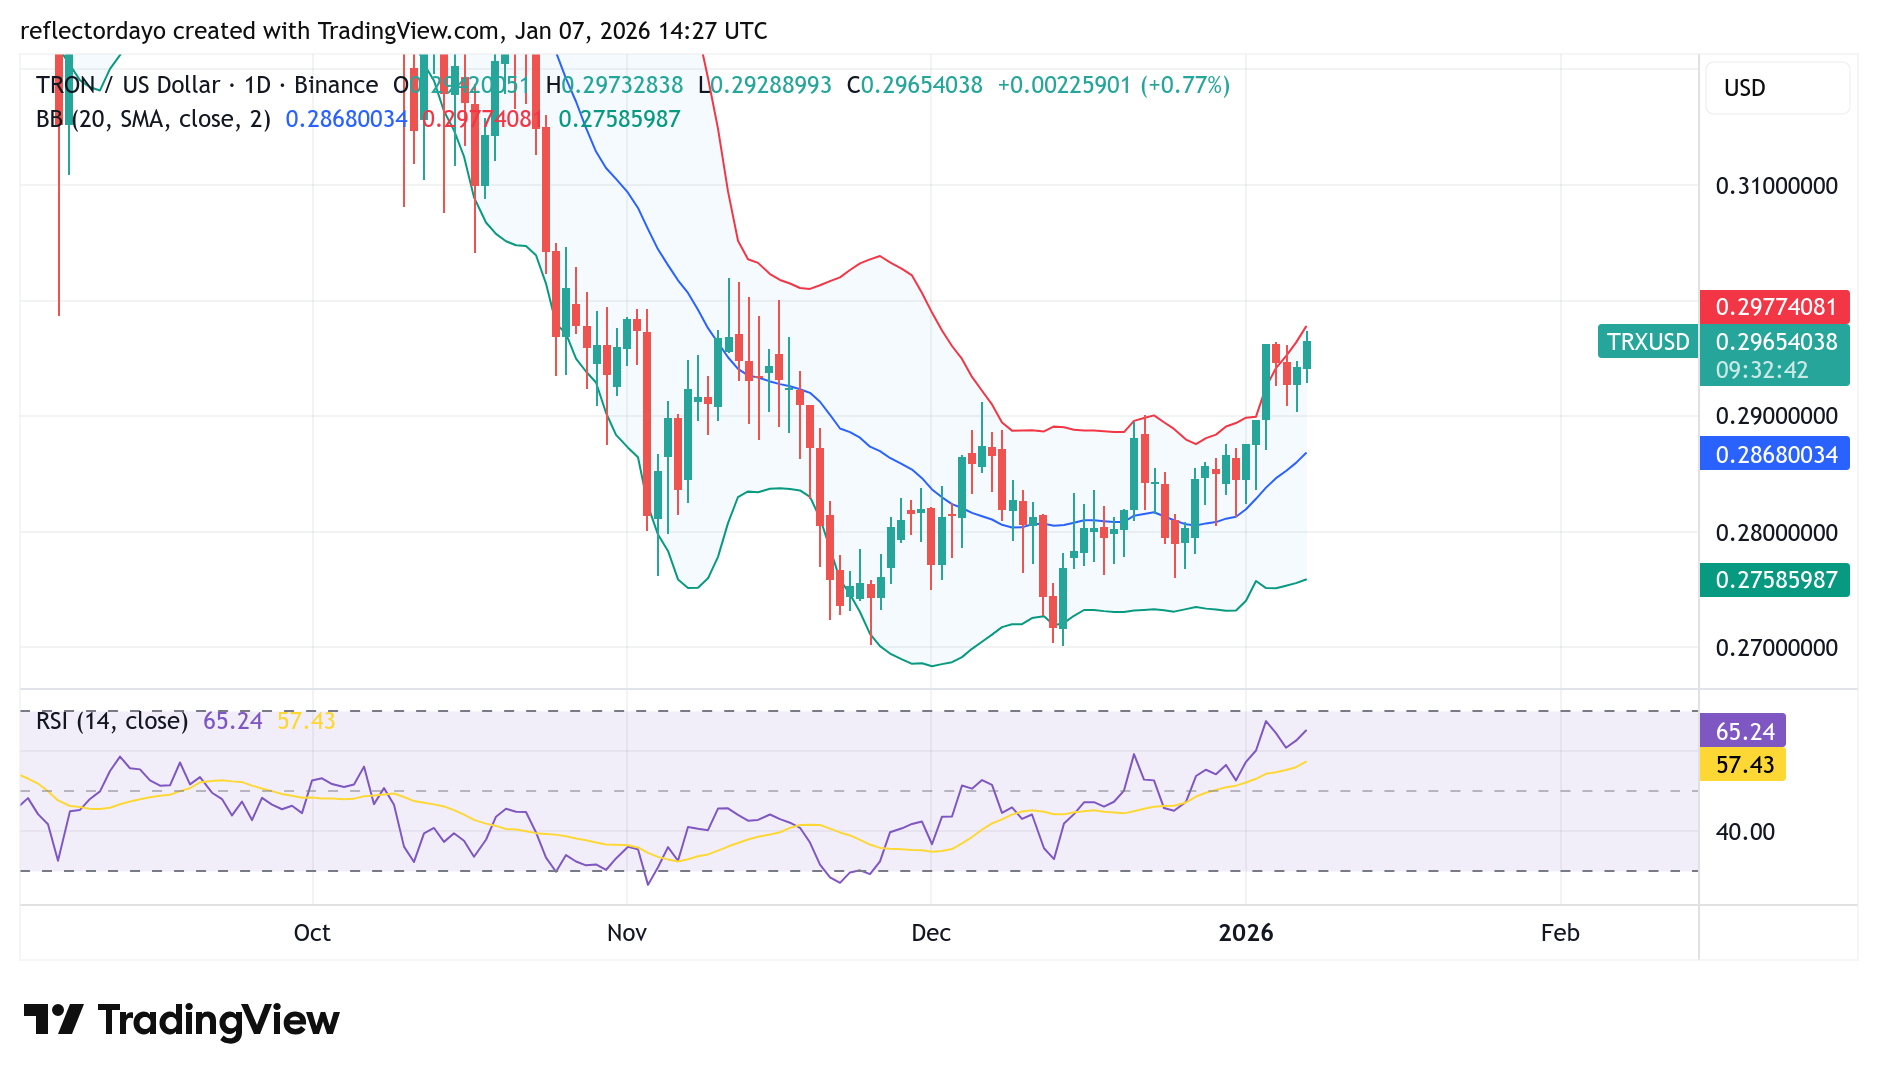
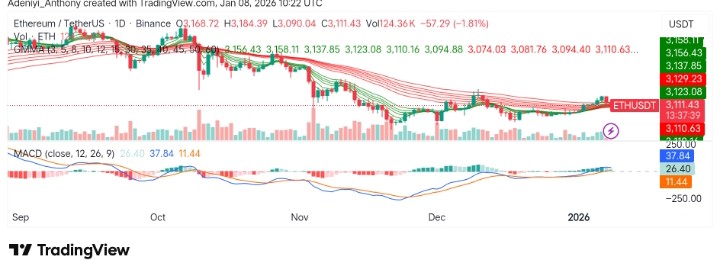
Bitcoin Cash Long-Term Trend — Bullish (Daily Chart)

On the daily timeframe, BCH remains in a broader uptrend structure relative to the mid-year price context, forming higher lows and generally trending above key support levels. However, the recent leg toward $650.0 ran out of steam and has rolled over into a corrective drift.

What is the market outlook for BCHUSD?

Daily momentum (Stochastic) is elevated and rolling over from the 60–70 zone often characteristic of markets that shift from impulsive moves into digestion. This aligns with the current pullback phase.

Right now buyers are still present, but late longs may get tested as the market pauses. A reclaim and hold above $650.0 would signal renewed buyer conviction and attract momentum traders, potentially validating the broader uptrend implied by earlier structure. This would align with positive crypto signals across multiple higher timeframes and open the door toward the next major supply zones.

Bitcoin Cash (BCHUSD) Pulls Back From Local Highs as Buyers Defend Key Support Zone

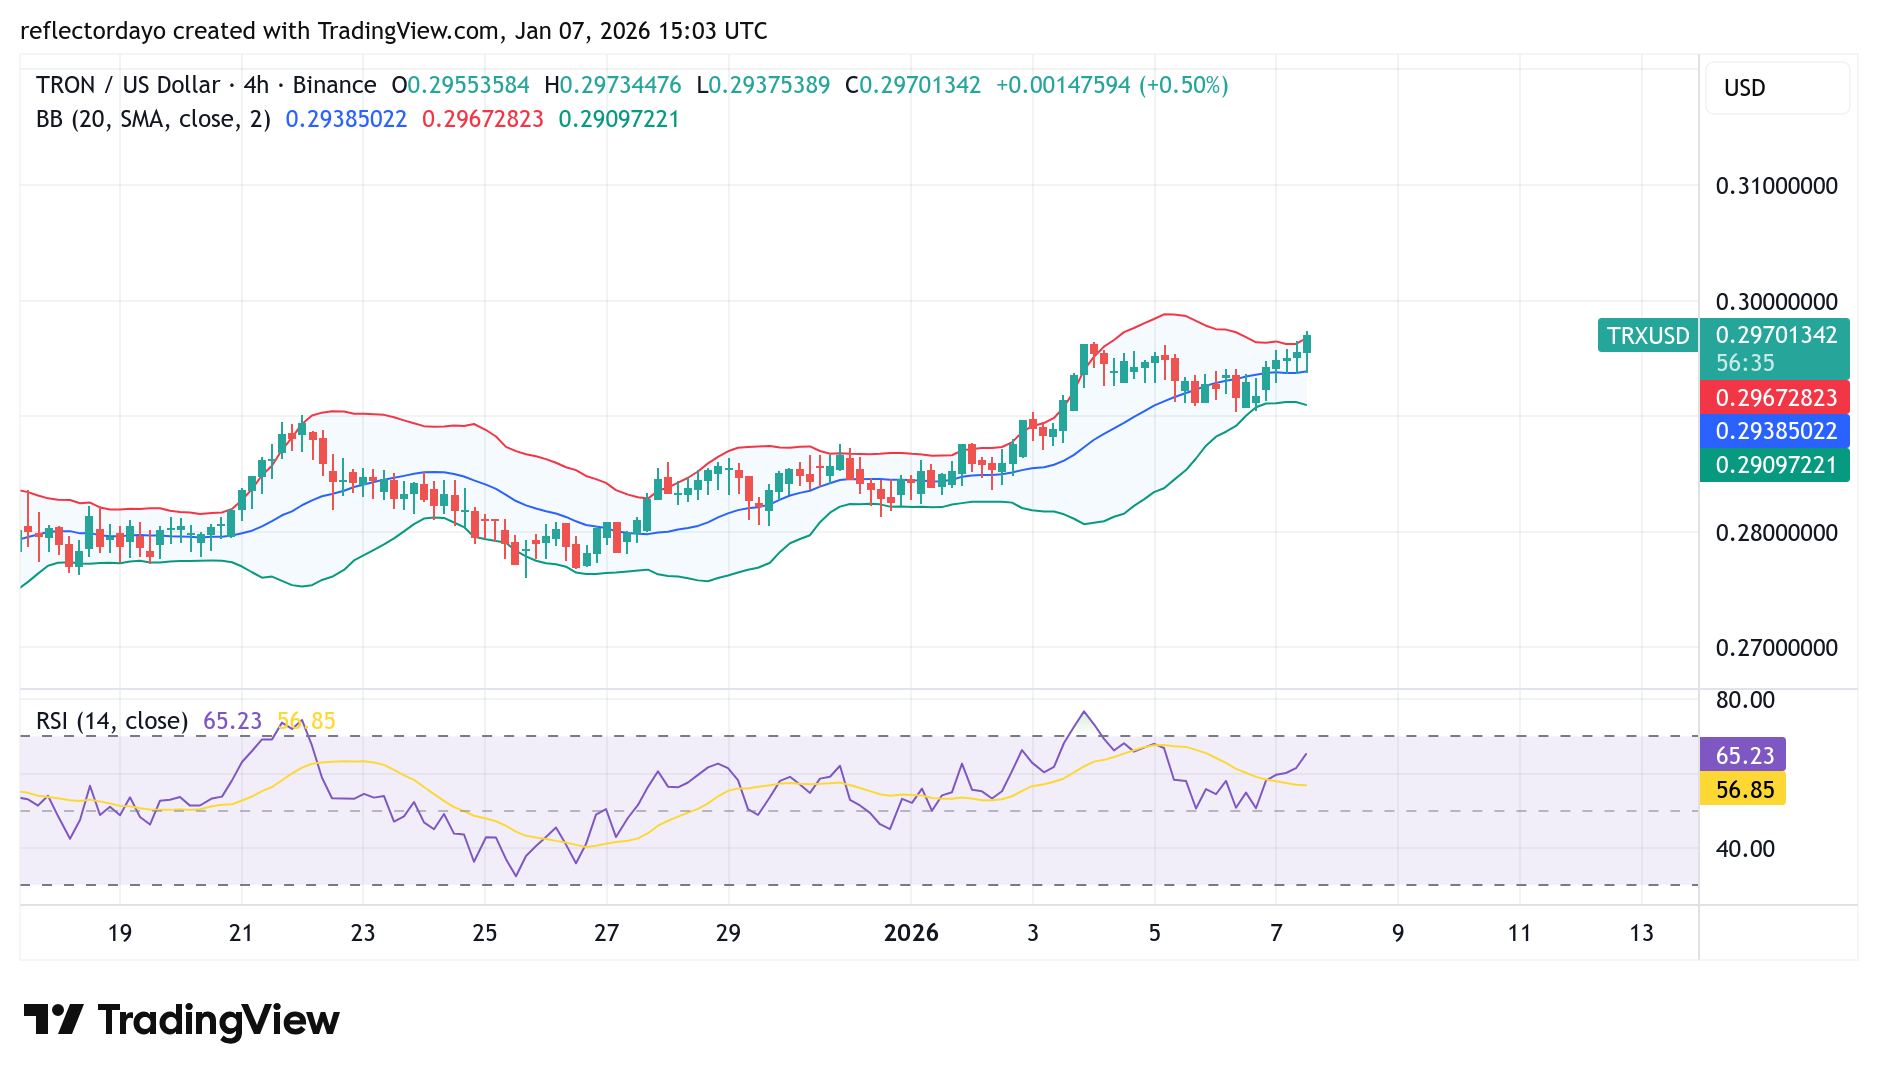
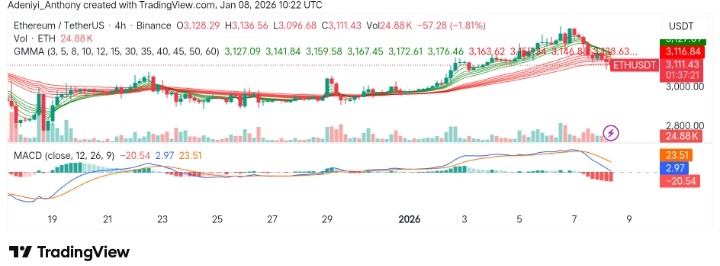
Bitcoin Cash Short-Term Trend — Bearish (4-Hour Chart)

The 4-hour chart shows a more defined retracement: price topped near $650.0 and has retraced back toward the $630.0 area. Short-term Stochastic is dipping toward lower readings near oversold territory, suggesting short-term selling pressure is getting extended. While this does not guarantee an immediate bounce, it increases the likelihood that BCH either.


BCH/USD Market Statistics
Current Price: $630.00
Market Capitalization: $11.3B
Trading Volume: $420M

Place winning BCH trades with us. Get BCH here

Ethereum (ETH/USDT) Struggles to Continue Rally as Bullish Momentum Drops

The market for Ethereum against Tether over the last 24 hours has dwindled by 2.85% of its initial price. This record shows the pair is performing below the broader crypto market fall of 2.21% as the $450 million liquidation and BitMine’s $105 million buy fail to offset bearish momentum.

Recently, the pair has been trading well above $3,000, but the Guppy Multiple Moving Averages (GMMA) suggests indecision, while the MACD signals waning bullish pressure.

Currently, Ethereum trades at $3,110.40 with more than 124,000 volumes on the daily timeframe.

Ethereum (ETH/USDT) Struggles to Continue Rally as Bullish Momentum Drops
ETHUSDT-Daily Chart

Technical Indicators

Major Resistance Levels: $3,168.72, $3,300.00, and $3,500.00

Major Support Levels: $3,074.03, $3,000.00, and $2,908.00

Technical Analysis

Technically, Ethereum against Tether on the daily chart appears to be consolidating after the initial rally. The price saw a significant rise compared to the $2,900 level it was at late last year. However, the cluster of EMAs suggests bullish momentum seems to have dropped, and traders are currently deciding the trend.

From another angle, the MACD beneath the chart signals that bullish strength is waning as the histograms plummet toward the signal line. To this end, this hints at a potential fall in price before another leg up. A move below $3,074 may signal the start of a slight pullback towards $2,900.

Meanwhile, @cryptoskullx has pointed out the latest Ethereum development on X. The analyst reveals the astronomical increase from on-chain metrics as figures from DefiLama show bullish dominance. Finally, it appears that the analyst is confident the token will be worth $5,000 in the future.

Today’s Ethereum Update

The market for Ethereum on a larger timeframe has not really undergone any significant changes. However, the micro charts display slight changes as current price action suggests the formation of another low. Meanwhile, this does not translate to the fact that the token cannot record a little profit, but a reaction from the $3,300 or somewhere is needed to determine such a move.

ETH/USDT Analysis: Displaying Signs of Minor Pullbacks

On the 4-hour chart, ETH/USDT, after a series of moves to the north, appears to be showing signs of a slight correction. The GMMA on the chart suggests consolidation as the sets of EMAs converge to form near-straight lines.

Also, the MACD displays bearish divergence as the histograms form beneath the signal line. To this end, a short-term reversal may be seen before recovery in the near term as the token holds a lot of promising upside movement.

Ethereum (ETH/USDT) Struggles to Continue Rally as Bullish Momentum Drops
ETHUSDT-4H Chart


You can purchase crypto coins here. Buy Crypto

Uniswap (UNI) Price Prediction: UNI/USDT Fails to Find Traction

Date: January 8, 2026

At a time when the broader market appears to be experiencing a widespread surge in momentum, the Uniswap market has failed to benefit from a similar wave of bullish strength. As a result, the token remains positioned for further downside price movement.

UNI/USDT Long-Term Trend — Bearish (Daily Chart)

Key Price Levels

Resistance: $6.00, $7.00, $8.00

Support: $5.50, $5.00, $4.50

Uniswap (UNI) Price Prediction: UNI/USDT Fails to Find Traction

Recent price action has hovered around the 9-day Exponential Moving Average (EMA). During the previous session, the market dipped below this EMA, and the ongoing session has remained beneath it. Additionally, the Stochastic Relative Strength Index (SRSI) has produced a downward crossover just above the 50 level and is now declining rapidly toward the oversold region.

Uniswap Price Prediction: Uniswap Continues to Lack an Optimistic Outlook

On the daily Uniswap price chart, price action has been trending downward over the past two sessions. This decline was particularly pronounced in the previous session, as reflected by the size of the price candle.

The ongoing session continues along the same bearish path, albeit at a slower pace, while trading below the 9-day EMA curve. The SRSI indicator also suggests that bearish momentum remains dominant. Consequently, the market may continue to slide toward lower price levels.

Uniswap Price Prediction: UNI/USDT Stays Suppressed (4-Hour Chart)

The fact that bearish forces remain in control is even more evident on shorter time frames. The most recent price candle on the 4-hour chart is green but remains below the 9-day EMA curve, indicating a lack of strength to initiate a meaningful upside move.

Uniswap (UNI) Price Prediction: UNI/USDT Fails to Find Traction

Meanwhile, the SRSI indicator lines are deep within the oversold region and are moving sideways, reflecting persistent downside pressure. In line with this trend, price action may continue targeting the $5.50 level, with a possible extension toward the $5.25 mark.

Get Uniswap (UNI) here. Buy UNI 

ENJ/USD Holds $0.0320 as Volatility Compresses

ENJ Price Analysis – Enjin Coin shows exhaustion following volatility

Enjin Coin (ENJUSD) is trading near $0.0320 price zone, down 2.13% on the day, as price consolidates near its short-term pivot. After a prolonged downtrend, the token is attempting to stabilize, but momentum indicators suggest the market may be nearing exhaustion. Volatility remains compressed, and price action is coiling between key support and resistance zones.

ENJUSD Key Levels:

Support Levels: $0.0230 $0.0200
Resistance Levels: $0.0550, $0.0850

KRAKEN:ENJUSD Chart Image by Gaint-writer
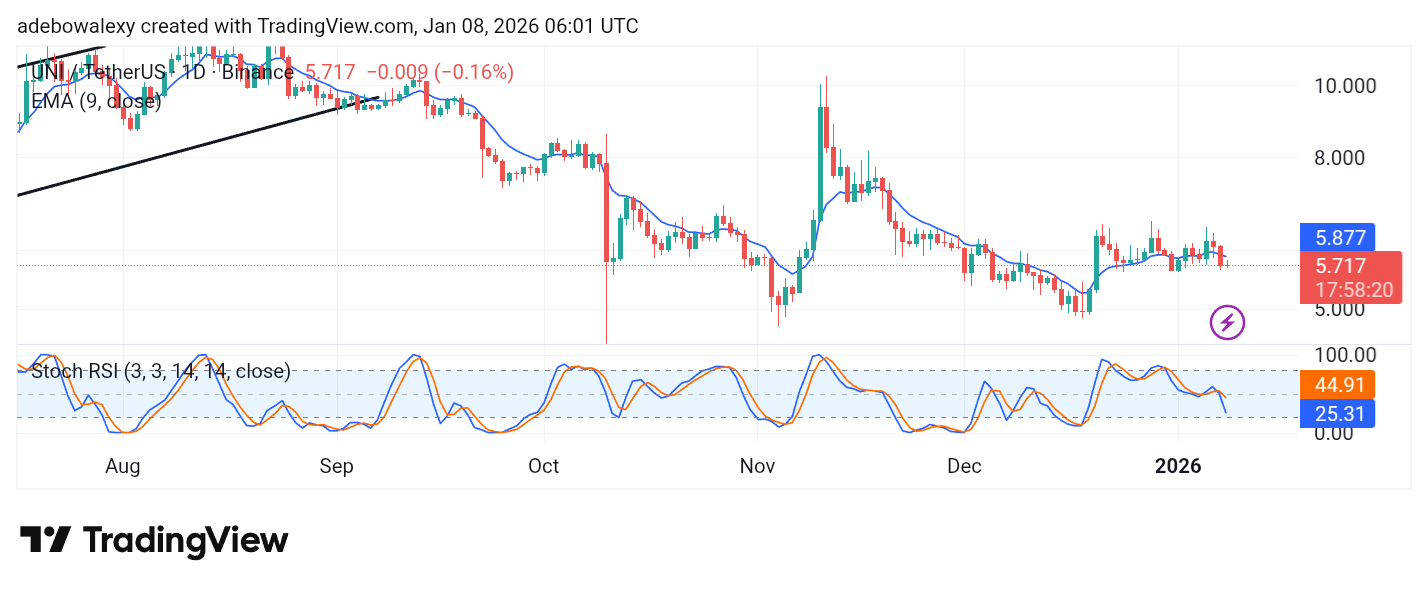
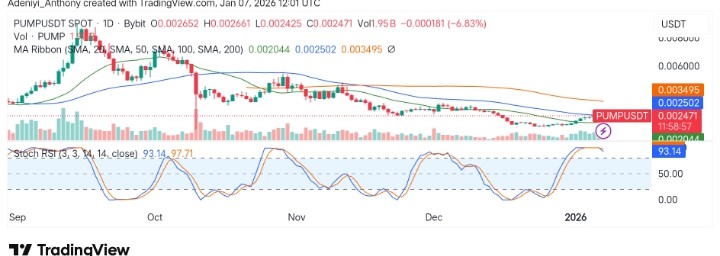
Enjin Coin remains in a broader bearish structure, with price unable to reclaim the $0.0550 breakdown zone. The current base near $0.0321 has acted as a pivot, but rallies have lacked conviction.

The Stochastic Oscillator is elevated indicating potential overbought conditions and a possible pause in upward momentum. ADR is at 0.0014, reflecting moderate volatility and a coiling setup.

A breakout above $0.0559 would confirm bullish continuation, while failure to hold current levels could expose $0.0232 as the next support zone. The market is coiling, and directional energy is building. Traders should watch for a decisive move above $0.0350 to confirm momentum strength.

KRAKEN:ENJUSD Chart Image by Gaint-writerMarket Expectation

On the 4-hour chart, ENJ is trading between $0.0320 and $0.0320, showing signs of short-term balance. The Stochastic Oscillator is cooling suggesting momentum is fading but not yet reversing. ADR is at 0.0008, confirming that volatility has contracted. This setup often precedes expansion, with the next impulse likely defined by a break above $0.0350 or a drop below $0.0300 key level.

You can purchase Lucky Block here.  Buy LBLOCK

Note: Cryptosignals.org is not a financial advisor. Do your research before investing your funds in any financial asset or presented product or event. We are not responsible for your investing results

CHZ (CHZ/USDT) Stalls Near $0.0440 Market Zone as Momentum Turns Oversold

CHZUSD Price Analysis – Chiliz Shows Signs of Exhaustion After Recent Rally

CHZ/USDT is currently trading around $0.0440, easing slightly after testing the $0.0472 resistance zone. Price action has cooled following a multi-day climb, and momentum indicators now reflect oversold conditions on the lower timeframe.

CHZ/USDT Market Key Levels

Resistance levels: $0.0470, $0.0500
Support levels: $0.0340, $0.0283, $0.0200

CHZ (CHZ/USDT) Stalls Near $0.0440 Market Zone as Momentum Turns OversoldThe market is hovering near a short-term pivot, with volatility compressed and candles flattening. This pause does not yet confirm a breakdown, but the Stochastic Oscillator signals deep oversold territory, which often precedes a short-term bounce or range stabilization.

On the daily chart, Chiliz price is consolidating near the $0.044–$0.045 zone, and traders are watching for either a recovery push or a clean rejection. From a higher-timeframe perspective, CHZ remains in a broader corrective structure following its decline from the $0.0500 zone.

The current price region around $0.044–$0.047 has acted as a congestion zone in prior cycles, and the narrowing ADR reflects a market still lacking strong directional conviction. A close above $0.0470 market level would be the first structural signal of bullish continuation.

CHZ (CHZ/USDT) Stalls Near $0.0440 Market Zone as Momentum Turns Oversold

Market Expectation

On the lower timeframe, CHZ is trading in a tight band with candles showing reduced range and volume. Price is hovering near its short-term average, and momentum is stretched. This type of behavior often leads to a pause or minor retracement before the next impulse.

A breakdown below $0.0435 would expose $0.0340–$0.0283 as the next support zone. Conversely, a sustained close above $0.0472 could trigger a move toward $0.0500, where prior resistance remains structurally intact.

You can purchase Lucky Block here.  Buy LBLOCK

Note: Cryptosignals.org is not a financial advisor. Do your research before investing your funds in any financial asset or presented product or event. We are not responsible for your investing results

PI/USDT Price Analysis – Pi shows signs of strength but enters overbought territory

Pi (PI/USDT) Holds Above $0.210 as Momentum Stretches Higher

PI/USDT is currently trading around $0.2120 key level extending its recovery after defending the $0.2000 support zone. Price action has shifted into a short-term bullish phase, with candles pressing higher and momentum indicators now entering overbought territory. The market is testing a key reaction level, but volatility remains subdued.

PI/USDT Market Key Levels

Resistance levels: $0.3090, $0.4090
Support levels: $0.2000, $0.1840

PI/USDT Price Analysis – Pi shows signs of strength but enters overbought territory
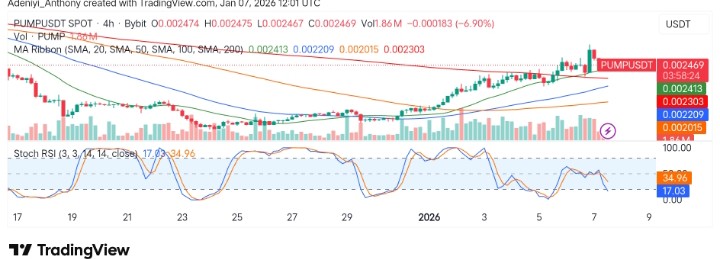
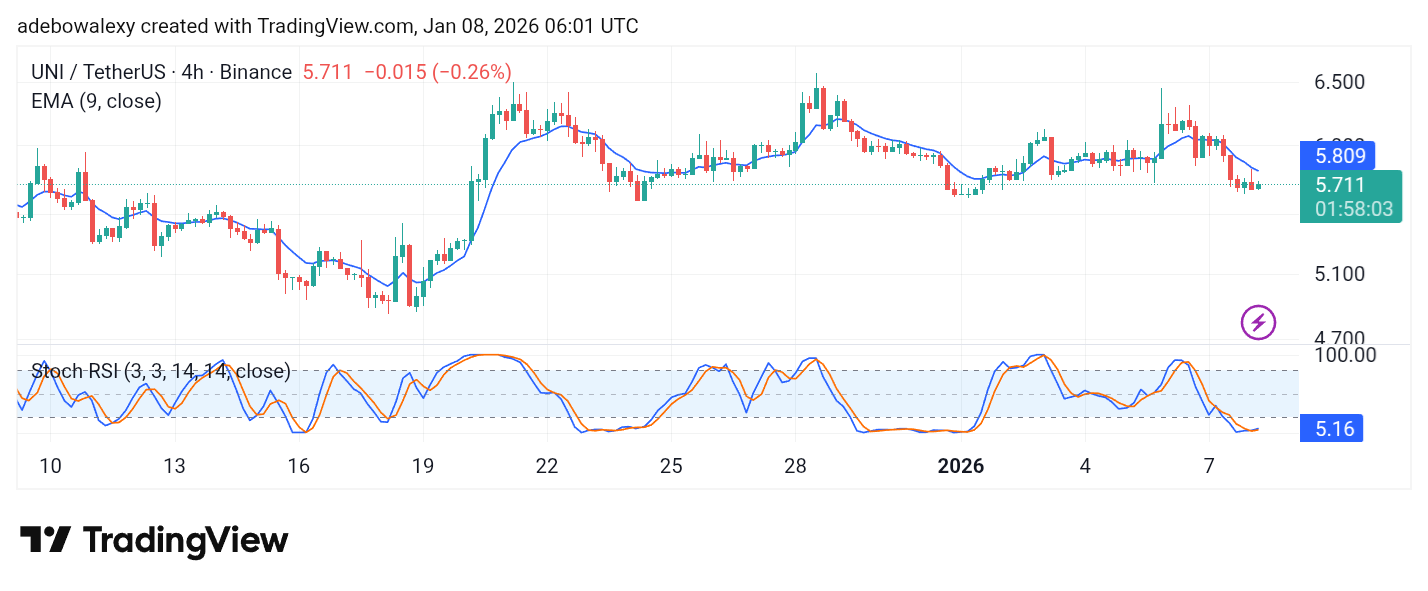
This move does not yet confirm a full trend reversal. However, the Stochastic Oscillator signals stretched momentum, which often precedes a pause or minor pullback. Price is hovering near the top of its recent range, and traders will be watching for either a breakout continuation or signs of exhaustion.

From a higher-timeframe perspective, PI remains within a broader corrective structure following its decline from the $0.70 zone. The current price region around $0.212–$0.309 has acted as a congestion zone in prior cycles, and the narrowing ADR reflects a market still lacking strong directional conviction. A close above $0.300 would be the first structural signal of bullish continuation.

PI/USDT Price Analysis – Pi shows signs of strength but enters overbought territoryMarket Expectation

On the lower timeframe, PI is trading in a tight band with candles showing reduced range and volume. Price is hovering near its short-term average, and momentum is stretched. This type of behavior often leads to a pause or minor retracement before the next impulse.

A breakdown below $0.2000 zone would expose $0.1840 key level as the next support zone. Conversely, a sustained close above $0.2124–$0.2200 could trigger a move toward $0.3094, where prior resistance remains structurally intact.

You can purchase Lucky Block here.  Buy LBLOCK

Note: Cryptosignals.org is not a financial advisor. Do your research before investing your funds in any financial asset or presented product or event. We are not responsible for your investing results

SUI (SUIUSDT) Reclaims Key Mid-Range as Buyers Push Into Overhead Supply

SUI Price Prediction — January 6

SUI (SUI/USDT) is trading around $2.00, extending a steady recovery after weeks of sideways compression. Price has pushed cleanly above the mid-range structure and is now challenging a clearly defined resistance zone.


SUI (SUIUSDT) Market Key Levels

Resistance levels: $2.00, $3.10, $3.70

Support levels: $1.80, $1.30, $0.60

SUI (SUIUSDT) Reclaims Key Mid-Range as Buyers Push Into Overhead Supply

SUI Long-Term Trend — Bullish (Daily Chart)

The recent expansion in bullish candles suggests renewed buyer participation, though price is now entering an area where supply has previously capped upside moves. This shift marks a change in market behavior, moving from prolonged consolidation into an active test of higher value zones.

What Is the Market Outlook for SUI?

On the daily chart, SUI is transitioning out of a bearish structure into a recovery phase. After forming a base above the $1.30 region, price has reclaimed the mid-Bollinger area and is now pressing higher with improving momentum.

The move toward $2.00 is technically significant, as this level previously acted as a distribution zone during the broader decline. A sustained hold above this area would signal that sellers are losing control and that the market is attempting to rebuild bullish structure.

SUI (SUIUSDT) Reclaims Key Mid-Range as Buyers Push Into Overhead Supply

SUI Short-Term Trend — Bullish (4-Hour Chart)

SUI is trading in the upper half of the Bollinger envelope, with price accelerating after a prolonged period of low volatility. Momentum indicators remain strong, but the market is now stretched relative to recent ranges.

This creates a bullish short-term bias, but also increases the likelihood of brief consolidations or pullbacks.


SUI (SUI) Market Statistics

Current Price: $2.00
Market Capitalization: $2.30B
24H Trading Volume: $720.0M

Place winning SUI trades with us. Get SUI here

Tron (TRX/USD) Bullish Recovery in Progress

Tron has featured among today’s trending cryptocurrencies, posting a modest gain of around 0.76% so far. While the move may appear limited, it reflects a bullish recovery that has been unfolding since mid-December, when price action rebounded from the $0.27 level. The $0.29 price zone, which previously acted as a formidable resistance, was eventually breached at the start of the new year, reinforcing the ongoing recovery trend.

Tron (TRX/USD) Market Data

  • TRX/USD Price Now: $0.2965
  • TRX/USD Market Capitalization: $27.87 billion
  • TRX/USD Circulating Supply: 94.7 billion TRX
  • TRX/USD Total Supply: 94.7 billion TRX
  • TRX/USD CoinMarketCap Ranking: #8

Tron (TRX/USD) Bullish Recovery in Progress

Key Levels to Monitor

  • Resistance: $0.30, $0.31, $0.32
  • Support: $0.27, $0.26, $0.25

Tron Market Analysis: Technical Viewpoint

Breaking and sustaining above the $0.29 price level has proven to be a boost, adding credibility to the ongoing bullish recovery. However, as the crypto signal pushes closer to the $0.30 mark, caution is beginning to build among traders. This has led to the formation of a near-term, or proxy resistance around $0.2965. Market participants are closely watching how Tron behaves around this level, as it will likely determine whether the price can extend its advance toward the $0.30 psychological resistance.
Tron (TRX/USD) Bullish Recovery in Progress

TRX/USD 4-Hour Chart Outlook

When we zoom into a smaller timeframe, a consolidation pattern becomes more evident. The $0.2900 and $0.2965 levels have remained firm, forming a price channel that acts as support and resistance, respectively. If the market fails to break above the $0.2965 resistance, price may struggle to advance toward the $0.30 mark, and the consolidation phase is likely to continue above the $0.29 support level.

TRON’s vision for 2026: fast, low-cost, and reliable at scale—built to power everyday payments, stablecoins, and real on-chain activity

Trade crypto coins on BYBIT

Pump.fun (PUMP/USDT) Sees Consolidation Following Recent Rally

Pump.fun against Tether has seen a modest rise of 0.07% over the past 24 hours. This shows the pair is showing minimal short-term movement to the top but appears to be benefiting more from the significant gains (27.97%) over the course of seven days.

As it stands, this stability in price portrays the broader momentum amidst the memecoin sector as the market displays optimism. To this end, analysts have pointed to the surge in platform activities and daily volume as the major reasons for recording these multi-month highs.

Currently, Pump.fun trades at $0.002472, recording 1.94 billion volumes on the daily timeframe.

Pump.fun (PUMP/USDT) Sees Consolidation Following Recent Rally
PUMPUSDT- Daily Chart

Technical Indicators

Major Resistance Levels: $0.002502, $0.003495, and $0.004000

Major Support Levels: $0.002425, $0.002044, and $0.0020000

Technical Analysis

Technically, on the daily chart, it appears that Pump.fun against Tether in recent times has been trending upward, printing green candles for an extensive period of time. As it stands, the pair sits above major simple moving averages on the daily chart, suggesting the bullish momentum might still be intact as the price advances towards immediate resistance at $0.002502.

However, the Stochastic RSI signals the likelihood of a short-term reversal as the lines of the indicator drop sharply to the south. This suggests the price may be due for a slight correction as an overbought condition appears visible.

To this end, the volume as seen in the recent week is beginning to drop, signaling possible consolidation as the bearish candles are spotted. A move below in immediate support may suggest a retest of previous support at $0.002044.

Additionally, @Crypto.news, in a recent tweet, has revealed that Pump.fun has broken its 20-day moving average, moving 30% over the week. Also, the tweet reveals that the current movement in the market is a result of heated trading action in the memecoin market. To this end, analysts signal caution that the recorded upside remains fragile as the token approaches immediate resistance.

PUMP/USDT: Pulling Back After Strong Push

Despite gains recorded by PUMP/USDT in the previous trading session, the price appears to be testing a lower support at $0.002467 as the struggle to maintain upside momentum continues.

However, the price seems to be above the moving averages, but the formation of successive bearish candles suggests the pair may be extending downward. Additionally, the lines of the momentum oscillator show that the price is operating near the oversold region as volumes increase in that direction.

To this end, if the support at $0.002425 cannot be maintained, lower levels may be revealed in subsequent sessions.

Pump.fun (PUMP/USDT) Sees Consolidation Following Recent Rally
PUMPUSDT-4H Chart


You can purchase crypto coins here. Buy Crypto