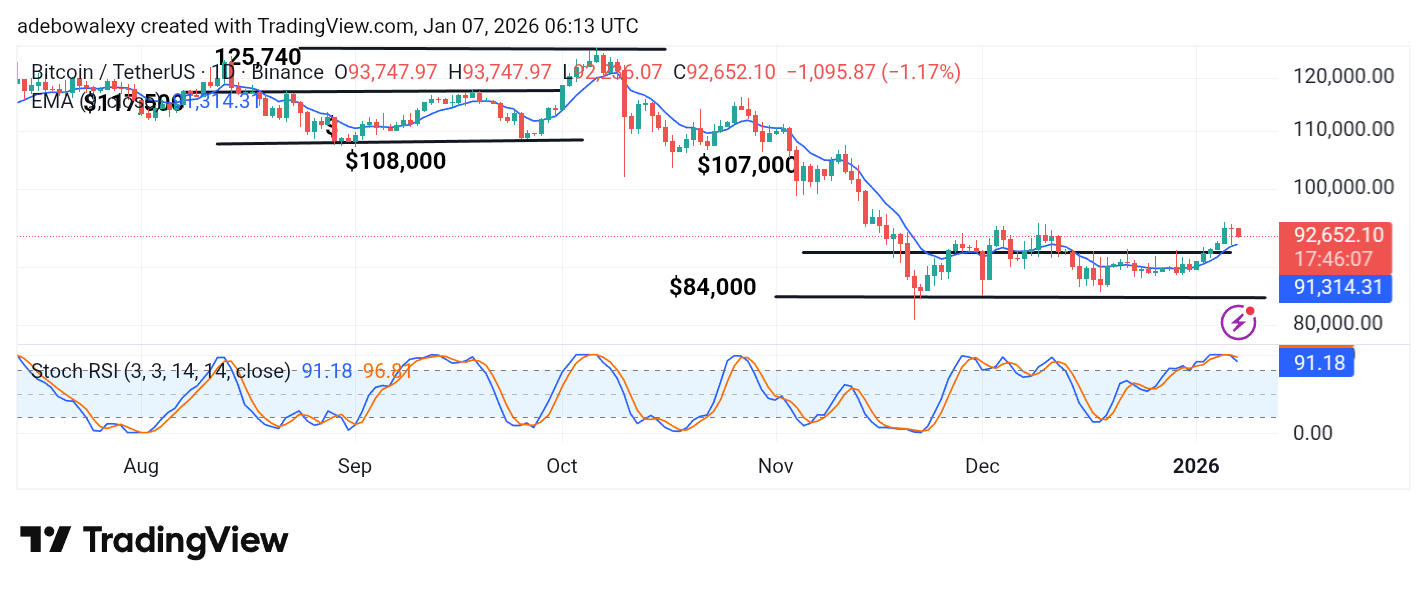
Over the last 24 hours, the market for Polkadot against Tether has experienced a 1.75% decline to $2.19, underperforming the broader crypto market, which saw a 1.16% drop. As it stands, analysts have noted that factors enhancing price failure to maintain a hold above the support lines are the late U.S. session sell-off and dominance from Bitcoin (58.2%).
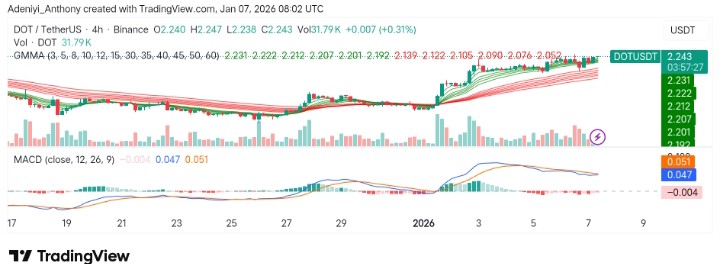
Additionally, profit-taking activities seemed to be the driving force behind this downturn, as traders locked in gains following a 20% weekly rally. However, despite the recent fall in price level, the Guppy Multiple Moving Averages (GMMA) appears to be displaying a positive setup, and the MACD warns of an impending pullback before further growth.
Currently, Polkadot trades at $2.243 with over 1.6 million traded volumes on the daily timeframe.
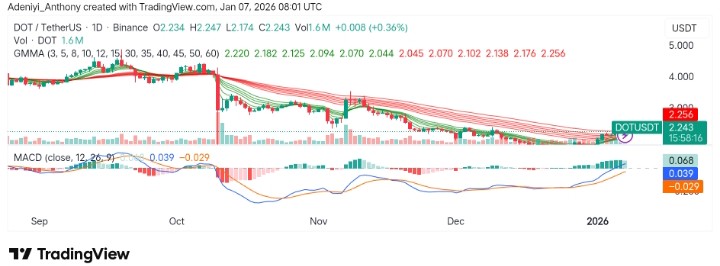
Technical Indicators
Major Resistance Levels: $2.255, $2.350, and $3.000
Major Support Levels: $2.231, $2.222, and $2.201
Technical Analysis
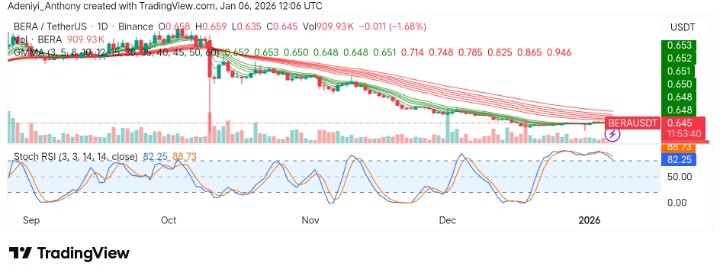
On the daily timeframe, Polkadot against Tether seems to have recorded impressive gains at the beginning of the week, showing massive recovery into the $2.00 level. However, it appears the pair is facing difficulties extending the gains, as it seems the bulls are facing resistance around $2.250.
Additionally, the MACD, the momentum oscillator, seems to be displaying waning bullish strengths as the impending crossover of the GMMA halts momentarily. To this end, the continuation of the current uptrend relies on improving buying strength, as the momentum indicator suggests a slight price correction ahead.
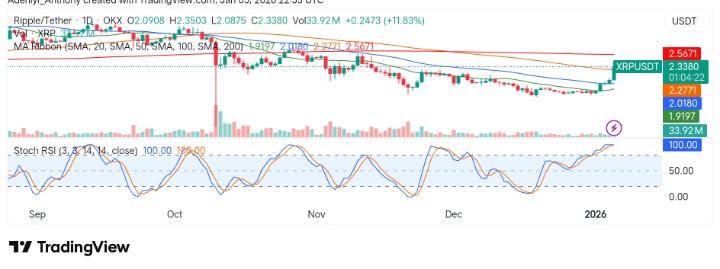
#BREAKING $DOT Price Prediction: #Polkadot Eyes $3.30 Target as Technical Momentum Builds for February 2026
DOT price prediction points to $3.30 medium-term target as #Polkadot breaks above key resistance. Technical analysis suggests 50% upside potential within 4-6 weeks.
#…
— Bpay News (@bpaynews) January 6, 2026
Meanwhile, @Bpaynews has reported that Polkadot price analysis shows that the token seems to be targeting $3.30 for February 2026, suggesting an impending build of technical momentum. To this end, the analysts are of the opinion that the token has broken above key resistance levels, with a predicted 50% upside potential within the next 4-6 weeks.
DOT/USDT Analysis: Price Struggles Amidst Fallen Momentum
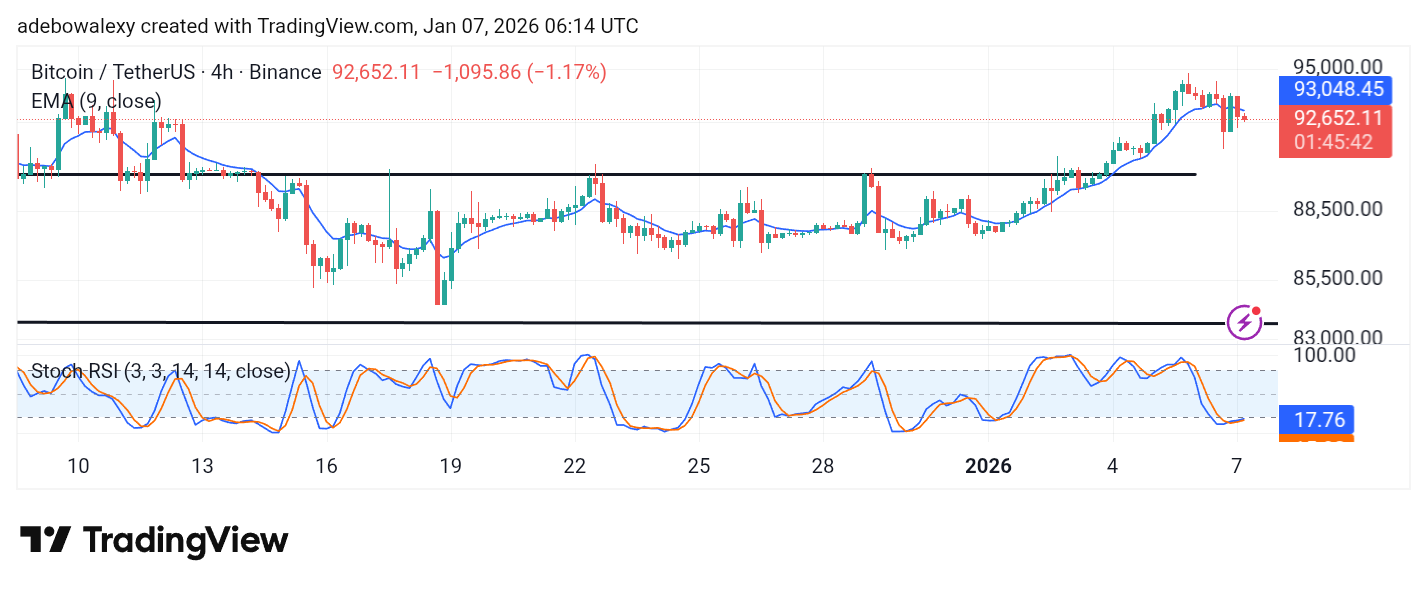
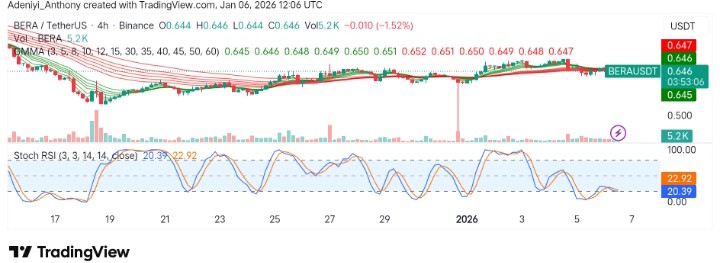
On the 4-hour timeframe, DOT/USDT appears to be building on existing gains above the clusters of multiple spreading EMAs. However, the momentum indicator shows the bears have the potential to dominate, considering the formed histograms.
As it stands, if DOT were to ascend further, it would depend on buying volume, as current participatory levels remain low (31k). To this end, a move above $2.25 in the coming session would indicate the readiness to move to the north; otherwise, a slight dip should be expected.
You can purchase crypto coins here. Buy Crypto


 TRON Long-Term Trend — Bullish (Daily Chart)
 TRON Short-Term Trend — Bullish (4-Hour Chart)