MANA/USDT is currently trading around $0.1390 key area, showing a modest recovery after defending the $0.1160 support zone. The bounce has lifted price back into the mid-range, but momentum indicators are now entering overbought territory, suggesting that upside may be limited unless volume expands.
MANA/USDT Market Key Levels
Resistance levels: $0.1570, $0.1940, $0.2460 Support levels: $0.1160, $0.1000, $0.0910
The market is testing a key reaction level, with volatility still subdued. This rebound does not yet qualify as a confirmed trend reversal. However, the Stochastic Oscillator signals overbought conditions, which often precede short-term pullbacks or consolidation.
Price is approaching the $0.14–$0.150 zone, a region that previously acted as a pivot and may attract sellers again. From a higher-timeframe perspective, MANA remains in a broader downtrend structure following its decline from the $0.39 zone.
The current price region around $0.139–$0.150 has served as a congestion zone in prior cycles. Right now the narrowing ADR reflects a market still lacking directional conviction. Traders are watching for either a breakout above $0.150 market zone or a rejection that reopens the path toward $0.1160 price level.
Market Expectation
On the lower timeframe, MANA is trading in a tight band with candles showing reduced range and volume. Price is hovering near its short-term average, and momentum is stretched. This type of behavior often leads to a pause or minor retracement before the next impulse. A breakdown below $0.1360 would expose $0.1169–$0.1000 as the next support zone.
Note:Cryptosignals.org is not a financial advisor. Do your research before investing your funds in any financial asset or presented product or event. We are not responsible for your investing results.
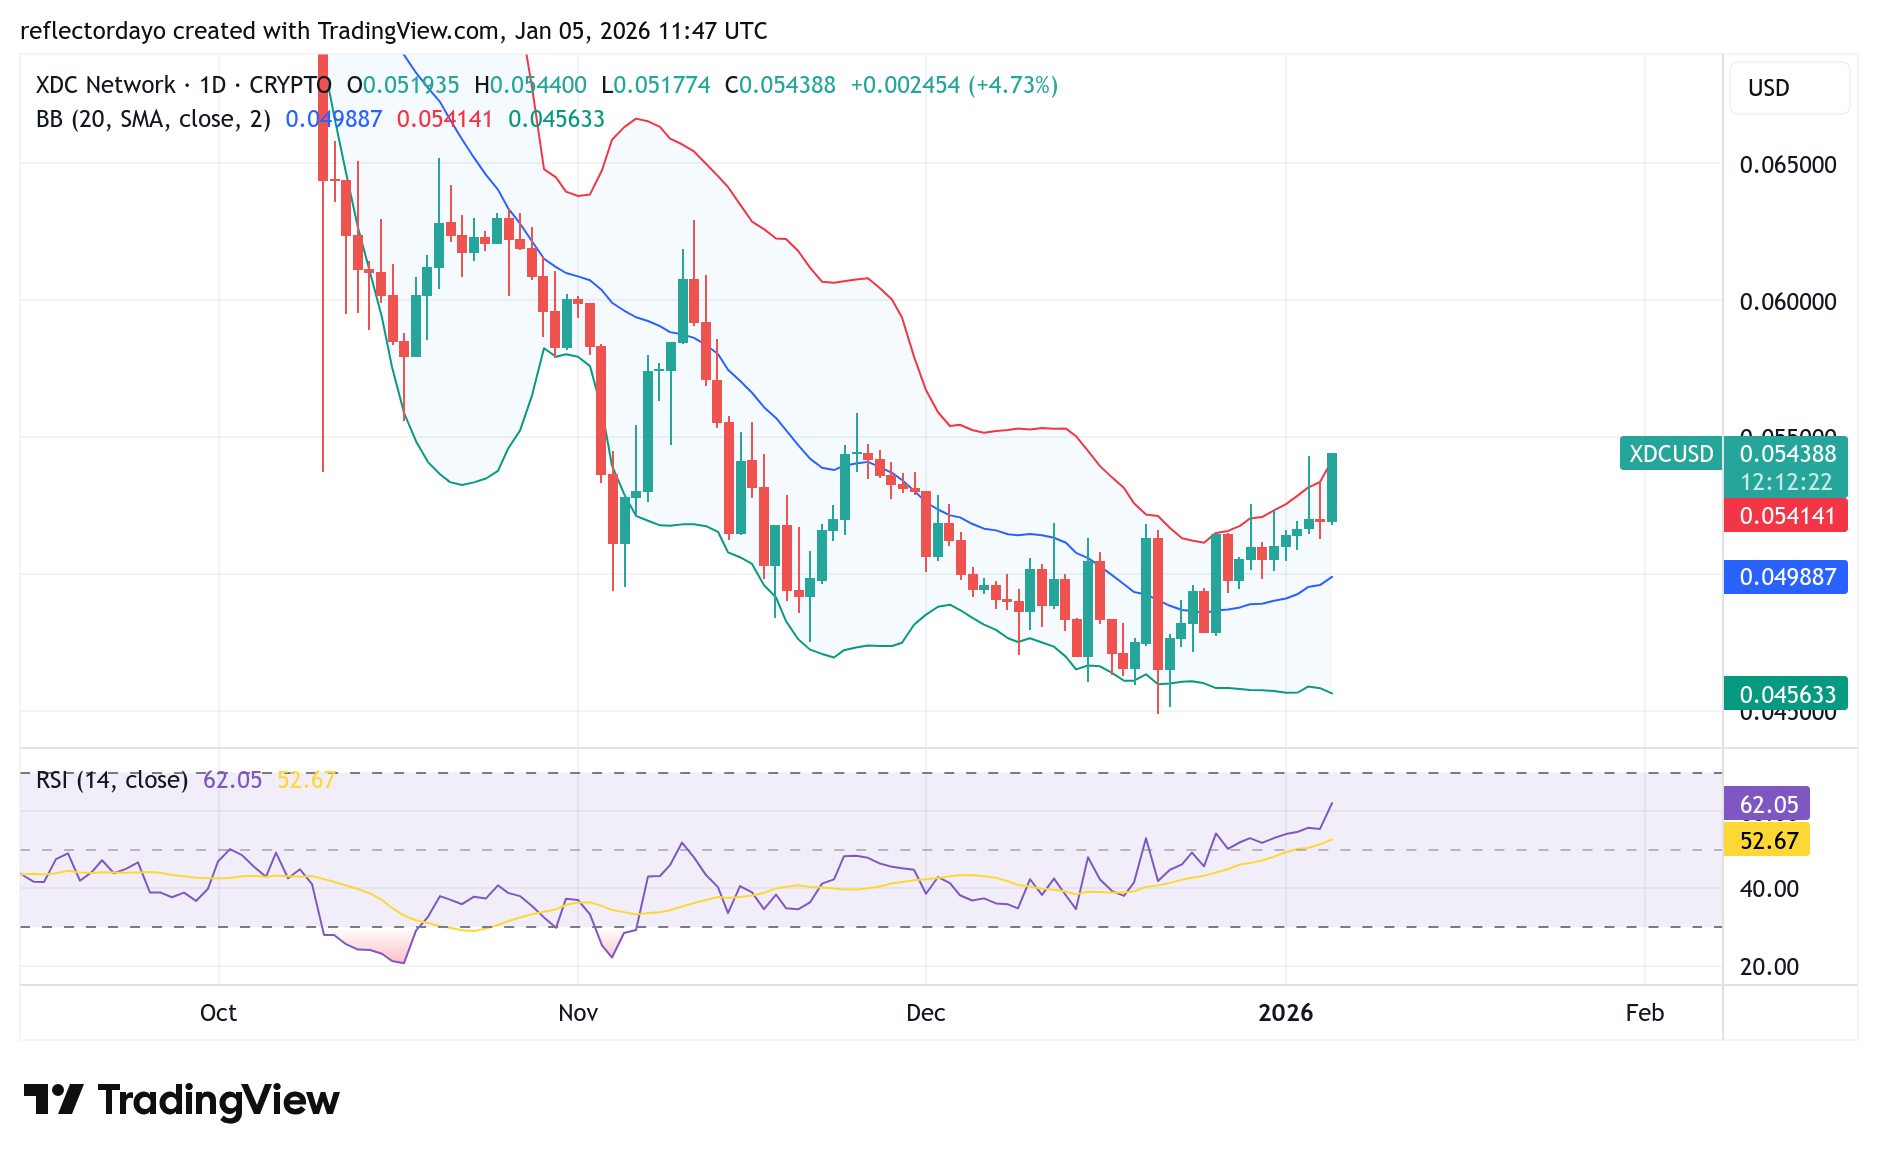
The XDC Network has been sustaining a bullish recovery after forming a pivotal support around the $0.045 price level. This rebound follows a prolonged bearish phase that began in July, when price action started declining from the $0.100 level. Currently, price has broken above the key $0.050 resistance and is now pushing toward the $0.055 region, though upside momentum appears to be temporarily capped near the $0.054 level.
XDC Network (XDC/USD) Market Data
XDC/USD Price Now: $0.0543
XDC/USD Market Capitalization: $1 billion
XDC/USD Circulating Supply: 19 billion XDC
XDC/USD Total Supply: 38 billion XDC
XDC/USD CoinMarketCap Ranking: #65
Learn how XinFin (XDC Network) supports enterprise blockchain solutions using a hybrid consensus system, and explore the real-world use cases of the XDC token.
Key Levels to Monitor
Resistance: $0.055, $0.060, $0.065
Support: $0.050, $0.045, $0.040
XDC Network Market Analysis: Technical Viewpoint
According to the indicators, the Bollinger Bands illustrate that price action has shifted to the upside after reaching a pivotal support at the $0.045 level, with price surging above the 20-day moving average. So far in today’s trading session, XDC Network bulls have maintained clear control, as reflected by the formation of a Marubozu candlestick, which signals strong buying pressure. However, despite today’s bullish dominance, the crypto market remains within a broader long-term downtrend, meaning buyers will need to deliver stronger follow-through to confirm a sustainable recovery. A decisive break above the $0.055 price level would likely attract further bullish interest.
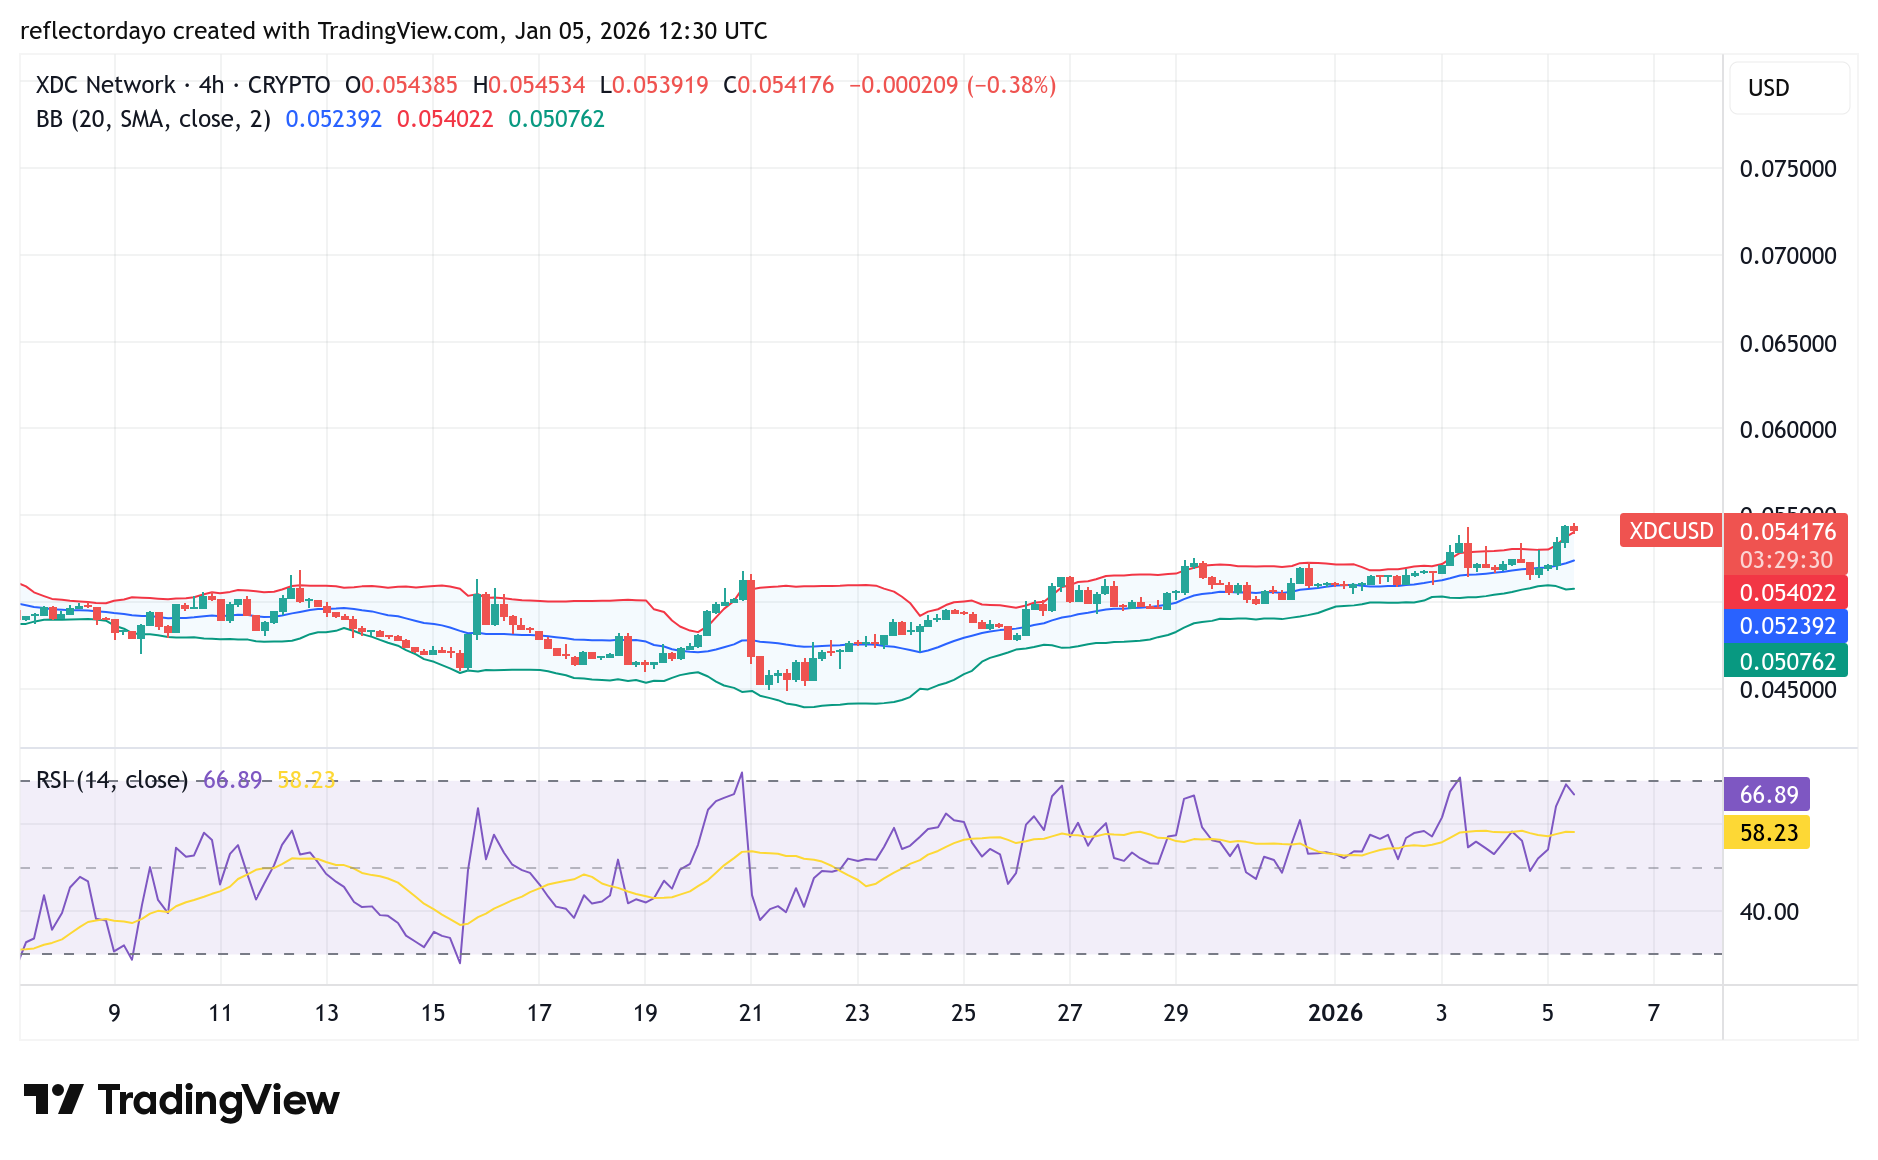
XDC/USD 4-Hour Chart Outlook
From the 4-hour chart perspective, price action is gradually gaining upward traction. While momentum remains modest, it reflects growing buying interest as traders begin to re-enter the market. The current 4-hour chart shows a Doji candlestick forming near the $0.05467 level, effectively capping the ongoing advance. A decisive breakout above this zone is critical for the continuation of the bullish recovery. Failure to clear this resistance could lead to either a period of consolidation or a renewed downside move, especially considering that bears have dominated the market for an extended period.
Broadcasting from the iconic @NYSE, @atulkhekade, Co-Founder of @XDCNetwork, joins @FintechTvGlobal to discuss the real-world convergence of TradFi and DeFi.
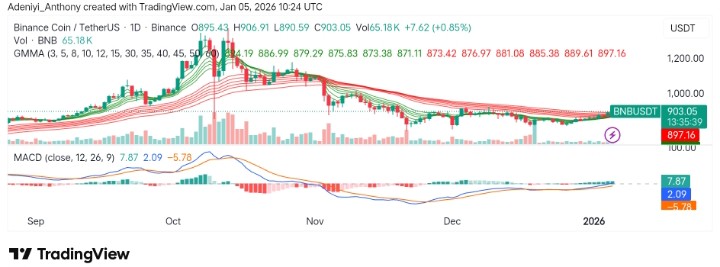
The market for BNB against Tether in the last 24 hours has experienced a 1.72% rise to $901.84, surpassing the broader 1.1% gains. As it stands, analysts are of the opinion that the surge in AI ecosystem activity, such as Non-Fungible Agents (NFAs), and growth within the broader market ecosystem are the contributing factors to the technical factors.
As it stands, the pair is technically showing signs of an impending breakout, as indicated by the convergence of the Guppy Multiple Moving Averages (GMMA) and MACD, signaling that the bulls are poised to take over momentarily.
Major Resistance Levels: $906.91, $956.00, and $1,000.00
Major Support Levels: $895.43, $850.00, and $800.00
Technical Analysis
Technically, BNB against Tether on the daily chart appears to be moving with a narrowing price range initially. As it stands, the GMMA is showing a near-bullish market sentiment as the set of EMAs seems to be fused together, signaling a potential shift in trend as the market waits for a clear breakout.
Additionally, the MACD shows a divergence with the histogram, indicating a mild bullish momentum. This is suggesting more development if more bullish efforts are applied.
To this end, the pair appears to have moved slightly above its opening price of $895.43; an improvement above $906 may indicate continued upside.
Significantly profit trade. Called on TL as before. Imo, the new resistance is yet to happen probably around 1200$. If not clear to hit 1600$ this cycle.
Meanwhile, @Crypto_king has reported that BNB/USDT has experienced significant profits compared to previous predictions on X. The analyst is of the opinion that after the current phase, the new resistance for BNB could be around $1,200 or $1,600, potentially.
BNB/USDT Analysis: Awaiting Signs of Bullish Continuation
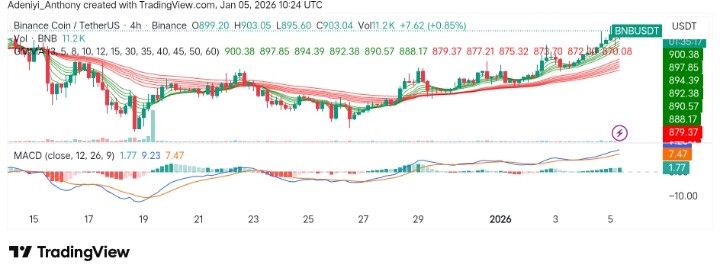
On the 4-hour chart, BNB/USDT is demonstrating a slight upside move, reaching for the $903 level. The GMMA appears to be fanning upward, showing impressive buying pressure with a noticeable bullish divergence.
However, a signal from the MACD shows that the pair is currently overbought, as potential resistance lies ahead around $906. With the volume indicator indicating increasing activities, a minor pause in movement may be seen at $906 before further continuation.
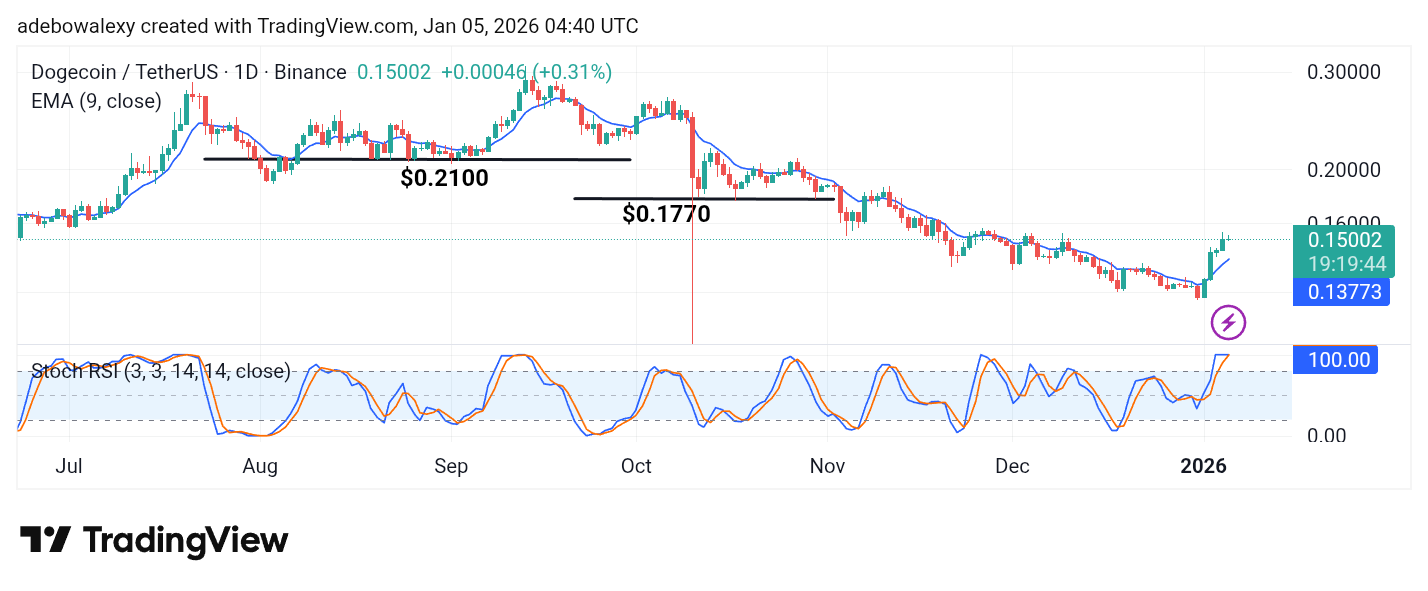
In what seems like a market-wide move, the Dogecoin market has been able to post a meaningful upside price recovery. This move appears to have spanned over five sessions, and further gains may still occur in this market.
DOGE/USDT Long-Term Trend — Bullish (Daily Chart)
Key Price Levels:
Resistance: $0.1600, $0.1700, $0.1800
Support: $0.1500, $0.1400, $0.1300
Price activity on the Dogecoin daily chart has moved past key technical landmarks, such as the 9-day Exponential Moving Average (EMA). The ongoing session remains green and continues to trade above the 9-day EMA. Meanwhile, the Stochastic Relative Strength Index (SRSI) indicator lines have reached the 100 mark and are merged at that level. Although this suggests an overbought condition, there are no clear signs yet of an imminent bearish crossover.
Dogecoin (DOGE) Price Prediction: DOGE/USDT Bulls Appear to Face Exhaustion
Although bullish forces remain dominant in the Dogecoin market, some signals suggest that upside momentum may be approaching a crossroads. The most recent price candle remains green but has a very small body.
In addition, the presence of an upper shadow indicates some downward pressure. However, the SRSI indicator lines remain in the overbought region and are still merged, with no clear indication that a bearish crossover has already occurred. Consequently, traders may want to exercise caution at this stage.
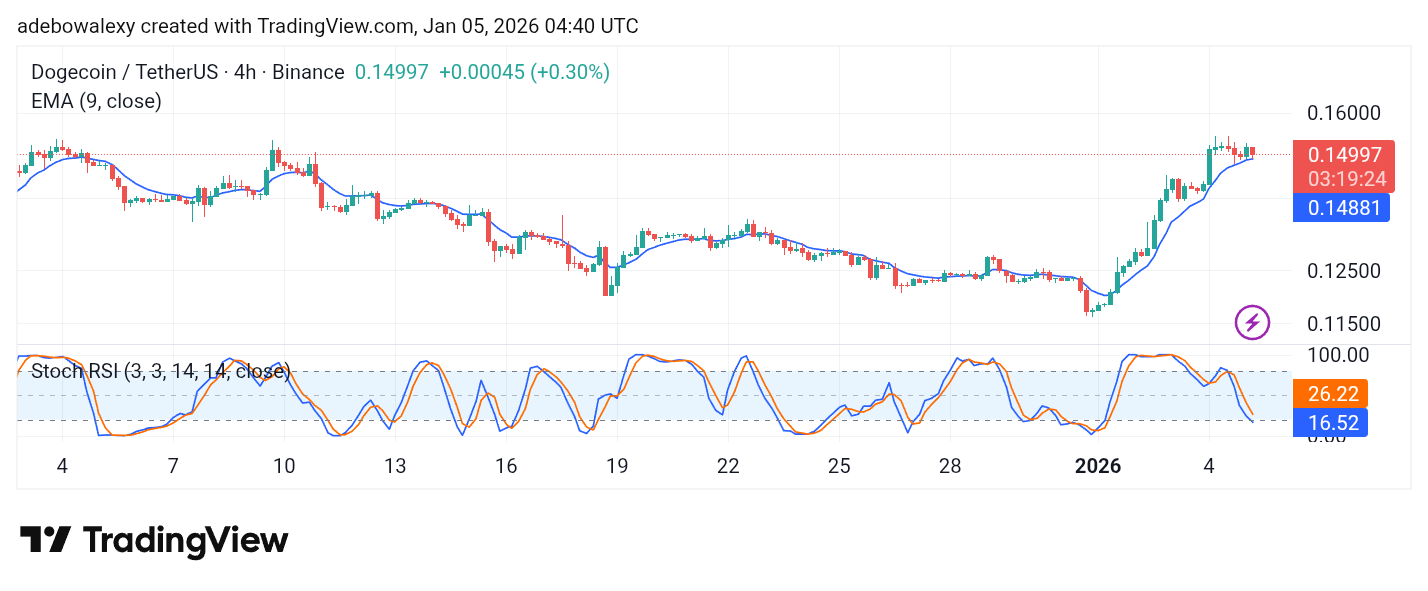
Dogecoin (DOGE) Price Prediction: DOGE/USDT Minimal Pullback Remains at Bay (4-Hour Chart)
What is observed on the daily chart is also evident on the Dogecoin 4-hour chart. The latest price candle is red and has a size that nearly erases the gains from the previous session. Nevertheless, price action continues to trade above the 9-day EMA.
Meanwhile, the SRSI indicator lines are descending toward the oversold region. However, the lines appear slightly tilted toward a potential bullish crossover. Technically, a rebound could occur off the 9-day EMA, and while traders may anticipate a brief pullback, the market could still advance toward the $0.1700 price level.
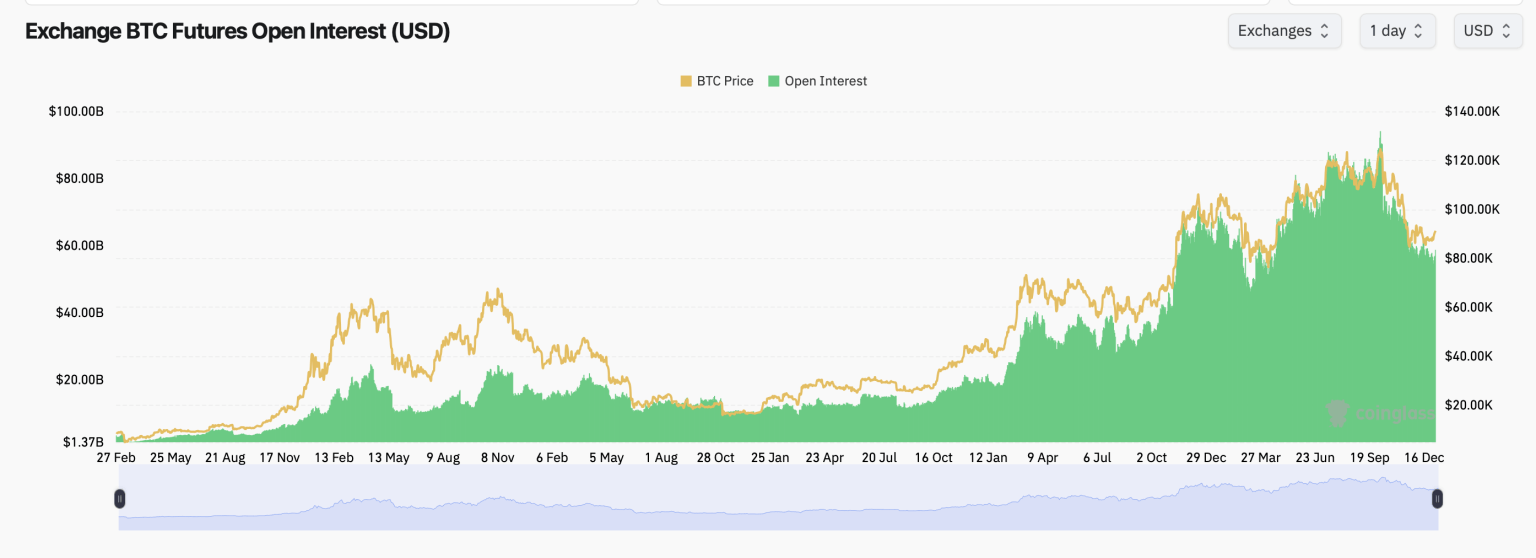
As Bitcoin’s derivatives market grows, positioning tightens ahead of significant options expirations, signaling the market’s readiness for potential volatility.
According to Coinglass, the total open interest for Bitcoin futures has risen to $58.74 billion, which is equivalent to 643,670 BTC in open contracts. Meanwhile, over the last 24 hours, this open interest increased by 3.99%, suggesting that traders are actively entering new positions rather than unwinding old ones. To this end, despite modest short-term changes, the data points to traders adding exposure cautiously, showing intentional moves in the market.
Bitcoin Futures Market Shows Growing Activity
At the time of writing, activities on the bitcoin futures market show that Binance is leading with $11.90 billion in open interest. This accounts for over 20% of the global market share. CME, the institutional heavyweight, follows with $9.80 billion. Other exchanges like Bybit and Gate have also seen notable participation, each holding more than $5 billion in open interest.,
Source: Coinglass.com
Meanwhile over the past few hours, some exchanges like CME, Binance, and OKX saw mild pullbacks, while others like Bybit and Gate saw stronger increases. This suggests shifting into alternative platforms instead of vanishing.
As it stands, data from mid-2024 shows that despite periods of price consolidation, BTC futures open interest remains high, highlighting the persistent leverage in the market.
To this end, this elevated leverage keeps the market sensitive to sharp price movements in either direction.
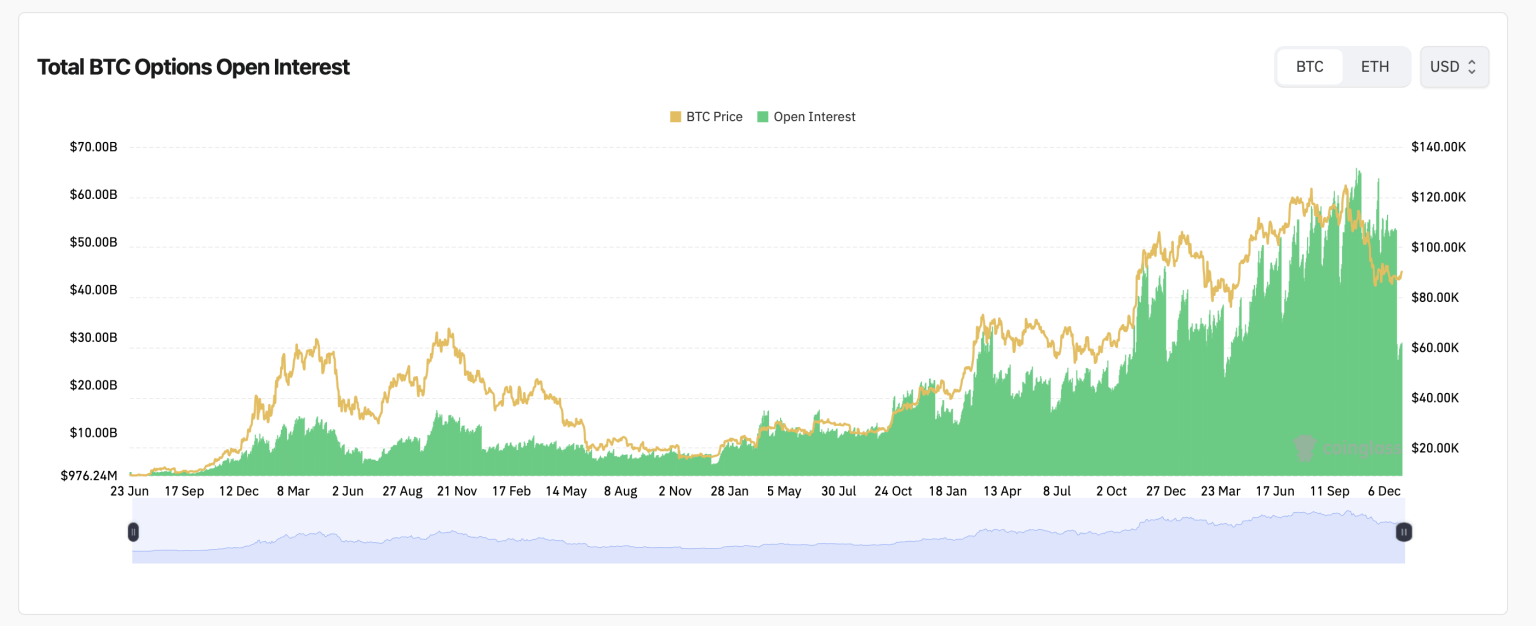
Bitcoin Options Market Leans Toward Upside
Reports from the Bitcoin options market replicate the activity in the futures market, with total open interest continuing to rise. Meanwhile, recent data has proven that calls make up 56.88% of the open interest, totaling 172,616 BTC, while puts account for 43.12%. Additionally, Deribit, the largest venue for options trading, has seen significant open interest in contracts expiring in January and March 2026, especially between the $80,000 and $110,000 price range.
Source: Coinglass.com
Itis interesting to note that the max pain levels for major options venues are clustered just below the current spot price.
Put together, the market for the BTC derivatives seems to be well-positioned. The futures traders are continuing to add exposure cautiously, and options traders are favoring the upside.
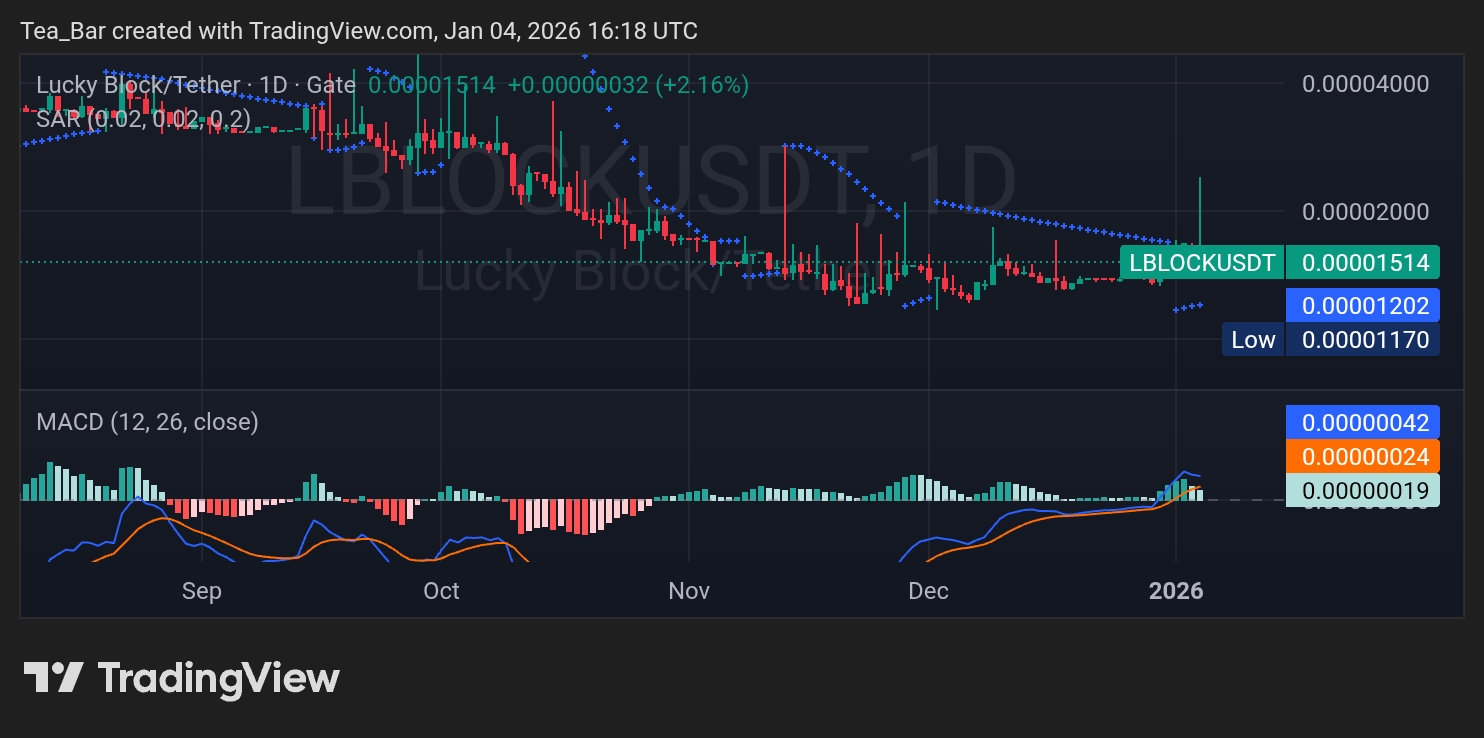
Lucky Block (LBLOCK) is beginning to show encouraging signs of renewed strength as price action stabilizes and momentum indicators turn constructive. Trading around 0.00001514, LBLOCK appears to be transitioning out of a prolonged consolidation phase and into a structure that favors gradual upside expansion. Rather than sharp speculation, the charts suggest a healthier setup where confidence is slowly returning and sellers are losing control.
Daily Chart – From Prolonged Pressure to Emerging Balance
On the daily timeframe, Lucky Block shows clear signs of recovery after months of controlled downside movement. Price has successfully held above the key base around 0.00001170, forming a higher low that now acts as a foundation for further upside. The Parabolic SAR has flipped below price, hinting at a developing trend shift and reinforcing the idea that bearish pressure has eased.
LBLOCKUSDT – Daily Chart
Momentum indicators strengthen this outlook. The MACD histogram has moved into positive territory, while the MACD and signal lines continue to curl upward. This combination often marks the early stages of sustained upside moves. If LBLOCK maintains acceptance above the 0.00001500 zone, the daily structure supports a gradual advance toward resistance near 0.00001700 and potentially higher.
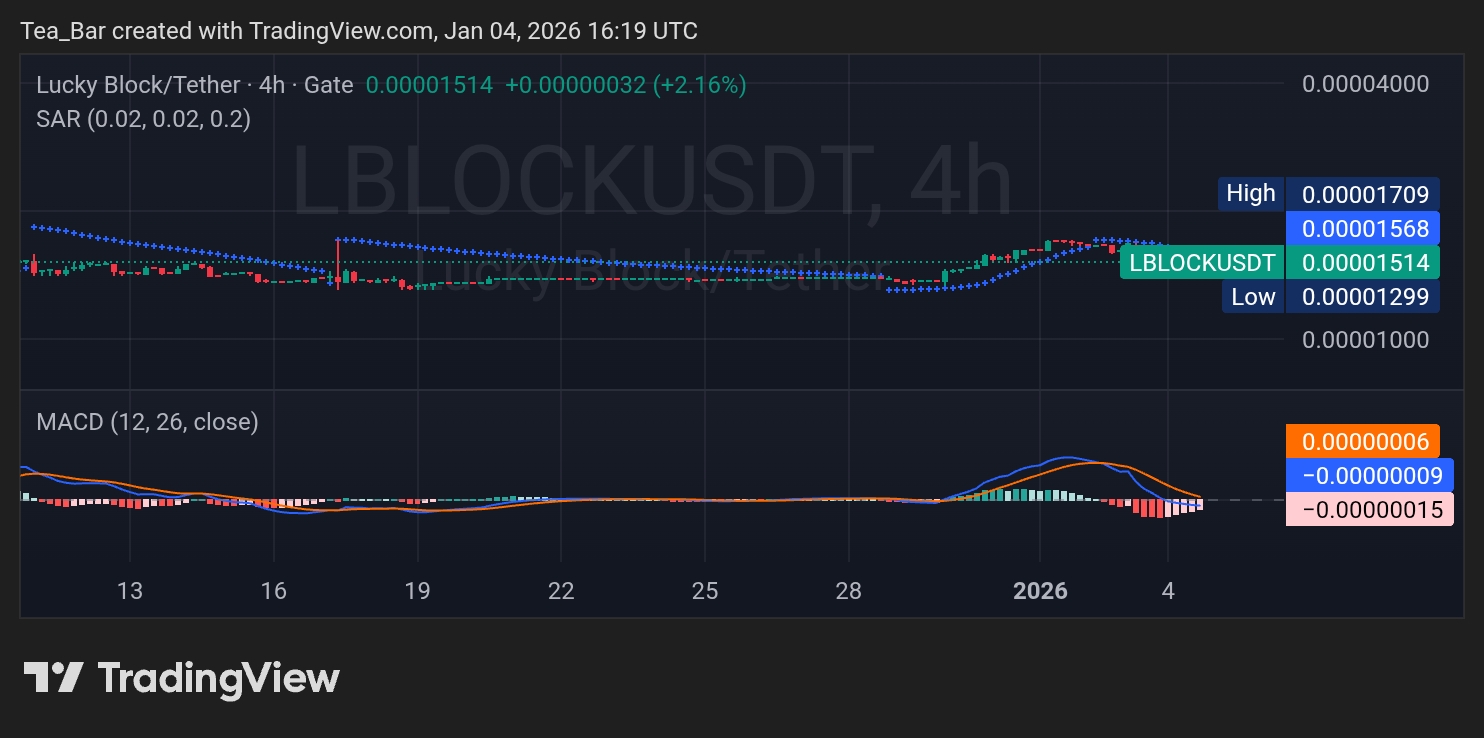
MACD momentum on the 4-hour timeframe remains constructive despite brief consolidations, suggesting strength is being built rather than lost. Holding above the 0.00001450–0.00001500 range keeps the structure intact and supports another attempt toward the recent high at 0.00001709.
Conclusion – A Foundation for the Next Move
Lucky Block is quietly laying the groundwork for its next phase. With key support defended, momentum improving across timeframes, and price holding above critical levels, LBLOCK appears well-positioned to capitalize on renewed market interest as the broader crypto landscape evolves.
Invest wisely, and let Lucky Block’s potential work in your favor. You can purchase Lucky Block here.Buy LBLOCK
These are the top five trending coins on the CoinMarketCap platform at the moment. While these assets are not necessarily experiencing strong directional price movements, they have made the top-five list due to notable price volatility over the past 24 hours. Let us now take a closer look at each of these markets, one after the other.
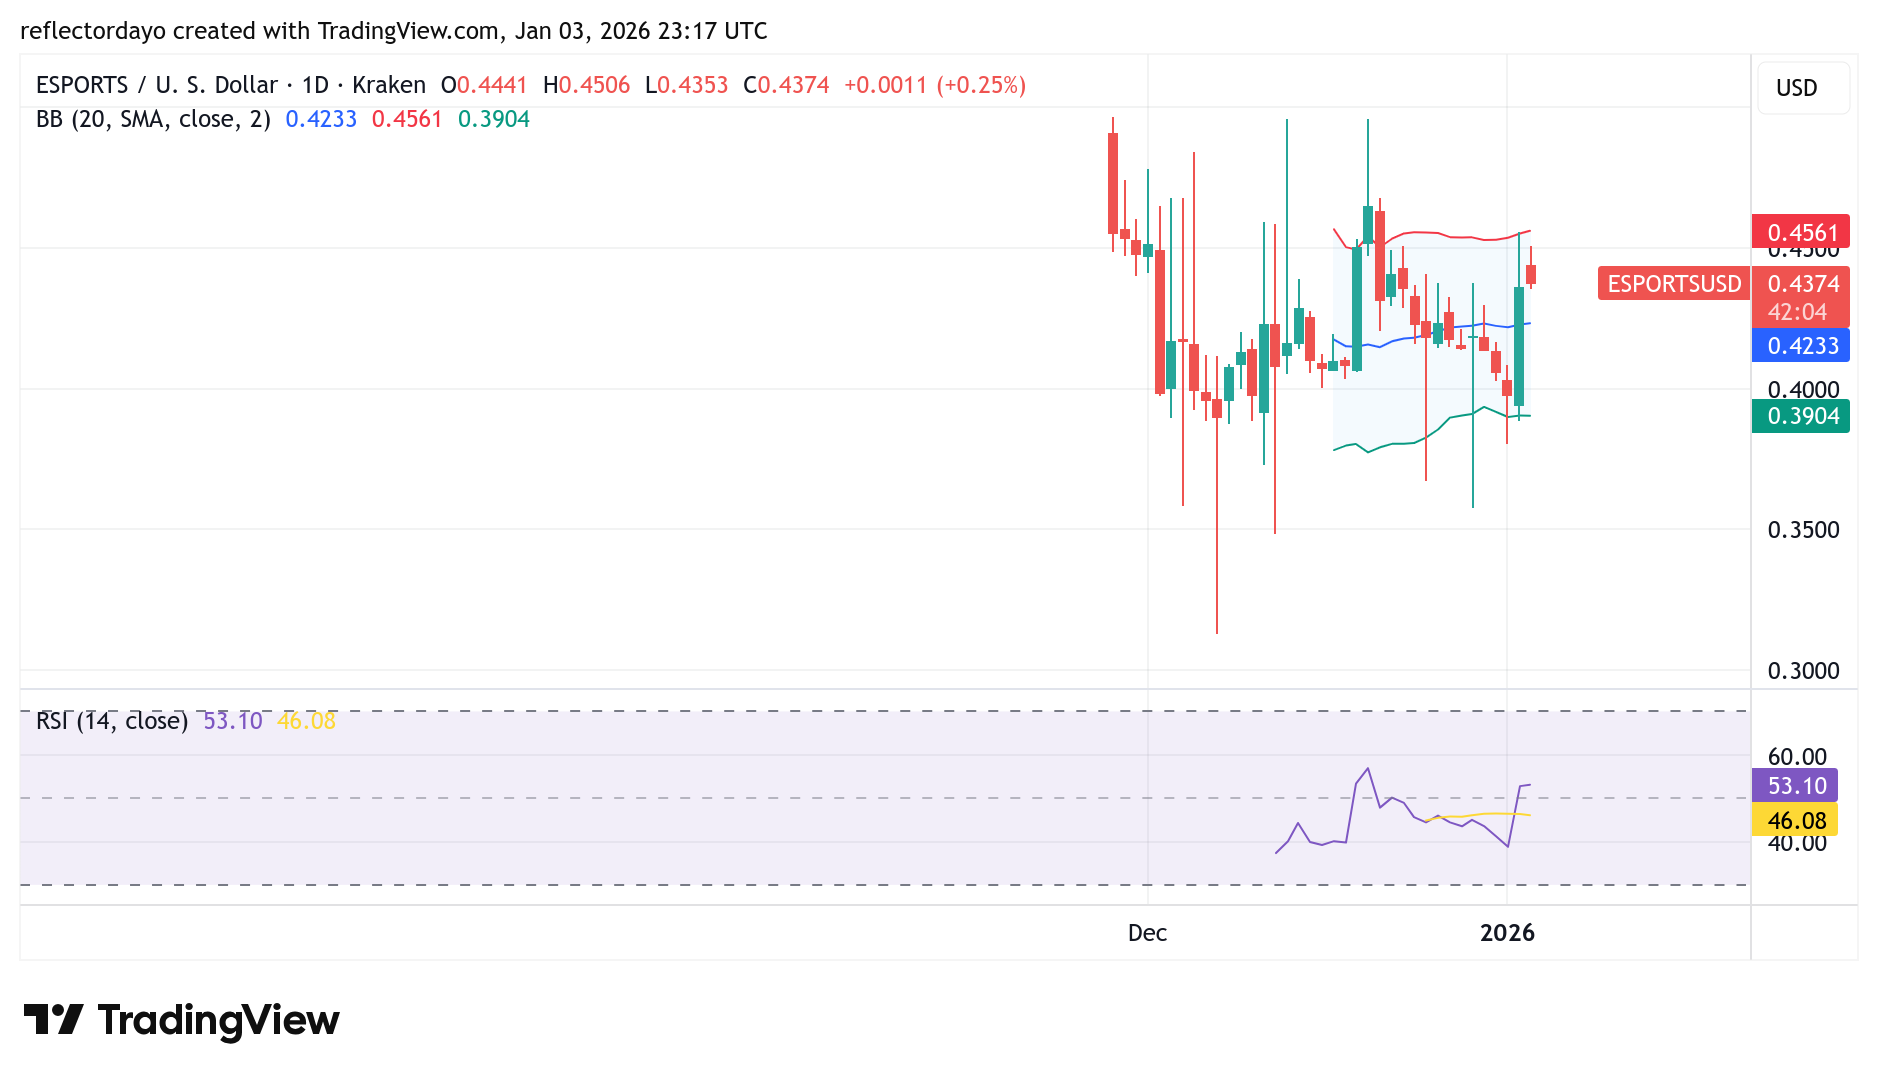
Yooldo (ESPORTS)
Major Bias: Indecision
This market has been appearing frequently on the list over the past few weeks, consistently ranking among the top five, and today it has moved into the number-one position. With limited historical data available on the chart, the asset remains relatively new. Price action was highly volatile during the early stages of its launch, and this heightened volatility has persisted to the present.
The Bollinger Bands indicator shows price fluctuating within a range of approximately $0.40 to $0.45. While this range may appear narrow, it remains technically significant. Despite the prevailing market indecision, recent price action suggests that bulls are attempting to hold ground near the $0.45 level, which represents a critical resistance. Sustained trading around this area could increase pressure on the $0.45 level and eventually lead to a breakout if buying momentum strengthens.
Current Price: $0.44
Market Capitalization: $119 million
Trading Volume: $201 million
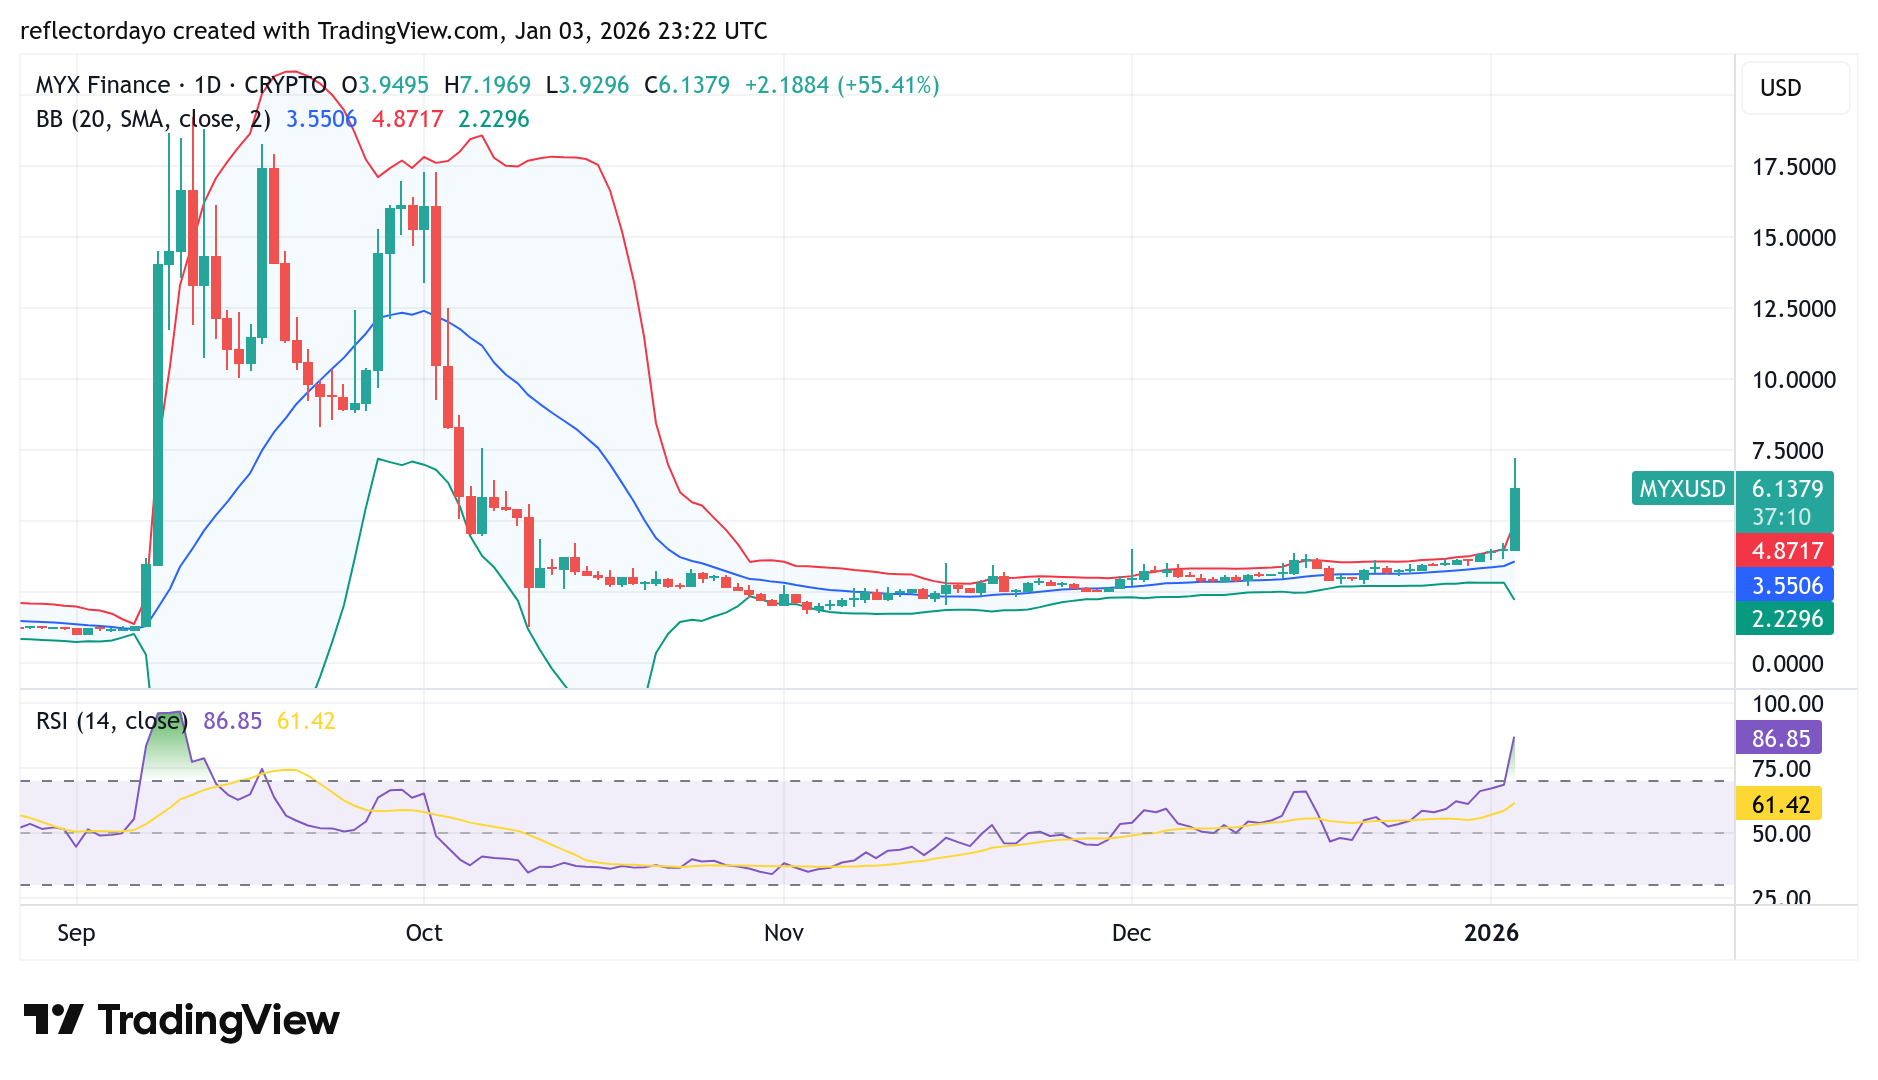
MYX Finance (MYX)
Major Bias: Bullish
This market has been oscillating between a consolidation phase and a subtle upward trend. The bullish narrative began around October of last year, and over an extended period, price managed to sustain a gradual uptrend, rising from around the $1.10 level to approximately $3.60. This same area marks today’s opening level and also served as the launch point for the recent surge toward the $7.50 price level.
At present, bulls are contending with profit-taking activity in the market. Traders should closely monitor the next higher support level for potential re-entry opportunities once price action stabilizes.
Current Price: $6.08
Market Capitalization: $1.5 billion
Trading Volume: $148 million
Sphere AI (SPHERE)
Major Bias: Bullish
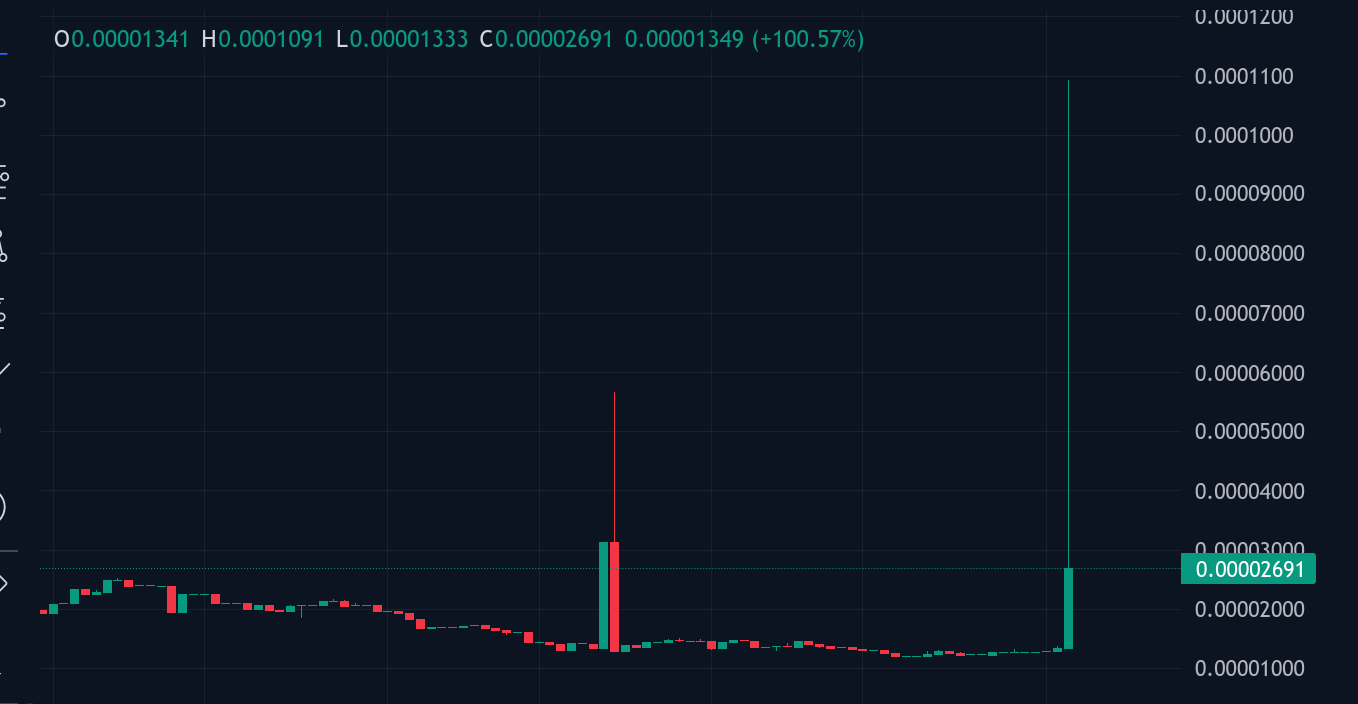
In the third position is the Sphere AI market. This asset likely secured its ranking due to a very recent spike in price action, which saw the market surge from around the $0.00001 level. The sharp rally pushed prices to a peak near $0.00011, where bears became active and profit-taking set in, triggering a corrective pullback.
Following the correction, price has now stabilized around the $0.000027 level, suggesting that bulls may be stepping in to defend this area and establish short-term support.
Current Price: $0.000027
Market Capitalization: $13,783
Trading Volume: $
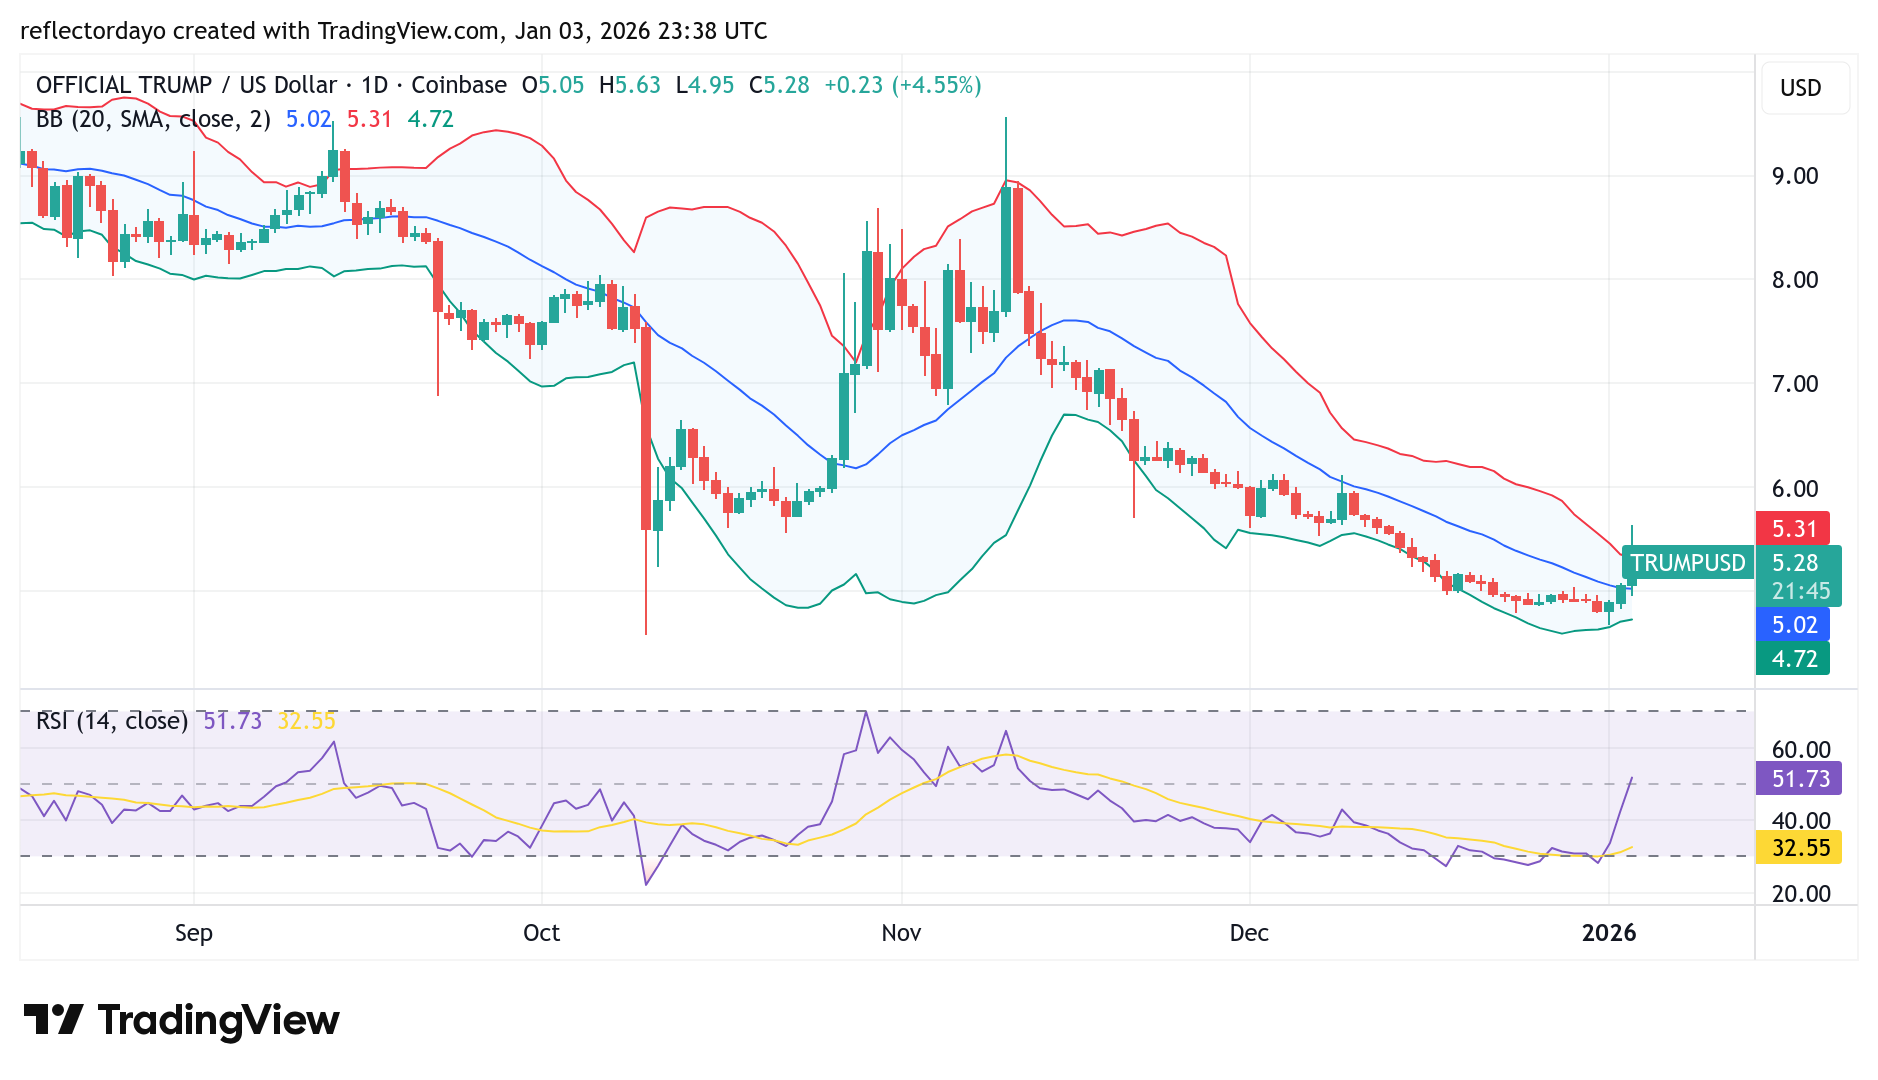
OFFICIAL TRUMP (TRUMP)
Major Bias: Indecision
This market may be preparing for another bullish cycle, as it is well known for delivering strong and aggressive price movements in previous months. A prolonged period of downward volatility drove prices lower from around the $9 level, fueled by intense selling pressure. However, as the market approached the $5 area, volatility began to cool, with bullish and bearish forces converging around this zone.
The emergence of exhaustion on the bearish side suggests that downside momentum may be weakening, increasing the likelihood of a renewed bullish phase in the crypto signal. Traders may already be stepping back into the market in anticipation of a potential rebound.
Current Price: $5.28
Market Capitalization: $1.5 billion
Trading Volume: $1 billion
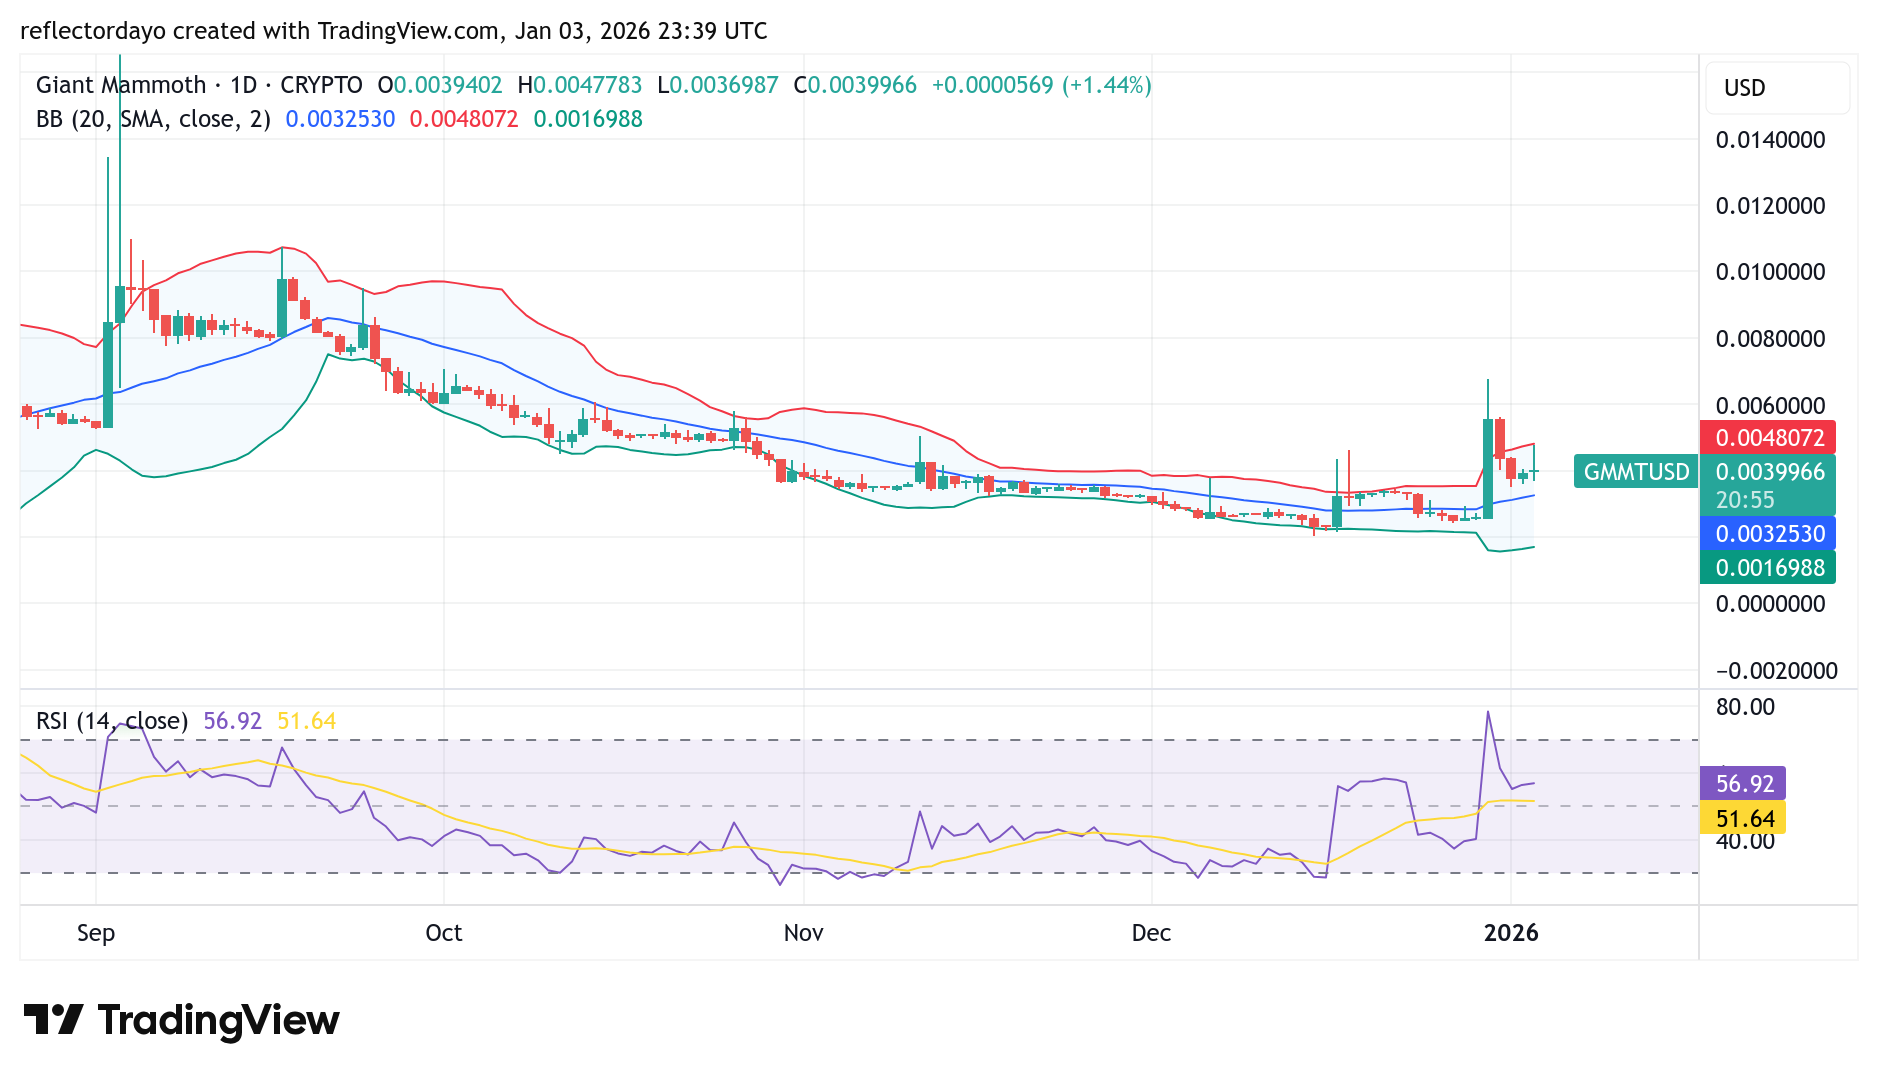
Giant Mammoth (GMMT)
Major Bias: Indecision
This market currently occupies the fifth position and is holding its ground near the $0.004 price threshold. The move into the top five trending markets was likely driven by a strong bullish burst witnessed a few days ago, on December 30, 2025. During that rally, the price surged from around the $0.0025 level and peaked near $0.007.
From that high, profit-taking activity set in, triggering a pullback toward the $0.004 area, where bulls are now attempting to preserve the broader bullish structure. The market’s behavior around this level will be crucial, as it is likely to determine the next directional move.
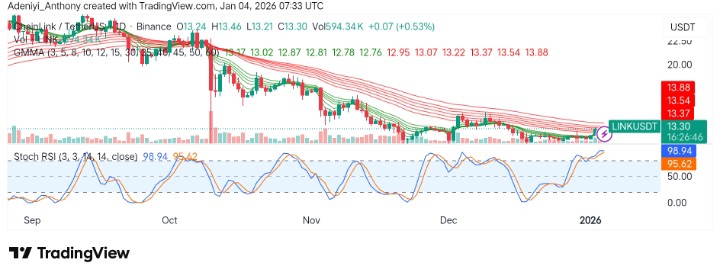
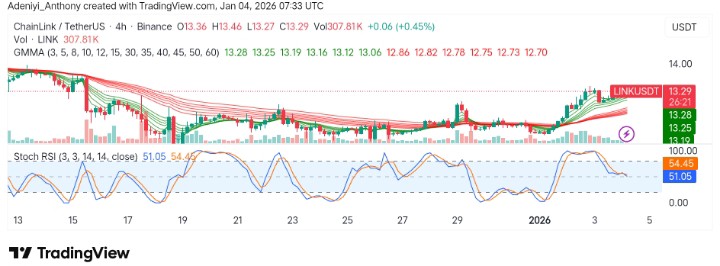
In the last 24 hours, ChainLink against Tether has seen a 1.84% rise, bringing its weekly gain to 7.73%, though the pair still remains down 5.3% for the month. Meanwhile, according to market reports, the bullish price action is largely driven by strong institutional concerns and partnerships, which have led to strong technical indicators, as evidenced by the rising Stochastic RSI.
However, despite strong positive indications, the market has also witnessed increased whale activity, with over 695,000 LINK tokens withdrawn from exchanges in just 48 hours, suggesting growing investor confidence.
Major Resistance Levels: $13.50, $13.88, and $14.30
Major Support Levels: $13.00, $12.76, and $12.00
Technical Analysis
On the daily chart, the market for ChainLink against Tether appears somewhat bullish as indicated by the impending bullish interchange of the Guppy Multiple Moving Averages (GMMA). This signals the market is gaining momentum in recent times as bullish participation increases.
Additionally, the Stochastic RSI beneath the chart signals a strong buying pressure as the blue reads 98.94. This signals that trading momentum is somewhat bullish. However, the overbought condition signals a pullback may be imminent. Therefore, without a break above $13.60-$13.88, the price may settle at the current level.
Chainlink (LINK) shows bullish momentum 🚀, trading at $13.16 with strong support at $12.80 🟢. LINK/BTC charts indicate potential short-term upside toward $16 📈. Watch for breakouts above $13.50 or retracements as buying opportunities. LINKCryptohttps://t.co/qKqNvvInSW
As it stands, @Tronweekly has pointed out the fact that Chainlink is showing bullish momentum, suggesting the token has built a solid support at $12.80. The analyst also explained that the trading pair LINK/BTC shows a potential short-term upside toward $16. To this end, traders were advised to wait for a breakout above $13.50 or use any retracements as buying opportunities to analyze the best entry point.
On the 4-hour timeframe, LINK/USDT displays a complete bullish crossover as indicated by the GMMA. As it stands, the price appears to have bounced from $12.75 support with lesser buying pressure. However, the direction of the short-period EMAs signal continued an uptrend.
From another direction, the momentum oscillator suggests the market may be stabilizing as the lines operate around the neutral zone. This suggests that if the price is not going up from this point, a possible short-term pullback towards $13.00 may be seen.
Stellar (XLMUSD) is trading around $0.210 key level, and recent price action suggests a tentative shift from outright selling to cautious base-building. After an extended downtrend, candles on both the daily and 4-hour charts are tightening around the lower Bollinger Band, indicating that sellers may be losing conviction. While this is not yet a confirmed reversal, price is beginning to stabilize instead of continuing a sharp descent.
Stellar (XLMUSD) Market Key Levels
Resistance levels: $0.210, $0.260
Support levels: $0.200, $0.360
Stellar Long-Term Trend — Bearish (Daily Chart)
The daily structure remains bearish. XLM has been carving lower highs and lower lows over months, and price continues to trade beneath the mid-Bollinger Band (20-SMA). Compared to earlier phases of the downtrend, the current bands are narrower, hinting that momentum is no longer accelerating lower.
What Is the Market Outlook for Stellar?
Stochastic on the daily is curling upward from depressed levels, which frequently appears during early basing attempts. Still, structure has not yet shifted from bearish to constructive. The overall trend remains downward until price can consistently clear and hold above key resistance zones.
If $0.20 holds as support, the market appears to be forming a base. A return toward $0.21 becomes the first reclaim objective, and a clean acceptance above that level would strengthen the short-term bias. From there, pressure could build toward $0.26 as the next meaningful upside target. Momentum indicators support a cautionary stance. Price compression and tightening bands often signal a pause rather than a reversal.
Stellar Short-Term Trend — Neutral (4-Hour Chart)
On the 4-hour timeframe, XLM has shown a shallow rebound from the lower Bollinger Band. The Stochastic is moving into the upper region often a sign of short-term recovery momentum. However, price is still residing beneath nearby resistance and has yet to build a decisive breakout.
Stellar (XLM) Market Statistics
Current Price: $0.21 Market Capitalization: $5.8 B 24H Trading Volume: $160 M