Bitcoin Cash (BCH/USD) Claims the $630 Level

Despite ongoing market volatility, Bitcoin Cash has continued to form higher lows, signaling that bulls remain in control over bears. This structure suggests sustained buying interest and underlying strength in the market. However, with volatility still elevated, the key question is whether buyers can maintain momentum and hold the price above the critical $630 level in the sessions ahead.

Bitcoin Cash (BCHUSD) Market Data

  • BCH/USD Price Now: $630.81
  • BCH/USD Market Capitalization: $16.64 billion
  • BCH/USD Circulating Supply: 19.97 million BCH
  • BCH/USD Total Supply: 19.97 million BCH
  • BCH/USD CoinMarketCap Ranking: #11

BCH is shaping a high-probability breakout pattern. This analysis maps key neckline levels and Fibonacci targets, highlighting the signals traders should watch as Bitcoin Cash prepares for its next move.

Bitcoin Cash (BCH/USD) Claims the $630 Level

Key Levels to Monitor

  • Resistance: $650, $700, $750
  • Support: $600, $550, $500

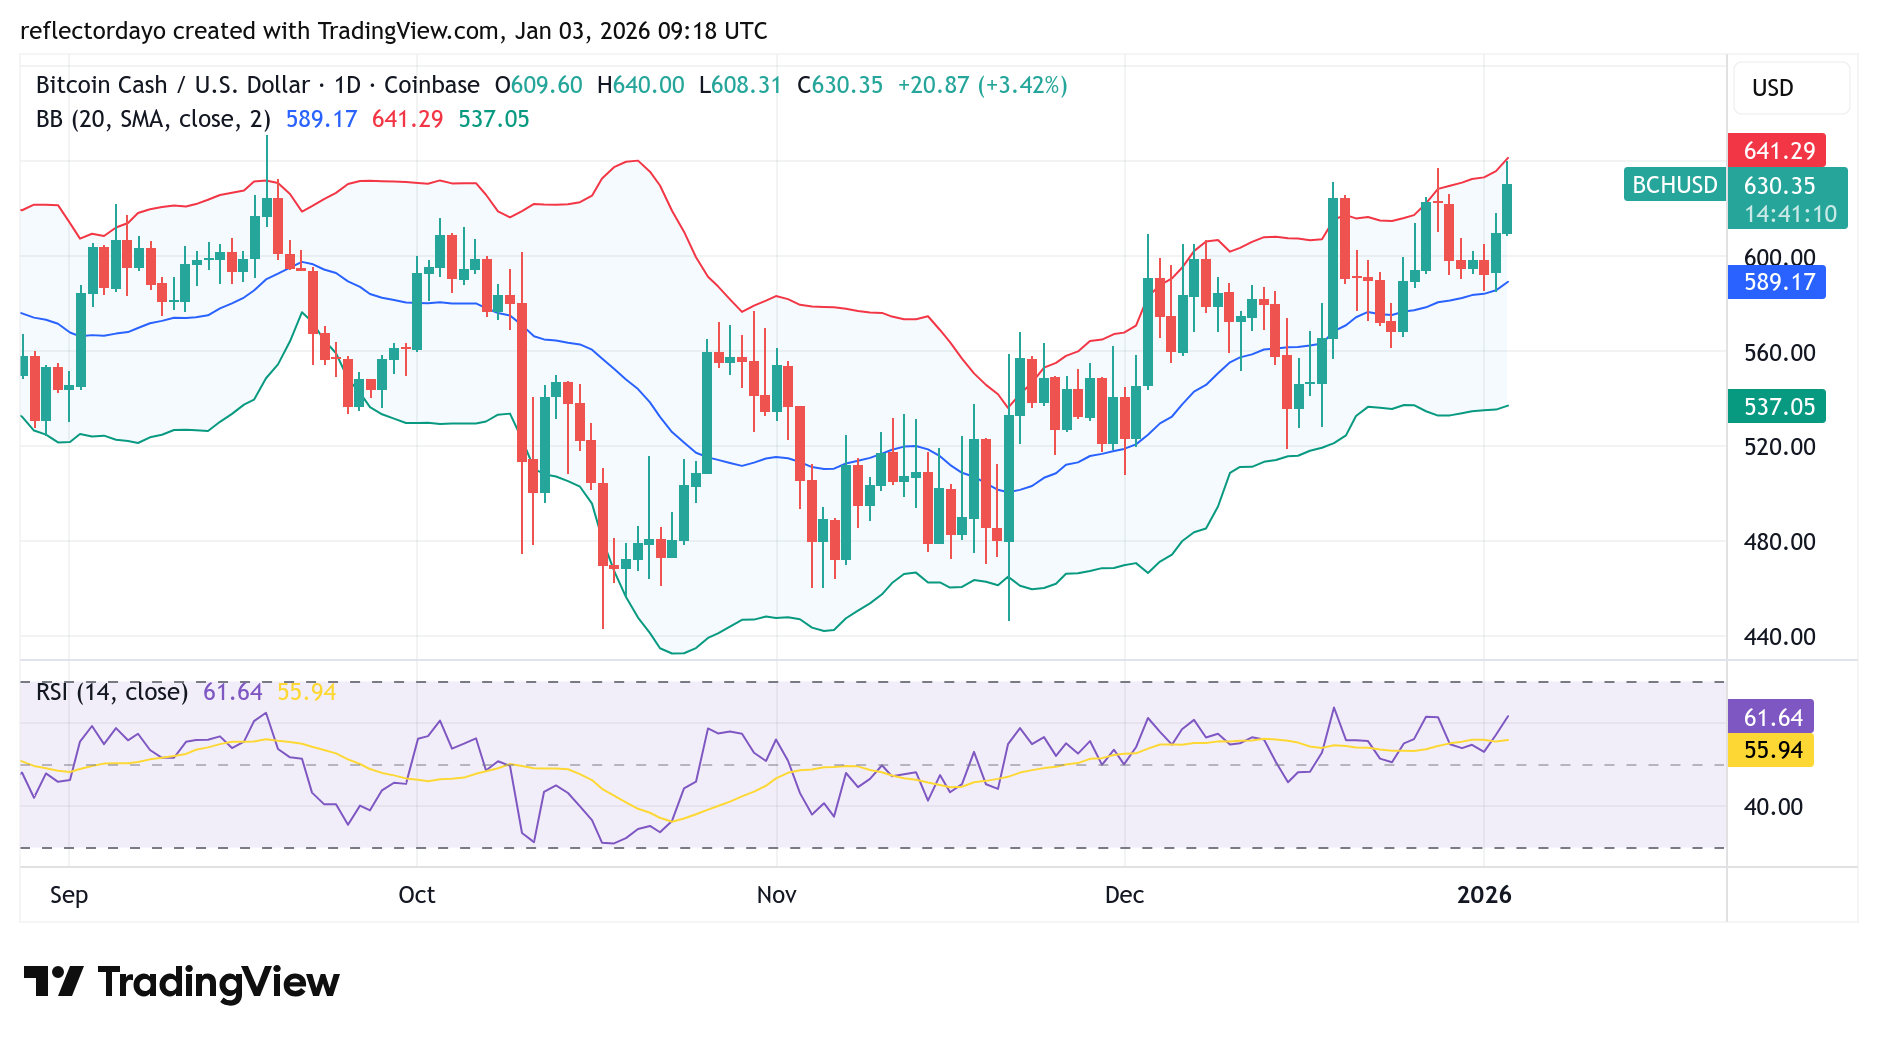
Bitcoin Cash Market Analysis: Technical Viewpoint

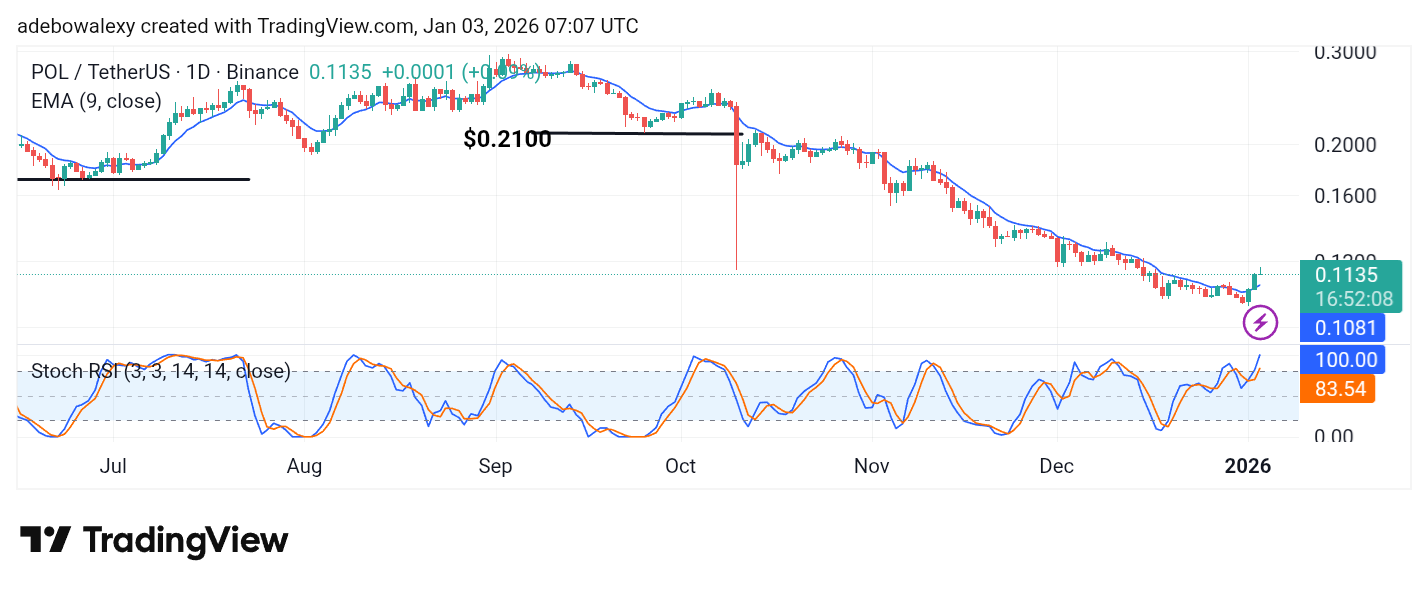
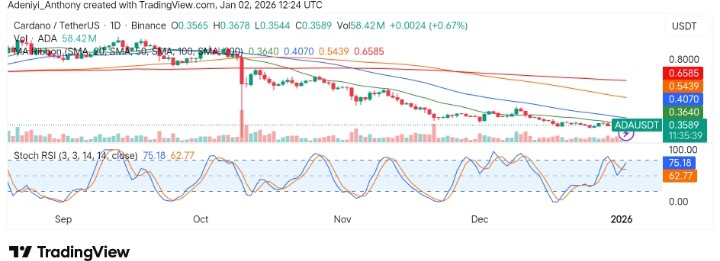
The indicator highlights two key elements: an ascending price channel and elevated market volatility, as reflected in its wide bandwidth. The formation of higher lows suggests that bullish momentum is steadily building in the crypto signal. With the most recent higher support holding firmly around the $600 level, the Bitcoin Cash market was able to challenge the next key resistance near $630. However, given the prevailing volatility, converting the $630 level into a new, reliable support may prove challenging in the near term.

Bitcoin Cash (BCH/USD) Claims the $630 Level

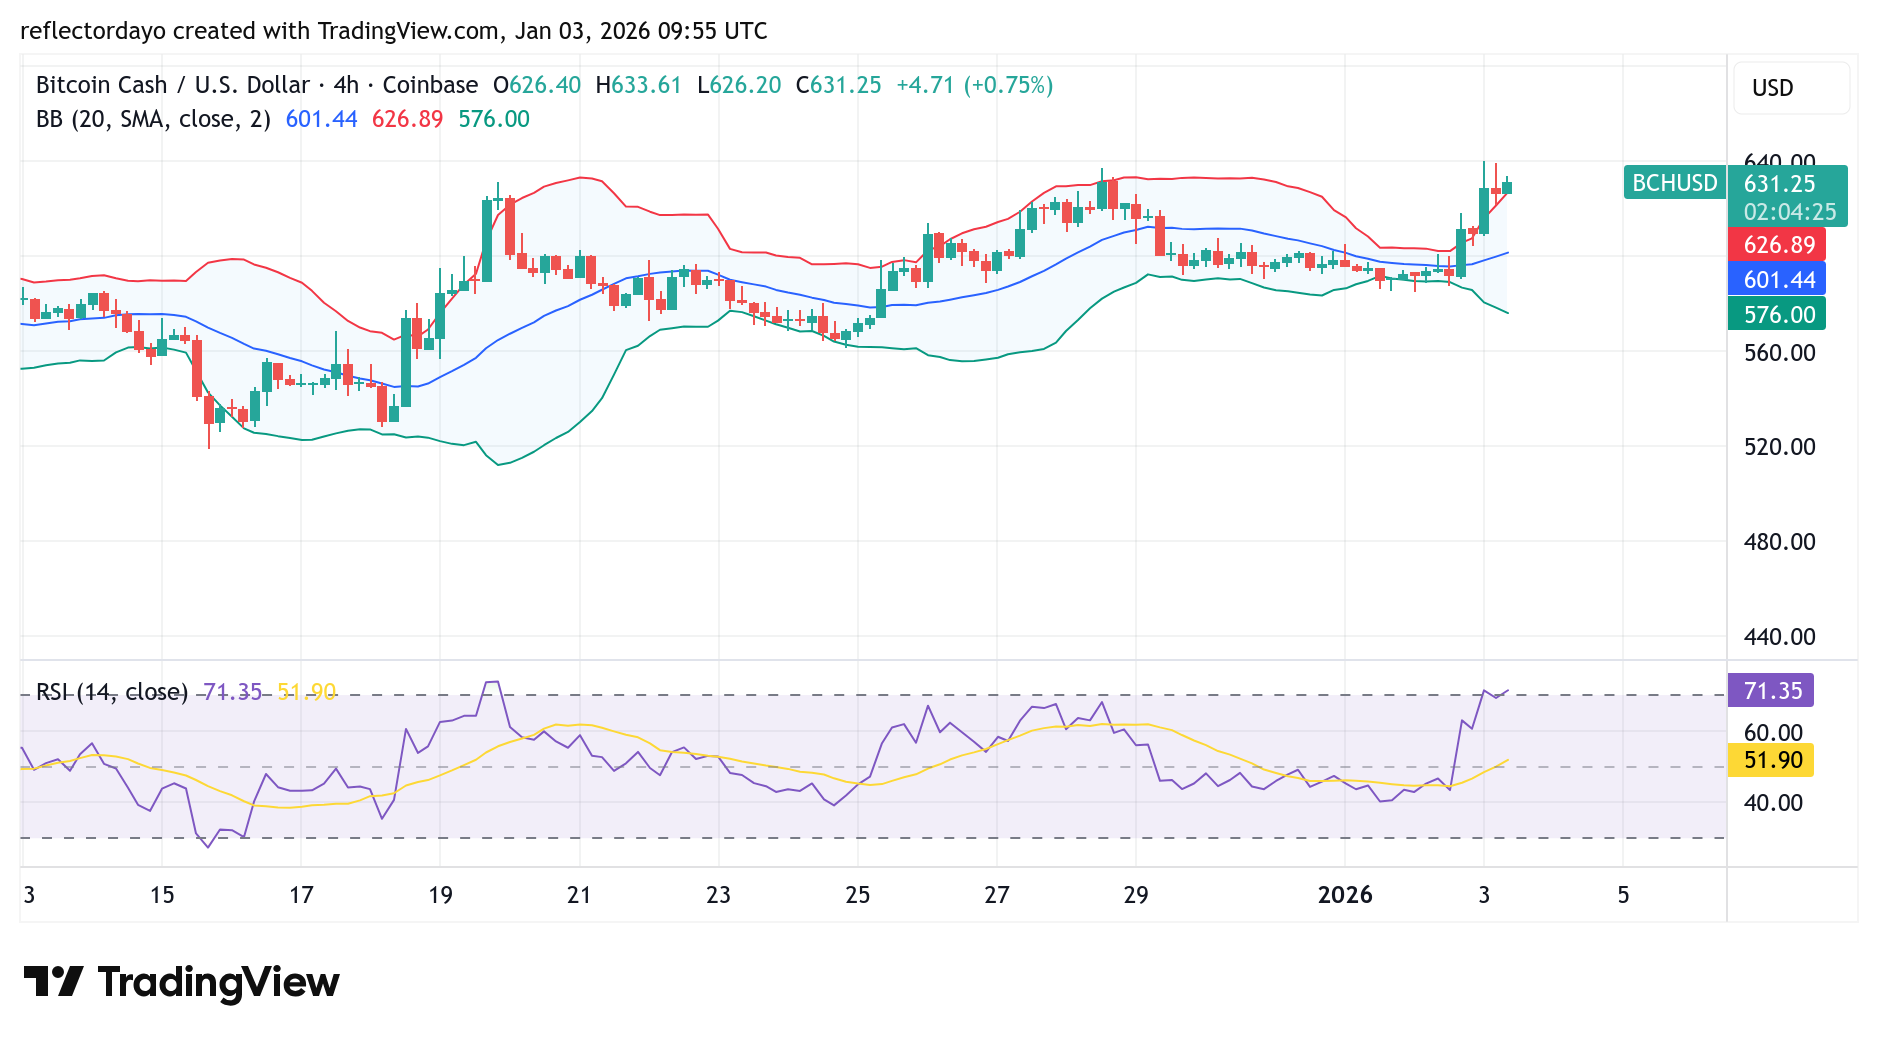
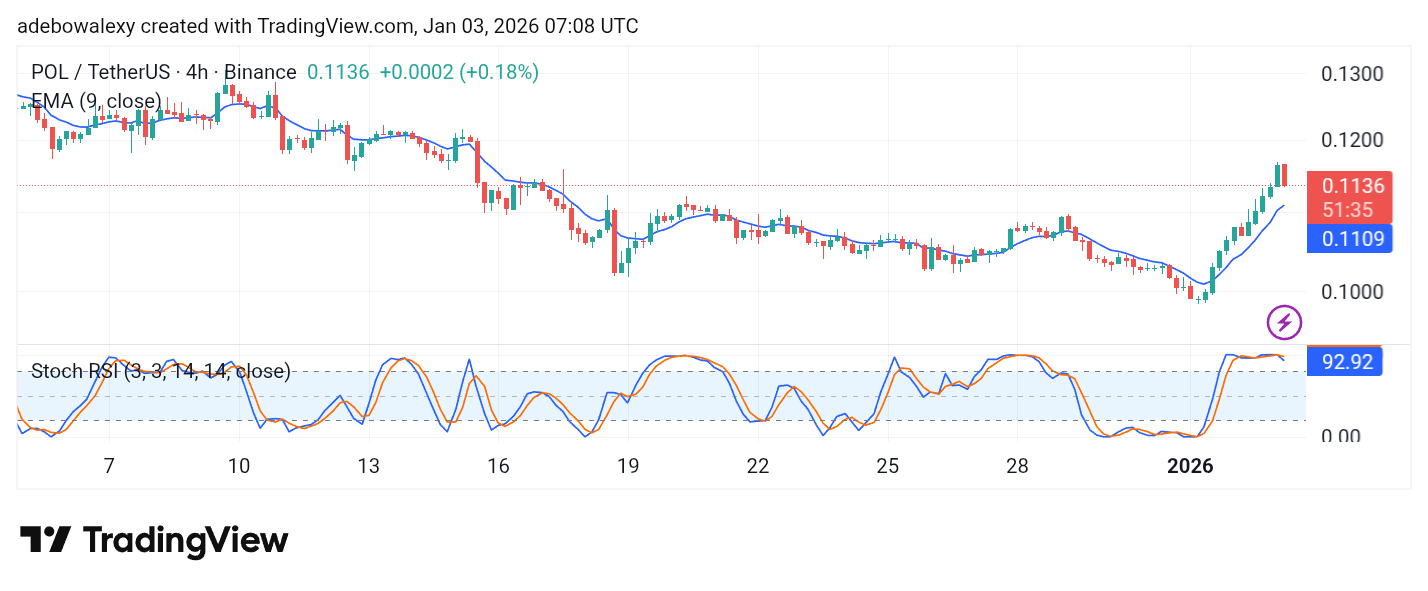
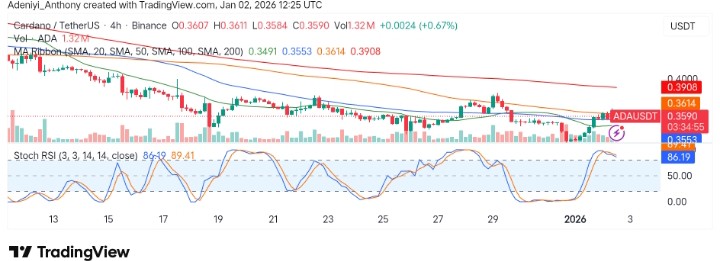
BCH/USD 4-Hour Chart Outlook

From a lower-timeframe perspective, price action is attempting to maintain stability near the $630 level. Despite the elevated volatility, bulls have shown resilience by defending the $626 area, which lies just below this critical resistance zone. With buyers firmly holding the $600 and $626 support levels, the market currently leans more toward a potential breakout rather than a breakdown.

The BCH community is locked in—driving real peer-to-peer electronic cash with low fees, fast transfers, and innovation that scales for global use.

Trade crypto coins on BYBIT

POL (Prev. MATIC) Price Prediction: POL/USDT Pokes Through the $0.1000 Baseline and Rebounds Afterwardso

Date: January 3, 2026

The POL (Prev. MATIC) market has been on a long-term downward correction. Over this period of time, the market saw a strong bearish move. However, the market took an unexpected U-turn as soon as it fell below the $0.1000 level. That trend stays largely ongoing by technical standards as of the moment.

POL/USDT Long-Term Trend—Bullish (Daily Chart)

Key Price Levels:

Resistance: $0.1250, $0.1500, $0.1750

Support: $0.1000, $0.0850, $0.0700

POL (Prev. MATIC) Price Prediction: POL/USDT Pokes Through the $0.1000 Baseline and Rebounds Afterwards

The POL (Prev. MATIC) market on the 24-hour chart stays largely bullish as of the moment. The ongoing session seems quite compressed but stays green by the wicks. Also, the mentioned price candle remains above the 9-day Exponential Moving Average (EMA) line. Likewise, the Stochastic Relative Strength Index (SRSI) indicator lines are shaped to tilt sharply upward in the overbought zone of the indicator.

POL/USDT Price Prediction: POL (Prev. MATIC) May Edge Higher (Daily Chart)

The current session has come under strong bearish pressure as of the moment. However, the POL (Prev. MATIC) market can still be considered bullish, considering its technical standpoint. The token continues trading above the 9-day EMA curve.

The Stochastic RSI indicator lines are also rising steeply upward into the overbought zone. As such, this matches the bullish consistency displayed by the last three price candles on this chart. Therefore, this market can be said to be staying largely on course toward higher ground, despite the seen rejection off the $0.1170 threshold level.

POL/USDT Price Prediction: POL (Prev. MATIC) Hits a Rejection at the $0.1170 Threshold (4-Hour Chart)

On the POL (Prev. MATIC) 4-hour price chart, one can see that a red price candle has appeared off the resistance level at $0.1170. Likewise, it has almost wiped out all the gains presented by the previous session.

POL (Prev. MATIC) Price Prediction: POL/USDT Pokes Through the $0.1000 Baseline and Rebounds Afterwards

Nevertheless, trading remains above the 9-day EMA curve. Also, the SRSI indicator lines remain above the 80 mark of the indicator.

However, the terminal part of the indicator lines seems to have a slight downward bearing due to the current appearance of the last price candle on the chart. Nevertheless, this market has the technical grounds to proceed toward the $0.1250 level for short-term gains.

Get POL (prev. MATIC) here. Buy POL  

Ending Tax Secrecy: 48 Jurisdictions Set to Share Crypto Asset Data

A global movement to improve digital asset taxation is about to begin. Forty-eight jurisdictions are taking significant steps. Meanwhile, these measures aim to share crypto-based tax information and tackle cross-border evasion under the Crypto-Asset Reporting Framework (CARF).

The Financial Times reported on January 1 that these new initiatives are part of a coordinated effort. The Organisation for Economic Co-operation and Development (OECD) leads this effort to establish clear guidelines for crypto asset reporting.

To this end, the United Kingdom has already started implementing these rules on January 1, requiring cryptocurrency exchanges to collect comprehensive data on transactions. These include customer purchases, sales, profits, and tax residency status, which will then be shared with HM Revenue & Customs (HMRC).

Global Adoption of Crypto Asset Data Sharing Standards

The OECD’s CARF is designed to foster automatic data exchanges on crypto asset transactions between participating nations by 2027.

Ending Tax Secrecy: 48 Jurisdictions Set to Share Crypto Asset Data

Meanwhile, in the first wave of the framework, 48 jurisdictions, including major countries like Germany, France, Japan, and Brazil, have pledged to exchange crypto-related data. By 2028, 27 additional jurisdictions, including Australia, Canada, and Switzerland, are expected to join. The United States plans to start sharing crypto data by 2029.

To this end, these measures were expected to make it easier for tax authorities to identify and track crypto asset investments by ensuring compliance and reducing tax evasion.

Impact on Crypto Investors and the Future of Taxation

As it stands, experts are of the opinion that these changes will have significant implications for crypto investors. Andrew Park, a tax investigations partner at Price Bailey, emphasized that this global move would mark the end of anonymous crypto trading.

Ending Tax Secrecy: 48 Jurisdictions Set to Share Crypto Asset Data

With increased transparency, investors living in countries that have signed up for the initiative will have their data shared routinely with tax authorities. Seb Maley, CEO of Qdos, also remarked that this shift will enable tax authorities to track crypto gains more effectively, especially with the expansion of transaction data.

As a result, tax advisers are warning investors to ensure they are fully compliant with tax laws, as failure to declare profits from crypto trades could trigger capital gains tax, income tax, or national insurance contributions. This major move toward transparency is set to change how cryptocurrency trading is monitored on a global scale.


In order to place winning trades with us via Bybit, you can open an account here.

Ondo Finance (ONDO/USD) Bullish Recovery Faces First Test at $0.40

After trending lower, the Ondo Finance (ONDO/USD) market recently found key support near the $0.35 level. The emergence of strong buying interest around this zone triggered a notable and decisive rebound in price action.

The recovery now faces its first major test at the $0.40 level, where traders will be watching closely to see whether bullish momentum can be sustained or if selling pressure re-emerges.

Heads up—ONDO’s largest token unlock is now scheduled, and it’s a moment the market can’t ignore. This isn’t a routine supply event; it’s a major shift that could materially alter ONDO’s circulating supply and influence price dynamics.

Ondo Finance (ONDO/USD) Market Data

  • ONDO/USD Price Now: $0.40
  • ONDO/USD Market Capitalization: $1.2 billion
  • ONDO/USD Circulating Supply: 3.16 billion
  • ONDO/USD Total Supply: 10 billion
  • ONDO/USD CoinMarketCap Ranking: #55

Ondo Finance (ONDO/USD) Bullish Recovery Faces First Test at $0.40

Key Levels to Watch

  • Resistance: 0.45, $0.50, $0.55
  • Support: $0.35, $0.30, $0.15

Ondo Finance (ONDO/USD)—Daily Chart Perspective

After Ondo Finance failed to hold the $1.00 key support level in early October, the market entered a prolonged downtrend. A brief bullish attempt emerged around the $0.50 level—an important historical price zone—but buying pressure proved insufficient to sustain a recovery.

More recently, the market found strong support near the $0.35 level, triggering a rebound toward $0.40. However, price has now encountered resistance at this level, which has remained a notable supply zone since mid-December of last year.

Market participants are closely watching price action around this area, as the outcome here is likely to determine the next directional move.

Ondo Finance (ONDO/USD) Bullish Recovery Faces First Test at $0.40

ONDO/USD—4-Hour Chart Outlook

Since mid-December of last year, bullish price attempts have been repeatedly rejected at this level, reinforcing it as a formidable resistance zone. This helps explain why the ongoing bullish recovery is currently stalling near this area.

The market is now positioned at a critical crossroads, with traders closely watching price action for a decisive outcome—either a breakout that confirms bullish continuation or a rejection that signals renewed downside pressure.

The biggest tokenization event is approaching.

Trade crypto coins on BYBIT

Cardano (ADA/USDT) Faces Strong Resistance Amid Continued Downtrend

In the last 24 hours, the market for Cardano against Tether, despite being faced with strong downward pressure in the past, has recorded a significant 6% positive move. This recovery, compared to the broader crypto market, appears to be far apart, as the latter saw a marginal gain of 1.75%.

Analysts believe Bitcoin’s stability amid reduced ETF outflows and confidence generated by the token’s large holders has triggered a crossover above the $0.35 resistance level as the formation of a falling wedge is spotted.

Currently, Cardano trades at $0.3589 with over 58 million traded volumes at the time of writing.

Cardano (ADA/USDT) Faces Strong Resistance Amid Continued Downtrend
ADAUSDT-Daily Chart

Technical Indicators

Major Resistance Levels: $0.4070, $0.5439, and $0.6585

Major Support Levels: $0.3544, $0.3500, and $0.3000

Technical Analysis

Technically, the daily chart reveals that Cardano against Tether is operating below a level where a significant recovery could be noticed. As it stands, the most noticeable resistance lies around $0.470. This suggests a potential obstacle for the price to reclaim higher levels. However, despite the recent mild uptick, the operation of the pair still lies under the moving average ribbon as the Stochastic RSI signals a near-overbought condition.

To this end, for a sustained increase to the north, the bulls must be ready to push higher into the $0.400 level by building a base above $0.3500; otherwise, the pair might end up below $0.3000.

Cardano Update

In recent times, the market for Cardano appears to have recorded a significant upside move on a nano degree chart setup. This suggests the token is launching itself straight into the next resistance. Meanwhile, at the present time, it looks like Bitcoin just reclaimed the 89k level, hoping ADA can share from the same upside story. However, much depends upon the seriousness of the bulls and their intentions to build a strong base at the current level.

ADA/USDT Analysis: Resistance Ahead: What’s Next?

On the 4-hour chart, ADA/USDT is trading just above key support levels and facing short-term resistance near the SMA 100 at $0.3614. However, the Stochastic RSI shows overbought conditions (86.19 and 89.41). Additionally, this is signaling a possible short-term reversal as the lines curl to the south.

However, the pair operation appears to be in a choppy range, and a breakout above the SMA 100 could signal a temporary rally towards higher resistance levels. Meanwhile, the price action within a larger timeframe suggests bearish dominance.

Cardano (ADA/USDT) Faces Strong Resistance Amid Continued Downtrend
ADAUSDT-4H Chart


You can purchase crypto coins here. Buy Crypto

A Delve Into Steganography

Steganography can simply be explained as an act of hiding things in plain sight. It involves secret messages hidden in some other object. This is done to make people oblivious to the presence of something. Due to this secrecy, the receiver must be aware that a message is inbound.

Examples of Steganography

The existence of steganography dates back centuries. This involves the use of invisible ink that only becomes visible after subjecting the text to special treatment.

Intelligent users of this practice have come up with an array of more complicated techniques that work in different ways. One of these techniques is a laser printer’s machine identification code (MIC). This is a unique identifier coded on any printed document. This is done by using very small yellow dots arranged in a pattern.

Lately, electronic steganography in cybersecurity has been developed. This has both criminal and legitimate applications. The various algorithms in the digital method are:

Least Significant Bit (LSB):

The LSB technique embeds hidden data by altering the least important bit of each byte in a multimedia file, such as an image or audio clip. Because these bits have minimal impact on overall quality, the changes are typically imperceptible.

Multi-Access Edge Computing (MEC):

MEC reduces bandwidth usage and enhances security by processing data closer to where it is generated, rather than transmitting it to centralized servers across the network.

A Delve Into Steganography

Discrete Fourier Transform (DFT):

With the DFT approach, secret information is embedded into multimedia content by applying discrete Fourier transformation, allowing data to be concealed within frequency components of the file.

Types of Steganography

These includes the following:

Text Steganography

Text-based steganography hides messages within written content. A basic method may use the first letter of each sentence to spell out a secret message. More advanced approaches involve intentional spelling variations, deliberate formatting choices, or the strategic use of punctuation to encode information.

Image Steganography

Image steganography involves embedding confidential data inside digital images. This works because subtle alterations in pixel color values or noise patterns are difficult for the human eye to detect. For instance, one image can be hidden within another by manipulating the least significant bits of the pixels to carry the concealed data.

Video Steganography

This is another type of image steganography. It involves encoding information within an entire video. This is possible because digital videos are sequences of images. Every frame can encode a different image, hiding a coherent video in plain sight.

Audio Steganography

Similar to video, audio steganography involves hiding information, and this is called backmasking. Here, a hidden message is played backward on an audio track. To be able to pick up the encoded message, the listener would have to play the entire track in reverse.

Network Steganography

Network steganography is an advanced data-hiding method that embeds secret information within normal network communications. This can include inserting data into TCP/IP packet headers or payloads, or encoding messages through the timing intervals between transmitted packets, making the communication appear ordinary.

A Delve Into Steganography

How Malicious Hackers Use Steganography

Like many technologies, steganography can be used for both legitimate and harmful purposes. For example, individuals living under restrictive governments may rely on it to secretly share information by embedding messages within files or traffic that appear harmless.

On the other hand, cybercriminals often exploit digital steganography to conceal malicious content. Hackers can hide malware source code inside seemingly safe files—such as images or text documents—and use a separate program to extract and execute the hidden code without raising suspicion.

In Conclusion

Steganography is an intelligent and interesting way of sending sensitive information in plain sight. The electronic variant of this can be used for both positive and negative purposes. This necessitates that cyber security professionals have a good understanding of this practice.

Developing the skills to identify and counter steganography-based attacks is a critical requirement for aspiring ethical hackers. EC-Council is a well-established leader in ethical hacking education, offering comprehensive training programs and globally recognized certifications, including the highly respected Certified Ethical Hacker (CEH). Learn more about the CEH course and certification to begin your journey toward a career in ethical hacking.

Bitcoin (BTCUSD) Trades Sideways After Sharp Correction as Market Awaits Directional Clarity

Bitcoin Price Prediction — January 1st

Bitcoin is consolidating around the $88,000 region following a sharp pullback from recent highs. This marks a clear pause in momentum rather than continued liquidation. Recent candles show shrinking ranges and increased two-way participation, suggesting the market has absorbed the selloff and is now recalibrating around a perceived fair value zone.

Bitcoin (BTCUSD) Market Key Levels

Resistance levels: $93,747.00, $100,368.00

Support levels: $83,131.00, $73,999.00

Bitcoin (BTCUSD) Trades Sideways After Sharp Correction as Market Awaits Directional Clarity


Bitcoin Long-Term Trend — Bearish (Daily Chart)

On the daily timeframe, Bitcoin has transitioned from strong expansion into a corrective phase. Price remains capped beneath key overhead resistance and continues to trade below the descending Bollinger midline, keeping the broader bias slightly bearish. However, downside momentum has clearly slowed, and the absence of large continuation candles suggests sellers are no longer in full control.


What is the market outlook of BCTUSD?

Bitcoin is currently rotating between $83,131.00 support and $93,747.00 resistance, forming a well-defined equilibrium range. As long as price remains inside this band, the market bias stays neutral, with choppy and mean-reverting behavior likely to dominate.

A sustained breakout and acceptance above $93,747.00 would indicate renewed demand and open the path toward $100,368.00. A successful reclaim of that zone would significantly improve the probability that the corrective phase is ending.

Bitcoin (BTCUSD) Trades Sideways After Sharp Correction as Market Awaits Directional Clarity


Bitcoin Short-Term Trend — Neutral (4-Hour Chart)

On the 4-hour chart, BTC continues to move sideways with compressed volatility and repeated reactions around the mid-range. Bollinger Bands have tightened considerably compared to the selloff phase, while RSI is holding near neutral territory, reflecting balanced participation from both sides.


Bitcoin (BTC) Market Statistics

Current Price: $88,070.00
Market Capitalization: $1.73T
Trading Volume (24H): $32.40B

Place winning BTC trades with us. Get BTC here

Solana (SOL) Price Prediction: SOL/USDT Weakly Bounces off the $120 Baseline

Date: January 2, 2026

The Solana market has been underperforming for quite some time. This phase began around mid-September and has largely persisted until now. However, price action has recently bounced off the $120 support level, prompting a closer look at current market conditions.

Long-Term Trend — Bullish (Daily Chart)

Key Price Levels

Resistance: $130, $140, $160

Support: $125, $120, $115

Solana (SOL) Price Prediction: SOL/USDT Weakly Bounces off the $120 Baseline

On the daily chart, price action remains above the 9-day Exponential Moving Average (EMA). The most recent price candle has also closed green. Meanwhile, the Stochastic Relative Strength Index (SRSI) lines have pushed deep into the overbought region, signaling stretched bullish momentum.

Solana (SOL) Price Prediction: Bears Still Hold the Upper Hand

Although price action has climbed above the 9-day EMA on the Solana daily chart, the upward movement appears weak. The SRSI lines are already positioned in overbought territory, suggesting limited room for further upside.

Additionally, the most recent price candle has a relatively small body, indicating fading momentum. As a result, the move above the 9-day EMA may lack sustainability, increasing the likelihood of a renewed downward move.

Solana (SOL) Price Prediction: SOL/USDT Signals a Possible Retreat Below the EMA (4-Hour Chart)

As suggested by the daily chart, the Solana market is already showing signs of renewed bearish pressure during the ongoing session.

Solana (SOL) Price Prediction: SOL/USDT Weakly Bounces off the $120 Baseline

The latest price candle on the 4-hour chart has turned red. Meanwhile, the SRSI lines continue to trend higher, with the lead line already above the 90 level.

This elevated SRSI reading appears exaggerated relative to the modest price movement observed. Consequently, bullish momentum may soon fade, increasing the probability of a pullback toward the $125 and $120 support levels.

Get Solana (SOL) here. Buy SOL 

Bitcoin’s Post-Halving Year Ends with a Loss: Is the Four-Year Cycle Over?

For the first time ever, Bitcoin’s post-halving year ended in a loss. This is breaking a trend that had lasted for over a decade. For consecutive periods Bitcoin has followed a predictable pattern after its halving events, leading to significant price gains.

Going through memory lane, the token after the halving events in 2013, 2017, and 2021 saw strong rallies. However, this pattern broke down in 2025, with Bitcoin ending December down by approximately 6% compared to its January starting price.

To this end, this marks the first time that Bitcoin has closed a post-halving year in the red.

Bitcoin’s Post-Halving Year Ends with a Loss: Is the Four-Year Cycle Over?

Experts Question the Future of Bitcoin’s Four-Year Cycle

Many in the cryptocurrency community have begun to question whether the four-year cycle is still relevant. The reduced impact of halvings is one key explanation. As it stands, Bitcoin’s total supply approaches its 21 million cap; meanwhile, the reduction in new BTC issuance from 6.25 BTC to 3.125 BTC in 2024 had a much smaller impact on supply than previous halvings. This smaller reduction in supply may have weakened the expectation of a big price surge after the halving.

In addition to the halving’s reduced effect, institutional involvement in Bitcoin has significantly changed market dynamics. The recent introduction of Bitcoin exchange-traded funds (ETFs) and the increasing institutional investment, such as Strategy, have broadened Bitcoin’s ownership base. However, this occurrence in the market has made the token more closely tied to traditional financial markets, reducing its ability to move independently while increasing its vulnerability to external factors.

Macroeconomic Factors Add to Bitcoin’s Struggles

Throughout 2025, interest rates and inflation were on the rise, and slow economic growth was also among the economic factors affecting assets like Bitcoin.

As it stands, some analysts are of the opinion that Bitcoin’s market cycles should be longer and more complex than the old four-year pattern. This is suggesting that the price movements should happen over extended periods rather than following a fixed schedule.

Put together, though 2025 stands out as an outlier in the history of the Bitcoin cycle, debate around the end of Bitcoin’s four-year cycle is still inconclusive. To this end, the debate continues as Bitcoin matures and becomes more integrated into the global financial system.


In order to place winning trades with us via Bybit, you can open an account here.