Ethereum (ETH/USDT) Records Steady Bounce Amid Broader Market Rally

The market for Ethereum against Tether in the last 24 hours has witnessed slight downward pressure, dipping by 0.14%. The pair currently operates under the cloud of bearish pressure, as the set of EMAs displays strong evidence of bearish dominance.

As it stands, the momentum oscillator suggests that upside gains are looming. However, confirmation is needed as the short-period oscillator appears to be curling upward.

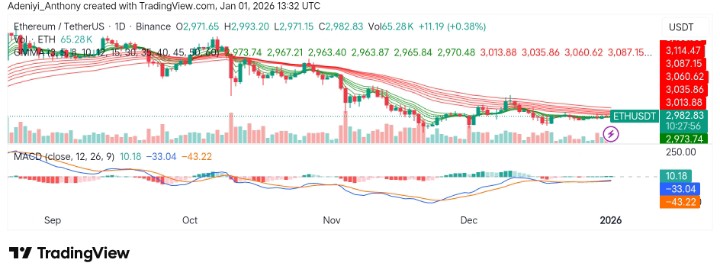
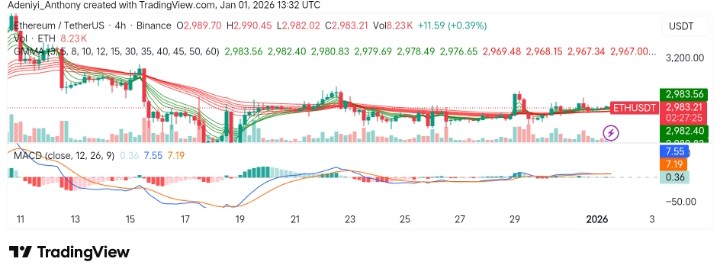
Currently, Ethereum trades at $2,982.83, recording more than 65,280 volumes for the day.

Ethereum (ETH/USDT) Records Steady Bounce Amid Broader Market Rally
ETHUSDT-Daily Chart

Technical Indicators

Major Resistance Levels: $2,993.20, $2,973.74, and $3,035.86

Major Support Levels: $2,967.21, $2,850.04, and $2,800.00

Technical Analysis

Technically, Ethereum against Tether appears to be showing a recovery after a short-term pullback. The price has bounced back from the lower support zone around $2,965. This move coincides with the red GMMA moving averages, indicating a possible trend reversal, as the MACD begins to form a larger bullish histogram.

As it stands, the current condition seems to be hinting at an impending breakout once the $2,993 is broken, as positive buying volume increases. To this end, a break above the immediate resistance would guarantee a move into the $3,000 zone; otherwise, consolidation continues.

Meanwhile, from another angle, @kay_drake has shared on Twitter that Ethereum recently achieved a new all-time high in daily on-chain transactions with a figure surpassing 2.2M in just a day. As it stands, this marks the highest level of real network usage the token has ever experienced. However, despite this surge in activity, ETH/USDT has not reached an all-time high, suggesting that the market dynamics could potentially reflect a unique phase of network growth with improvement on the way.

Ethereum Update

Ethereum on the smaller chart has reacted to micro support areas recently; this is portraying the view that the token might extend to the top slightly in the early part of 2026.

Meanwhile, from an Elliot Wave point of view, it appears that the token might be morphing into a 3- or 5-wave upside move soon. However, a move into $3,143 and $3,314 might not happen as fast as possible, as a recent upside move shows low confidence.

ETH/USDT Analysis: Is ETH Ready for Another Surge?

On the 4-hour timeframe, ETH/USDT appears to be shifting towards a consolidated pattern, operating between $2,973 and $2,989.70, but there is no clear breakout yet, as immediate resistance acts strongly.

As it stands, GMMA shows slight bullish dominance with the price stabilizing above the long-period EMAs. However, a move above $2,989.70 must be seen as the MACD shows weakened momentum.

To this end, the pair may see a slight pullback before recording a move to the north as bullish pressure appears to be fading momentarily.

Ethereum (ETH/USDT) Records Steady Bounce Amid Broader Market Rally
ETHUSDT-4H Chart


You can purchase crypto coins here. Buy Crypto

Bitcoin Cash (BCH/USD) Shows Stability as Price Holds Above Mid-Band Support

BCH/USD Price Prediction — December 31st

Bitcoin Cash is trading around the $600.00 region after a steady rebound from the November lows. Recent price action shows the market stabilizing rather than trending impulsively. This type of behavior often signals a period of market digestion, where prior moves are being evaluated before participants decide on the next leg.


BCH/USD Market Key Levels

Resistance levels: $613.00, $650.80
Support levels: $520.10, $446.60

COINBASE:BCHUSD Chart Image by Gaint-writer

BCH/USD Long-Term Trend — Bullish (Daily Chart)

On the daily chart, BCH has transitioned from a downtrend into a broader range recovery structure. Price action is holding above the mid Bollinger Band, indicating that downside momentum has eased and buyers are defending key support zones. This improvement suggests a shift from pure bearish pressure into a more balanced market context.

What is the market outlook of CMC 20 Index?

However, BCH remains beneath significant overhead supply near $613.00, which has repeatedly capped upside attempts. A clean daily close above this level would strengthen the bullish case and open room for expansion toward $650.80 and beyond.

From a broader perspective, BCH/USD is in consolidation within an emerging recovery structure. Momentum indicators are stable rather than oversold or overbought, and the reduced volatility points toward equilibrium rather than trending behavior. This setup often precedes a breakout from range conditions once key levels are contested.

COINBASE:BCHUSD Chart Image by Gaint-writer


BCH/USD Short-Term — Neutral (4-Hour Chart)

On the 4-hour chart, BCH continues to oscillate around the mid Bollinger Band. Short-term oscillators are not showing strong directional pressure, reinforcing the idea that this is a rotation period rather than a trending environment. The immediate range between $520.10 and $613.00 defines near-term behavior, and a breakout from this band will likely lead to a sharp directional move.


BCH/USD Market Statistics

Current Price: $600.00
Market Capitalization: $11 B
24H Trading Volume: $370 M

Place winning BCH trades with us. Get BCH here

AMP Market (AMP/USD) Makes a Strong Rebound

After consolidating around the $0.00168 low, the AMP market staged a notable rebound, signaling a return of buying interest at this level. The recovery began yesterday with a sharp price surge, but the rally initially stalled near the $0.00200 level, where strong resistance emerged.

Bullish momentum has extended into today’s session. Price opened again around the $0.00200 mark and continued higher, with bulls briefly pushing the market to a peak near $0.00250 before facing renewed selling pressure.

Amp (AMP/USD) Market Data

  • AMP/USD Price Now: $0.00225
  • AMP/USD Market Capitalization: $188 million
  • AMP/USD Circulating Supply: 84 billion AMP
  • AMP/USD Total Supply: 99 billion AMP
  • AMP/USD CoinMarketCap Ranking: #158

AMP Market (AMP/USD) Makes a Strong Rebound

Key Levels to Monitor

  • Resistance: $0.0025, $0.0030, $0.0035
  • Support: $0.0020, $0.0015, $0.0010

Amp Market Analysis: Technical Viewpoint

Bulls are currently attempting to hold the Amp market near the $0.00225 level. However, the recent strong bullish recovery may soon encounter notable headwinds.

Earlier, during the last bearish move, price declined toward the $0.00200 level, where initial bullish sentiment emerged and a rebound was expected. Instead, a breakdown below this level triggered renewed bearish expectations, briefly increasing market volatility. The sell-off eventually showed signs of exhaustion, and as buyers stepped in, the market began to rally sharply from around $0.00168 yesterday.

At present in the crypto signal, bulls are attempting to consolidate gains near $0.00225, with the price holding relatively firm around this level. The Bollinger Bands indicate a significantly expanded bandwidth, and current price action is trading outside the upper band—suggesting the market may be overbought. The Relative Strength Index (RSI) also supports this view, signaling overbought conditions.

AMP Market (AMP/USD) Makes a Strong Rebound

AMP/USD 4-Hour Chart Outlook

The 4-hour chart also confirms the market’s overbought condition. The RSI is pulling back from a recent high and is now consolidating near the 70 threshold, suggesting a pause rather than a complete loss of bullish momentum.

This price behavior indicates sustained buying interest, as bulls have been able to hold the market around the $0.00220 level—reinforcing the view that bullish sentiment remains strong. However, the Bollinger Bands continue to signal elevated volatility.

Given this backdrop, traders may prefer to wait for the market to demonstrate sustained stability above the $0.00225 level before committing to new long positions.

Trade crypto coins on BYBIT

Uniswap (UNI) Price Prediction: UNI/USDT Bulls Appear Overwhelmed

Date: January 1, 2026

The Uniswap market has faced strong headwinds in recent sessions, causing price action to drop sharply below key technical levels. Although the ongoing session appears relatively stable and bearish momentum has slowed, the market still looks poised for further downside.

UNI/USDT Long-Term Trend — Bearish (Daily Chart)

Key Price Levels

Resistance: $6.00, $7.00, $8.00

Support: $5.50, $5.00, $4.50

Uniswap (UNI) Price Prediction: UNI/USDT Bulls Appear Overwhelmed

Over the past three sessions, price action has followed a much steeper downward path. The most recent price candle is green but remains tightly compressed below the 9-day Exponential Moving Average (EMA). At the same time, the Stochastic Relative Strength Index (SRSI) lines are descending sharply toward the 50 level of the indicator.

Uniswap Price Prediction: Headwinds Maintain a Firm Foothold

Price activity in the Uniswap market has retraced moderately lower over the last three sessions. While the most recent price candle suggests that bearish pressure may have met temporary resistance, the SRSI indicator does not yet confirm a meaningful reversal, given the limited strength of the rejection.

As a result, UNI continues to trade below the 9-day EMA, and the SRSI lines still strongly suggest that bears are likely to remain in control.

Uniswap Price Prediction: UNI/USDT Bulls Strain to Avert Bearish Dominance (4-Hour Chart)

The 4-hour Uniswap chart shows that bullish forces remain active and are attempting to shift market momentum. The last three price candles are green, with the most recent appearing more pronounced than the previous two.

Uniswap (UNI) Price Prediction: UNI/USDT Bulls Appear Overwhelmed

However, this has largely kept price action locked within a consolidation range.

Meanwhile, the SRSI lines are positioned in the oversold region and have begun to lift slightly toward the 10 level of the indicator. Nevertheless, the market may still drift toward the $5.20 price level before any sustained recovery attempt takes shape.

Get Uniswap (UNI) here. Buy UNI

The Rise of Nation-State Bitcoin Reserves

Governments’ involvement in Bitcoin (BTC) ownership has recorded a massive growth as national reserves expand, making 2025 a year of great adoption for the coin.

As it stands, the U.S. stays in the leading position, and according to Arkham Intelligence. The nation now controls around 328,372 BTC, which is worth approximately $28.7 billion at current market prices.

To this end, it is important to note that this sudden increase in holdings came after a major seizure by U.S. authorities, adding to the country’s digital asset reserves.

Seizures and Law Enforcement Actions Driving Bitcoin Ownership

As stated earlier, one of the key reasons governments have accumulated big Bitcoin reserves was through court-ordered seizures.

As it stands, the U.K. government holds around 61,245 BTC, a figure that can be linked to the 2018 raid on a property linked to a large-scale fraud and money laundering scheme relating to two Chinese nationals, Jian Wen and Zhimin Qian, who were involved in a £5 billion crime.

El Salvador, which has made Bitcoin legal tender, also has a sizable holding of 7,509 BTC. This BTC was purchased through national treasury allocations. However, there has been some skepticism about the country’s Bitcoin acquisitions. The International Monetary Fund (IMF) has raised doubts, suggesting that many of the transactions tagged as “purchases” may actually be internal transfers rather than fresh acquisitions.

Mining Operations as a Path to Accumulation

Aside from court-ordered seizures, another major source of Bitcoin holdings for governments is mining. For instance, the UAE, through its Citadel Mining operation, holds 6,568 BTC. As it stands, Citadel Mining is largely owned by the UAE’s Royal Group, which is controlled by the ruling family of Abu Dhabi, helping the nation to rapidly rise through the ranks of countries with BTC.,

The Rise of Nation-State Bitcoin Reserves
Source: Bitcoin.com

Similarly Bhutan, ranked fifth, has also accumulated Bitcoin through its mining activities. At the time of writing, the nation has in reserve about 5,984 BTC, valued at around half a billion dollars. Though before now Bhutan once held a larger amount of Bitcoin, it has reduced its reserves in recent years. However, the government, through Druk Holdings, plans to significantly expand its Bitcoin holdings by 2035.

Put together, governments’ acquisition of Bitcoin through diverse ways is not surprising. Meanwhile, more is expected due to the role played by the coin, evolving  in every market analysis and economic policies.


In order to place winning trades with us via Bybit, you can open an account here.

Jim Rickards Sees a Powerful Run Ahead for Gold and Silver

Veteran economist and best-selling author Jim Rickards is once again making waves in the financial world—this time with bold projections for precious metals. According to Rickards, the forces driving gold and silver higher are far from exhausted, and the next major leg of the bull market could unfold as early as 2026.

In a recent interview, Rickards suggested that gold reaching $10,000 per ounce and silver climbing toward $200 is not only possible but increasingly realistic given the current macroeconomic backdrop.

Why Rickards Remains Bullish on Precious Metals

At the heart of Rickards’ outlook is a familiar but powerful combination: strong demand and constrained supply. Central banks around the world continue to accumulate gold at an aggressive pace, viewing it as a neutral reserve asset in an increasingly fragmented global financial system. Meanwhile, gold supply growth remains sluggish, with few major new discoveries coming online.

Rickards believes these traditional drivers will remain firmly in place through 2026, keeping upward pressure on prices.

New Forces Entering the Market

Beyond central banks, Rickards points to a new wave of demand coming from institutional investors, including sovereign wealth funds, pensions, and large endowments. These players, once hesitant about precious metals, are increasingly treating gold as a strategic hedge against currency risk, geopolitical instability, and long-term inflation.

Geopolitics is also playing a key role. Recent efforts by European authorities to seize or freeze Russian-linked assets have sent a clear signal to many nations: assets held within foreign jurisdictions may no longer be untouchable. As a result, countries are quietly shifting away from assets that can be seized—and turning toward gold, which carries no counterparty risk.

Jim Rickards Sees a Powerful Run Ahead for Gold and Silver

Silver’s Leverage Effect

While gold often leads the metals market, Rickards argues that silver could deliver even more dramatic percentage gains. He highlights a structural imbalance in the silver market, where paper contracts vastly outweigh the amount of physical silver available for delivery.

According to Rickards, this imbalance—often cited as being as high as 100 paper claims for every ounce of physical silver—makes the market vulnerable to sharp repricing if physical demand accelerates. In such a scenario, silver could move quickly and violently to the upside.

A Broad Metals Rally

The strength is not limited to gold and silver alone. Other industrial and precious metals, including platinum and copper, have also been benefiting from supply constraints, energy transition demand, and renewed investor interest. Together, these trends suggest a broader commodities super-cycle may still be unfolding.

Looking Ahead

Rickards’ message is clear: the metals bull market may be entering its most explosive phase. While price targets like $10,000 gold and $200 silver sound extreme, he argues they are a logical outcome of monetary debasement, geopolitical fragmentation, and structural market imbalances.

Whether or not those exact levels are reached, Rickards believes one thing is certain—precious metals are no longer a fringe hedge. They are becoming a central pillar of global financial strategy.

Trade crypto coins on BYBIT

Official Trump (TRUMP/USDT) Seeks to Settle Above Support Levels Amidst Volatility

After what seems to be a sharp dip in price earlier this year, Official Trump against Tether appears to be moving within a confined space in the last 24 hours. However, the pair seems to be recovering, facing the $5.00 resistance as the pair records a modest gain of 0.4%.

As it stands, the price is still operating below indicators like the Guppy Multiple Moving Averages (GMMA), though the Stochastic RSI signals improving momentum. However, conditions for a prolonged upside move are yet to be met.

Currently, Official Trump trades at $4.812 with more than 1.33 million volumes for the day.

Official Trump (TRUMP/USDT) Seeks to Settle Above Support Levels Amidst Volatility
TRUMPUSDT-Daily Chart

Technical Indicators

Major Resistance Levels: $4.864, $4920, and $5,033

Major Support Levels: $4.780, $4.700, and $4.620

Technical Analysis

On the daily chart, Official Trump appears to be showing a slight upward movement, with a gradual recovery from lower levels. As it stands, analysts have observed that the price has recently been bouncing off a key support zone, suggesting the possibility of a more sustained bullish move if the upward momentum continues.

To this end, the GMMA is yet to confirm a bullish breakout, but if momentum can sustain above $5.000, a move towards $6.000 is the next, as the MACD displays bullish momentum.

Official Trump’s Update

After hitting $6.80 some weeks ago, Official Trump appears to be sliding again, reaching $5.86 in recent times. Though the token was expected to improve above $5.96 or higher the following day, but the token seems to be affected by large insider sales as the broader trend shows weakness.

To this end, analysts are of the opinion that the token could see a modest recovery soon, which may be followed by a sharp downturn.

TRUMP/USDT Analysis: Operating on a Spot: What’s Next?

On the 4-hour chart, TRUMP/USDT seems to have encountered resistance around $4.900.

As it stands, the GMMA on the 4-hour chart shows a flattening of the shorter-term averages, suggesting indecision. However, the MACD shows a slight decline, and the histogram appears to be printing negative values. This indicates a potential bearish correction in the coming session.

To this end, if the price fails to break through the $4.836-$4.920 resistance, we could see a downward move toward $4.800.

Official Trump (TRUMP/USDT) Seeks to Settle Above Support Levels Amidst Volatility
TRUMPUSDT-4H Chart


You can purchase crypto coins here. Buy Crypto

Polkadot (DOT/USDT) Consolidates for Bullish Gains Amidst Market Volatility

The market for Polkadot against Tether in the last 24 hours has recorded a loss of 1.21%, falling to $1.80. This displays the height of underperformance recorded by the pair as the broader market records a marginal gain of 0.62%.

Analysts are of the opinion that the mixed ecosystem concerns and the dominance of Bitcoin over the altcoins are the major reasons for this technical breakdown.

Currently, Polkadot trades at $1.826, with more than 1.29 million traded volumes at the moment.

Polkadot (DOT/USDT) Consolidates for Bullish Gains Amidst Market Volatility
DOTUSDT-Daily Chart

Technical Indicators

Major Resistance Levels: $1.842, $1.973, and $2.020

Major Support Levels: $1.800, $1.787, and $1.700

Technical Analysis

Technically, the price action on the daily chart for Polkadot against Tether shows a potential bullish reversal as the price hovers above the $1.800 support level. However, the GMMA shows the bears are still in control, with the long-period EMAs hovering above the short-period EMAs. Meanwhile, the current consolidation setup signals that there might be a breakout to the north, but the $2.00 threshold needs to pierced from below.

On the other hand, the Stochastic RSI reads 75.13, indicating that the market’s temporary bullish condition is approaching its end, as the lines curl downward from the overbought zone.

However, for bullish moves, the resistance levels at $1.842 and $1.973 need to be broken; otherwise, the pair remains range-bound.

Polkadot’s Update

Recent analysis on Polkadot has revealed that the token is one of those coins that leaves clues and reacts to every marked level. Some weeks ago, the token appeared to be priced above $2.00, with the major resistance around $3.5, showing signs of an intending upside move. However, heavy flows around the formed neckline need to be in favor of the bulls.

As it stands, analysts are placing much importance on the neckline area, as a strong move above $2.00 would determine the strength of an uptrend or otherwise.

DOT/USDT Analysis: Stoch RSI Oversold, What’s Next?

On the 4-hour chart, the price has been consolidating around the $1.815 level with minor fluctuations. Meanwhile, the GMMA appears to be showing mixed signals, suggesting a possible divergence forming as the short-term averages start to flatten.

From another angle, the stochastic RSI reads 24.62, indicating that the market might be primed for a short-term reversal if the bulls can build momentum around the current condition, and the $1.800 continues to continue.

Polkadot (DOT/USDT) Consolidates for Bullish Gains Amidst Market Volatility
DOTUSDT-4H Chart


You can purchase crypto coins here. Buy Crypto

Bitcoin (BTC) Price Prediction: BTC/USDT Still Eyes a Breakout

Date: December 31, 2025

The Bitcoin market has remained confined below the $90,000 price level for some time. Although price action has attempted to breach this resistance, those attempts have so far failed. Let’s take a closer look at the market to identify potential short-term opportunities.

BTC/USDT Long-Term Trend — Bearish (Daily Chart)

Key Price Levels

Resistance: $90,000, $92,500, $95,000

Support: $88,000, $86,000, $85,000

Bitcoin (BTC) Price Prediction: BTC/USDT Still Eyes a Breakout

Although the Bitcoin market continues to trade below the $90,000 level, price action shows some short-term movement. The latest price candle on the daily chart is a red doji, and it stands above the 9-day Exponential Moving Average (EMA). At the same time, the Stochastic Relative Strength Index (SRSI) lines have risen into the region above the 80 threshold. The terminal part of the SRSI continues to edge slightly toward the 100 level of the indicator.

Bitcoin Price Prediction: BTC/USDT Market Eyes the $90K Mark

The Bitcoin market has been trending largely sideways in recent sessions. However, the $90,000 price level appears to be a more logical target at this point. In line with this, the SRSI lines can still be seen moving slightly higher above the 80 level.

The most recent price candle also stands just above the 9-day EMA curve, although it appears to be under notable pressure. Nonetheless, upside momentum still has a chance to prevail.

Bitcoin Price Prediction: BTC/USDT Shows Positive Consistency (4-Hour Chart)

On the Bitcoin 4-hour chart, price action has remained above the 9-day Exponential Moving Average (EMA). Unlike the red candle on the daily chart, the most recent candle here is green.

Bitcoin (BTC) Price Prediction: BTC/USDT Still Eyes a Breakout

Although it shares a similar structure with the previous red candle, its position above the 9-day EMA suggests a degree of bullish sentiment. Meanwhile, the SRSI lines are below the 50 threshold but are still angled slightly upward toward it. Consequently, the market appears poised to make a push toward the $90,000 price level, as previously noted.

Get Bitcoin (BTC) here. Buy BTC