Sui (SUIUSDT) Market Signals Rising Compression as Price Pauses Near Key Equilibrium

SUIUSDT Price Prediction — December 30th

SUIUSDT is stabilizing around the $1.40 region after a prolonged selloff, and price action is beginning to slow rather than extend lower. Both the daily and 4-hour charts show a market that has already repriced aggressively and is now transitioning into a quieter phase. Candles are tightening near the lower range, suggesting that selling pressure is being absorbed.


SUIUSDT Market Key Levels

Resistance levels: $1.80, $3.10
Support levels: $1.27, $0.58

Sui (SUIUSDT) Market Signals Rising Compression as Price Pauses Near Key Equilibrium


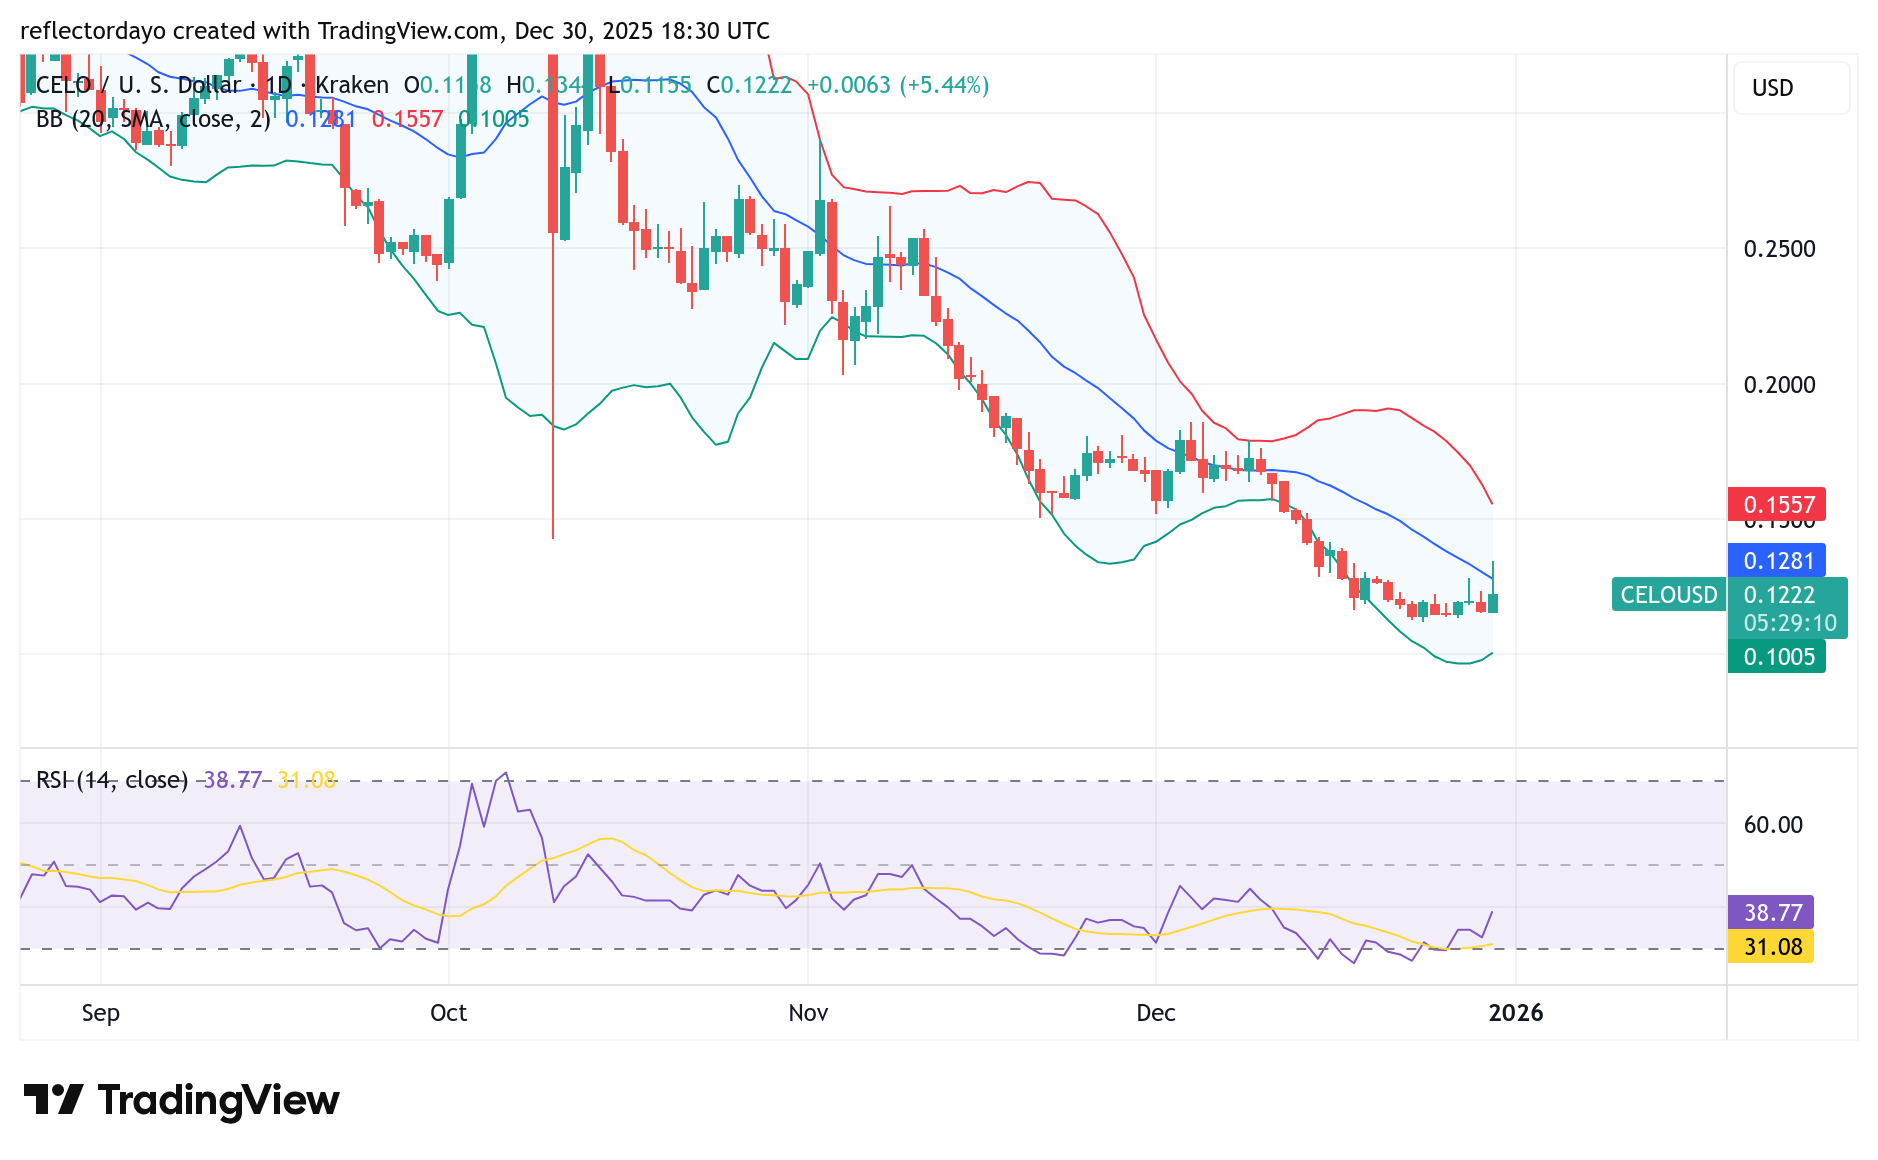
SUIUSDT Long-Term Trend — Bearish (Daily Chart)

On the daily chart, SUI remains structurally weak, trading well below prior distribution and supply zones. The broader trend is still bearish, defined by lower highs and extended downside from earlier cycle peaks. However, the pace of decline has clearly slowed.

What is the market outlook of SUIUSDT?

Bollinger Bands are no longer expanding aggressively, and price is attempting to stabilize above the lower support region around $1.27. This shift suggests the market has moved from active selling into a digestion phase. While this does not confirm a trend reversal, it does reduce the probability of immediate continuation lower.

From a broader perspective, SUIUSDT is in a decision zone. Momentum indicators such as MACD are flattening, and price is spending more time rotating around equilibrium rather than breaking down impulsively. This behavior often precedes volatility expansion and is closely watched by traders tracking early crypto signals for trend shifts.

Sui (SUIUSDT) Market Signals Rising Compression as Price Pauses Near Key Equilibrium


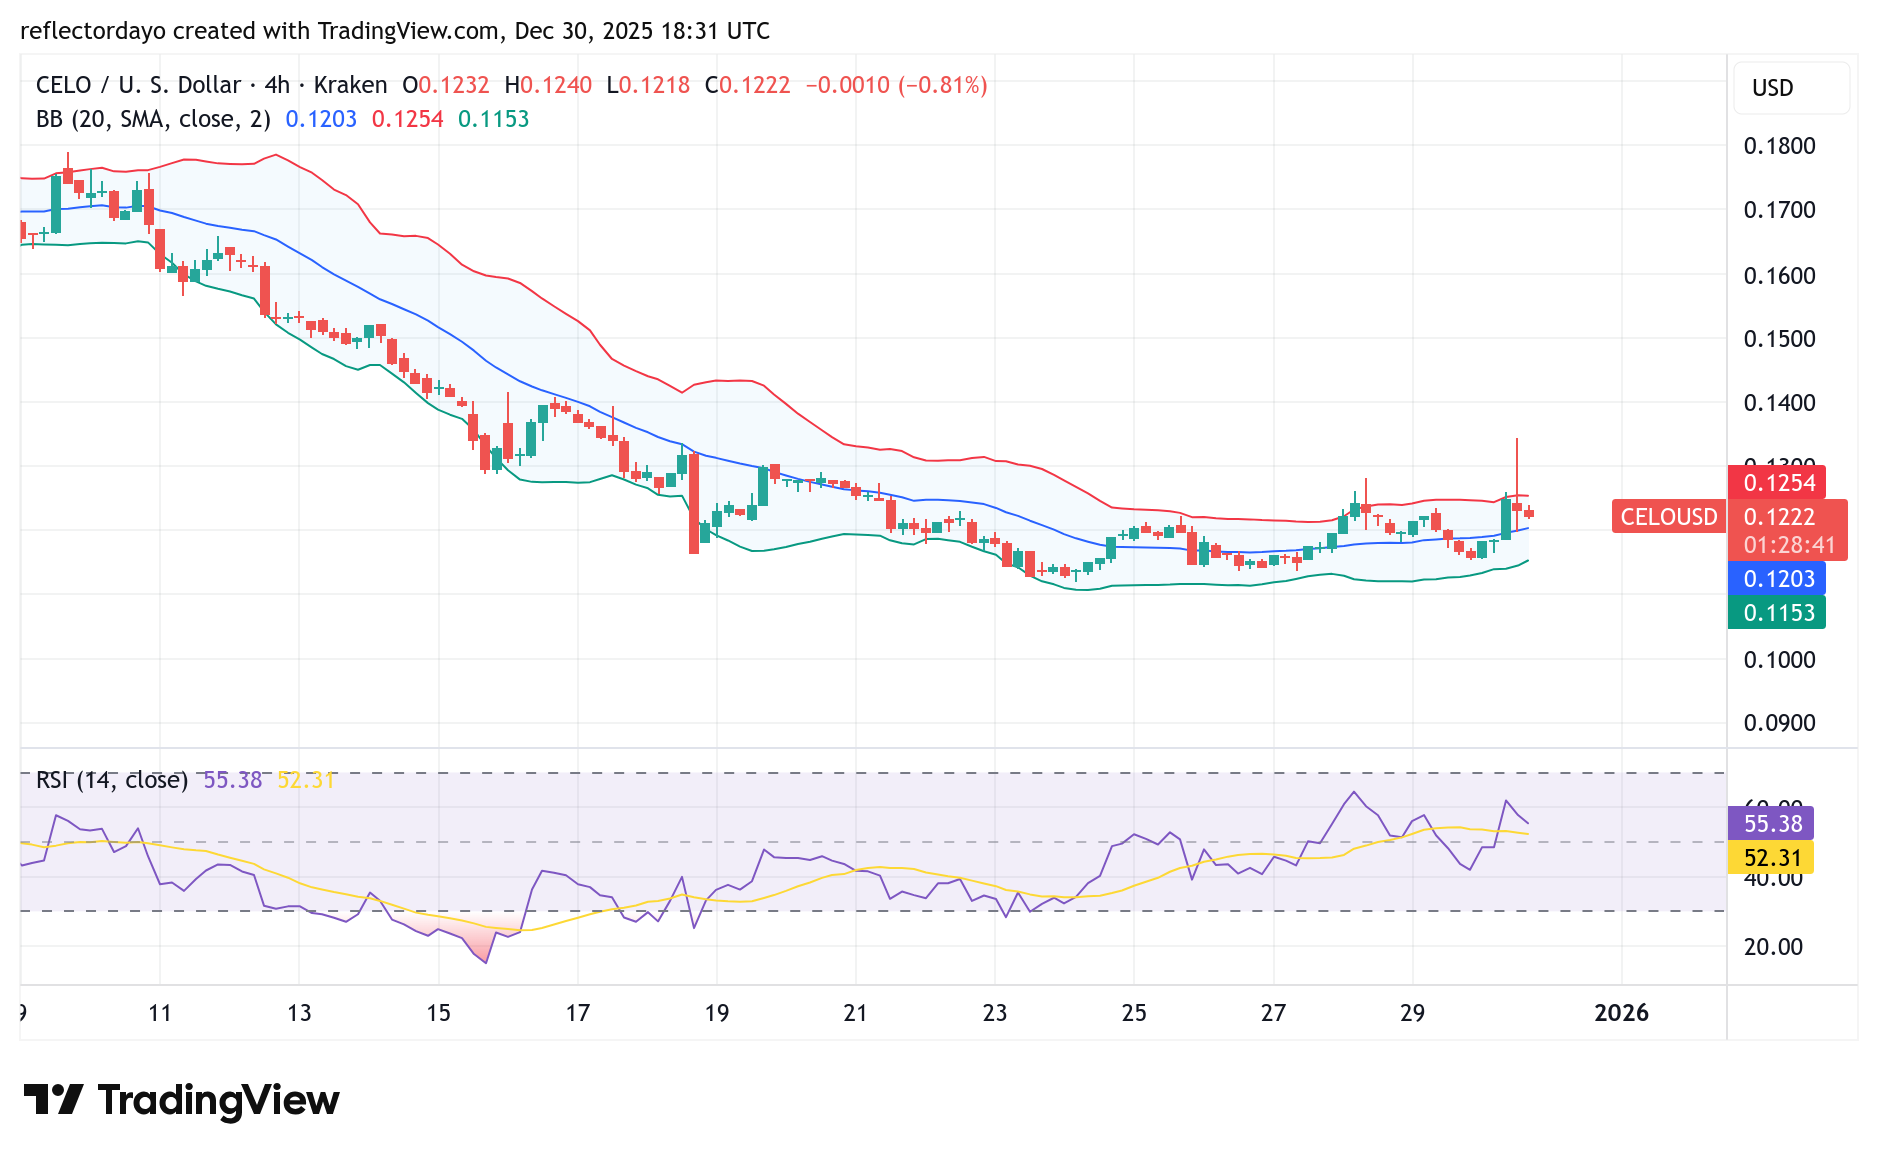
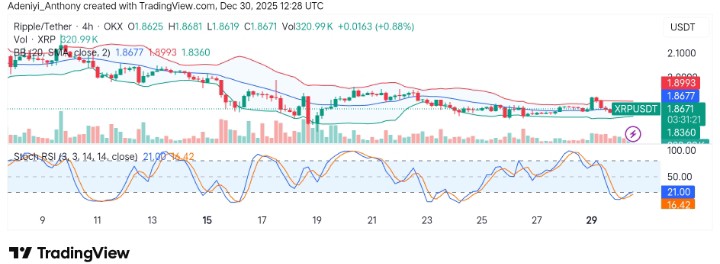
SUIUSDT Short-Term — Neutral (4-Hour Chart)

On the 4-hour chart, SUI continues to hover near the equilibrium zone around $1.40, with Bollinger Bands compressing and volatility remaining subdued. Short-term oscillators are cycling without strong follow-through, reinforcing the idea that this is currently a rotational market rather than a trending one.

Until price either reclaims $1.80 or loses $1.27, the most likely scenario remains range-bound movement with reactive spikes.


SUIUSDT Market Statistics
Current Price: $1.40
Market Capitalization: $1.7B
Trading Volume: $280M

Place winning SUI trades with us. Get SUI here

Celo Market (CELO/USD) Finds Support at $0.12

The bearish CELO/USD market has once again found support at the $0.12 price level. The emergence of bullish bias around this zone has led to price consolidation, signaling a temporary balance between buyers and sellers. This consolidation has persisted since December 23, when the bearish momentum stalled around this support area.

Despite sustained bearish pressure, resilient bulls have continued to defend the $0.12 level, keeping hopes of a potential breakout alive. Although bulls attempted a breakout today, they were unable to sustain the bullish recovery, indicating that stronger buying momentum is still needed to shift market direction.

Celo Market (CELO/USD) Market Data

  • CELO/USD Price Now: $0.122
  • CELO/USD Market Capitalization: $72 million
  • CELO/USD Circulating Supply: 589 million
  • CELO/USD Total Supply: 1 billion
  • CELO/USD CoinMarketCap Ranking: #325

Celo Market (CELO/USD) Finds Support at $0.12

Key Levels to Monitor

  • Resistance: $0.13, $0.14, $0.15
  • Support: $0.12, $0.11, $0.10

Celo Market Analysis: Technical Viewpoint

For now, bearish pressure remains dominant in the Celo market. Prior to the ongoing consolidation around the $0.12 price level, the market experienced an earlier consolidation phase near $0.16, which occurred between late November and early December. This consolidation followed a sharp bearish breakout from the $0.25 price level.

The presence of successive consolidation phases after a prolonged bearish move suggests that selling momentum may be weakening. As a result, the aggressive downtrend could be losing strength, increasing the possibility of a significant breakout to the upside, with price potentially rebounding toward the $0.20 level.

Celo Market (CELO/USD) Finds Support at $0.12

CELO/USD 4-Hour Chart Outlook

From the perspective of the 4-hour chart, bearish price momentum appears to be slowing, as evidenced by the successive consolidation phases that have followed the earlier downtrend. Previously, the market experienced a strong bearish sell-off; however, the repeated consolidation suggests a loss of downside momentum.

This slowdown in market momentum indicates that the market may be stabilizing and potentially preparing for a breakout.

Trade crypto coins on BYBIT

Chiliz (CHZ/USDT) Holds Above $0.0370 as Momentum Begins to Flatten

Price Analysis – Chiliz consolidates near mid-band with mixed signals

CHZ/USDT is currently trading around $0.0370 market level, showing mild gains after rebounding from the lower Bollinger Band near $0.0350 key zone. While the broader structure remains range-bound, price action has shifted into a compression phase, with volatility narrowing and momentum indicators showing early signs of fatigue. The market is holding above short-term support, but conviction remains limited.

CHZ/USDT Market Key Levels

Resistance levels: $0.0470, $0.0500
Support levels: $0.0260, $0.0250

Chiliz (CHZ/USDT) Holds Above $0.0370 as Momentum Begins to Flatten

This phase does not yet qualify as a breakout or reversal. However, the Bollinger Band squeeze and flattening MACD histogram suggest that directional energy is building. Price continues to oscillate near the middle band, reflecting balance between buyers and sellers. A decisive move above $0.0385–$0.0390 would be the first signal of bullish expansion, while failure to hold above $0.0350 could reopen downside risk.

From a higher-timeframe perspective, CHZ remains within a broader consolidation structure following its decline from the $0.0500 zone. The current price region around $0.0375–$0.0380 has acted as a pivot multiple times, and the narrowing Bollinger BandWidth reflects a market preparing for resolution. Traders should stay clear with the right crypto signal before making inform decision.

Chiliz (CHZ/USDT) Holds Above $0.0370 as Momentum Begins to Flatten

Market Expectation

On the lower timeframe, CHZ is trading in a tight band with volatility notably compressed. Price is hovering near its short-term average, and candles show reduced range and volume. This type of behavior typically precedes expansion, with the breakout direction determining the next impulse.

A breakdown below $0.0355 would expose $0.0268–$0.0250 as the next support zone. Conversely, a sustained close above $0.0380 could trigger a move toward $0.0470, where prior resistance remains structurally intact.

You can purchase Lucky Block here.  Buy LBLOCK

Note: Cryptosignals.org is not a financial advisor. Do your research before investing your funds in any financial asset or presented product or event. We are not responsible for your investing results

Pi (PI/USDT) Market Signals Stabilization Near $0.200 Key Zone

Price Analysis – Pi Sellers Lose Momentum

PI/USDT is currently trading around $0.200, holding firm after an extended period of downside pressure. While the broader trend remains tilted to the downside, recent price behavior suggests that selling momentum is slowing. The market has entered a stabilization phase, with price repeatedly defending the $0.200 region and volatility compressing across lower timeframes.

PI/USDT Market Key Levels

Resistance levels: $0.310, $0.270, $0.400
Support levels: $0.140, $0.190, $0.150

Pi (PI/USDT) Market Signals Stabilization Near $0.200 Key Zone

This pause does not yet qualify as a confirmed reversal. However, the contraction in range and reduced bearish follow-through indicate that downside dominance is weakening. As price continues to consolidate above a clearly defined base, the market is positioning itself for a decisive move once direction is resolved.

From a higher-timeframe perspective, PI remains within a broader corrective structure following its decline from prior range highs. The current price zone around $0.200 represents a key reaction area where buyers have consistently absorbed selling pressure. The Bollinger indicator is flattening rather than expanding, reflecting a transition from trend continuation into consolidation. This behavior often appears near potential base-forming zones, though confirmation is still required.

Pi (PI/USDT) Market Signals Stabilization Near $0.200 Key Zone

Market Expectation

On the lower timeframe, PI is trading in a tight range with volatility notably compressed. Price is oscillating near its short-term average, reflecting balance rather than conviction. This type of behavior typically precedes expansion, with the breakout direction determining the next impulse.

A breakdown below $0.200 would undermine the developing base and expose $0.190 as the next downside reference.


You can purchase Lucky Block here.  Buy LBLOCK

Note: Cryptosignals.org is not a financial advisor. Do your research before investing your funds in any financial asset or presented product or event. We are not responsible for your investing results

Compound (COMPUSD) Experiences Temporary Ascent

Price Analysis – COMPUSD Becomes Oversold

The Compound market experienced a prolonged phase of subtle stagnancy between March and September. During this period, price action remained fluid but largely compressed above the $39.20 level, preventing directional expansion. As a result, the 21-period and 89-period Moving Averages intertwined repeatedly, reflecting market indecision before a decisive bearish breakout eventually emerged.

Compound Key Levels

Demand Levels: $27.50, $20.00, $18.00
Supply Levels: $39.20, $54.70, $62.30

Compound (COMPUSD) Experiences Temporary AscentOn the 10th of October, Compound delivered a decisive bearish move, forcefully breaking through the well-defended $39.20 support. This breakdown triggered a structural shift and confirmed bearish dominance as price expanded rapidly to the downside.

Notably, prior to the breakout, the Moving Averages began to separate. The 21-period Moving Average tightened closely to the daily candles, signaling a transition from range-bound conditions into a trending market. Since then, the 21-period Moving Average has consistently acted as dynamic resistance, offering sellers a reliable reentry zone to push prices lower.

Compound (COMPUSD) Experiences Temporary AscentMarket Expectation

The Stochastic oscillator revealed an oversold condition near $23.50, prompting the current rebound. Price typically migrates from oversold toward overbought conditions. A retest of the 21-period Moving Average while momentum remains weak could validate bearish price action and support another decline toward the $23.50 level.

You can purchase Lucky Block here.  Buy LBLOCK

Note: Cryptosignals.org is not a financial advisor. Do your research before investing your funds in any financial asset or presented product or event. We are not responsible for your investing result.

Hyperliquid (HYPE/USDT) Operates Within a Tight Level Amid Low Momentum

The market for Hyperliquid against Tether has increased by 0.85% in the last 24 hours. This pair is outperforming the broader crypto market, which has dropped by 2.15%. This report seems to align with the pair’s positive movement, as the MACD signals a breakout is in view.

As it stands, analysts are of the opinion that the marginal rise can also be linked to sector momentum, as the launch of the rival Lighter’s LIT token has drawn attention to on-chain derivatives.

Currently, Hyperliquid trades at $25.523 with more than 168,000 volumes for the day.

Hyperliquid (HYPE/USDT) Operates Within a Tight Level Amid Low Momentum
HYPEUSDT-Daily Chart

Technical Indicators

Major Resistance Levels: $30.987, $36.858, and $40.486

Major Support Levels: $25.381, $24.000, and $22.000

Technical Analysis

Technically, the market for Hyperliquid against Tether appears to be in a wait-and-see mode, reflecting a broader risk-off sentiment. As it stands, the price seems to have been trapped slightly under the 20-day moving average around $25.914. Though the bearish pressure is visible through the declining volume, as shown by the volume bars. However, the MACD seems to be displaying positive signals as a green histogram appears underneath the chart.

To this end, if the price breaks below the $25,000 level, a move to $22.00 may be seen. However, if momentum increases, a move into the $27 zone may be recorded.

Hyperliquid Today’s Update

Over the last couple of weeks, Hyperliquid’s market has recorded increased participation, especially from the bears. The current price action shows an active repricing process as the token appears to have experienced a strong expansion earlier in its cycle.

As it stands, the $25 to $26 levels act as a major support level; an improvement at these levels would indicate a move towards a major resistance at $30; otherwise, a move below would drive the price near the $22 level.

HYPE/USDT Analysis: Struggling Amidst Market Weakness

On the 4-hour timeframe, HYPE/USDT is showing signs of improvement, likely continuing the straight-line trend as broader market conditions linger.

As it stands, the MACD on the 4-hour chart continues to show negative momentum, confirming a lack of strong bullish pressure. Meanwhile, the price remains wrapped around key moving averages, including the SMA 20 (currently at $25.914), which suggests indecisiveness in the short-term trend.

To this end, the volume spikes are indicative of sell-offs, though the market seems to be in favor of a bounce. However, the current trend looks neutral to bearish in the immediate term. A break above $26.00 would increase the odds drastically.

Hyperliquid (HYPE/USDT) Operates Within a Tight Level Amid Low Momentum
HYPEUSDT-4H Chart


You can purchase crypto coins here. Buy Crypto

Pepe (PEPEUSD) Remains Stagnant After Breakout

Price Analysis – Price is Stuck at $0.00000410

Pepe pushed decisively through the key support level of $0.00000570, confirming sustained bearish pressure across the broader market structure. Following the breakdown, bearish momentum slowed noticeably, and price action transitioned into a prolonged sideways phase. This pause reflects temporary indecision rather than a meaningful shift in trend, as sellers continue to maintain structural control despite reduced volatility. The market appears to be digesting the prior impulse move.

Pepe Key Levels

Demand Levels: $0.00000410, $0.00000300, $0.00000200
Supply Levels: $0.00000800, $0.00001190, $0.00001470

OKX:PEPEUSD Chart Image by Nice11111PEPEUSD formed consistent lower swing highs from late May through September while repeatedly printing equal lows near key demand. Price dropped toward the $0.00000900 region before rebounding briefly, only to form a lower high relative to the previous peak. Between these major swing points, several minor lower highs developed, reinforcing the prevailing bearish market structure.

Anchoring a bearish trendline across the lower highs on the daily chart and combining it with the equal lows produced a large descending triangle formation. Persistent selling pressure eventually forced a downside breakout. Importantly, the breakout occurred with a sharp increase in volume, signaling strong seller commitment and validating the bearish continuation.

OKX:PEPEUSD Chart Image by Nice11111Market Expectation

The Elder Ray Bull and Bear Power Indicator continues to favor bears, confirming sustained downside dominance. With selling pressure intact, price is expected to roll below the $0.00000410 barrier and explore deeper demand zones in the sessions ahead.

You can purchase Lucky Block here.  Buy LBLOCK

Note: Cryptosignals.org is not a financial advisor. Do your research before investing your funds in any financial asset or presented product or event. We are not responsible for your investing result.

XRP (XRP/USDT) Shows Consolidation Near Support, Preparing for a Breakout or Breakdown?

Recently, the market for XRP against Tether has dropped by 1.78%. This continues a downward trend, with a 7-day decline of 1.33% and a 30-day steady decline totaling 15.49%. Analysts attribute this decline to movements in the broader market, particularly as the major coin, Bitcoin, falls back to the $87 level.

Additionally, it appears the pair is struggling to maintain its immediate support level. This struggle has led to increased selling pressure from large holders.

Currently, XRP trades at $1.8669 with more than 5.96 million traded volumes on the daily timeframe.

XRP (XRP/USDT) Shows Consolidation Near Support, Preparing for a Breakout or Breakdown?
XRPUSDT-Daily Chart

Technical Indicators

Major Resistance Levels: $1.9040, $2.0290, and $3.5000

Major Support Levels: $1.8506, $1.7705, and $1.6000

Technical Analysis

Technically, XRP against Tether is currently consolidating under the downward stretch of the mid dynamic band. However, recent price action suggests the pair is ready to break either way.

On the other hand, the Stochastic RSI is near 77.43, signaling that XRP is nearing the overbought territory. This indicates that there might be room for further upward movement, which may not be an explosive one.

To this end, if the $1.8600 support is not maintained, a move into the $2.0000 may remain in black and white.

XRP Update

XRP has remained in an extensive downward move for a while. Meanwhile, current actions show the token is ranging within two large points as a hope that an upside move into the $2 level is heightened. Despite the current bearish action, the support level holds at $1.75 on the daily chart, though actions on the 4h chart have not confirmed an explosive upside move even as the token builds a base around $1.87 to $1.86.

XRP/USDT Analysis: Potential Upside Faces Strong Resistance

In the 4-hour timeframe, the price is still below the middle band at $1.8667. The band seems to be rather squeezed, displaying a traditional signal of an impending breakout. However, the immediate resistance at $1.8995 may prove to be a strong threshold to overcome, as participation seems minimal.

Meanwhile, the Stochastic RSI shows momentum is building as the lines display some improvement from the oversold region. However, a surge in volume is needed to be at the $2.0000 level, as the price may suspend here for some time.

XRP (XRP/USDT) Shows Consolidation Near Support, Preparing for a Breakout or Breakdown?
XRPUSDT-4H Chart


You can purchase crypto coins here. Buy Crypto

Enjin Coin (ENJINUSD) Declines through Bearish Parallel Channel

Price Analysis – Enjin Coin Market Structure Remains Bearish

Enjin Coin has cleanly established a fresh break of structure (BOS) to the downside. Sellers remain firmly dominant, suppressing every recovery attempt. Although bearish momentum slowed temporarily, the recent sideways movement signals redistribution rather than reversal. This pause suggests that the market is preparing for another bearish continuation.

Enjin Coin Key Levels

Demand Levels: $0.0250, $0.0200, $0.0100
Supply Levels: $0.0600, $0.0800, $0.1000

Enjin Coin (ENJINUSD) is Set for Bearish Expansion
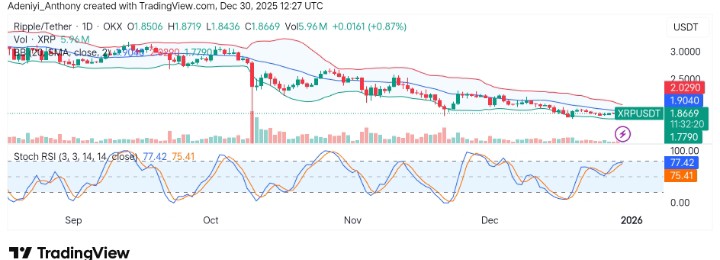
The price formed consistent lower highs while posting equal lows around the $0.0600 support level. This price behavior resulted in a falling triangle pattern. Repeated tests of the support zone weakened buying strength over time. Eventually, the demand failed, triggering a decisive breakout and opening the door for deeper losses.

Following the breakdown, the market organized itself into a bearish parallel channel. Lower highs and lower lows now define the channel structure clearly. Importantly, each pullback toward the channel resistance coincided with overbought readings on the Stochastic indicator, reinforcing seller control and validating trend continuation.

Enjin Coin (ENJINUSD) is Set for Bearish ExpansionMarket Expectation

Price has recently tested the lower boundary of the bearish parallel channel. This aligns with a short-term oversold signal on the Stochastic, explaining the temporary slowdown in downside movement. However, this reaction appears corrective. Given the prevailing bearish structure and channel alignment, the market is expected to resume its downward trajectory in the coming sessions.

You can purchase Lucky Block here.  Buy LBLOCK

Note: Cryptosignals.org is not a financial advisor. Do your research before investing your funds in any financial asset or presented product or event. We are not responsible for your investing results