Decentraland (MANAUSD) Transforms into a Trending Market

Price Analysis – MANAUSD witness strong bearish trend

Decentraland price action has transformed into a one-sided market from a previously range-bound structure. The market decisively broke below the long-defended support region at $0.2290, confirming a bearish shift in structure. Since the breakdown, price has continued to drill steadily lower, with sellers maintaining firm control across the higher time frame. This breakdown invalidated prior consolidation expectations and opened the door for trend continuation, rather than mean reversion. As a result, bearish momentum now dominates overall price action.

Decentraland Key Levels

Supply Levels: $0.2290, $0.3880, $0.5720
Demand Levels: $0.1200, $0.1000, $0.0500

COINBASE:MANAUSD Chart Image by Nice11111
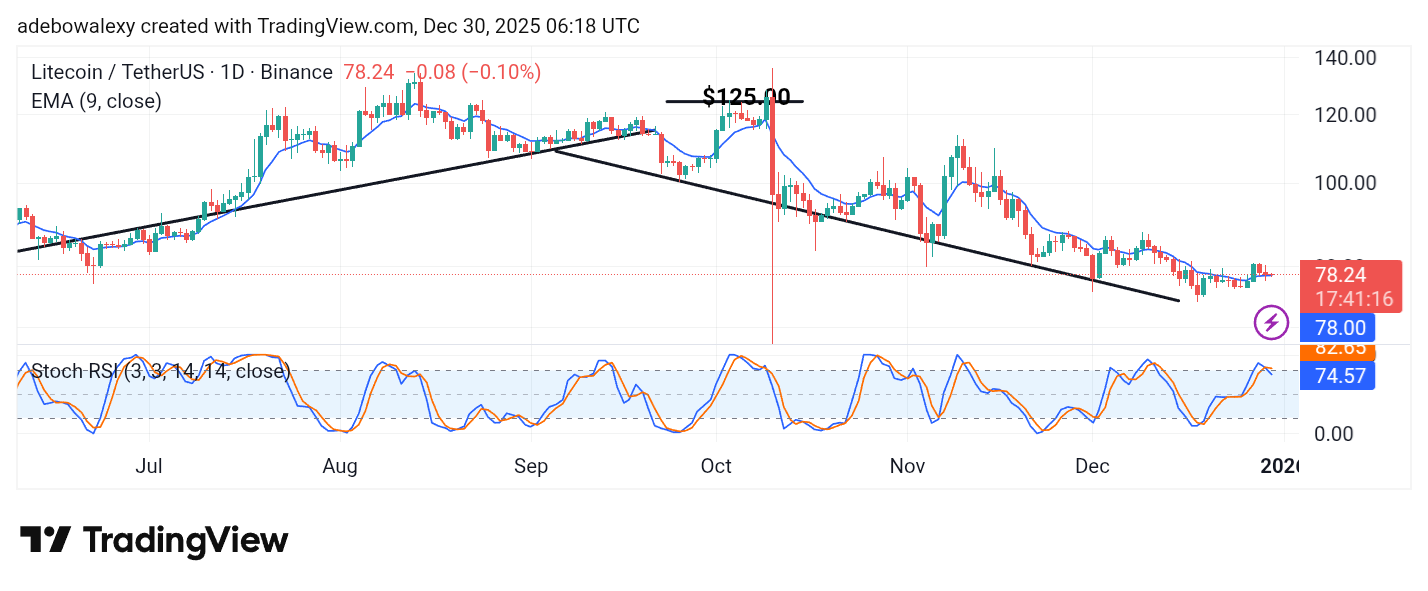
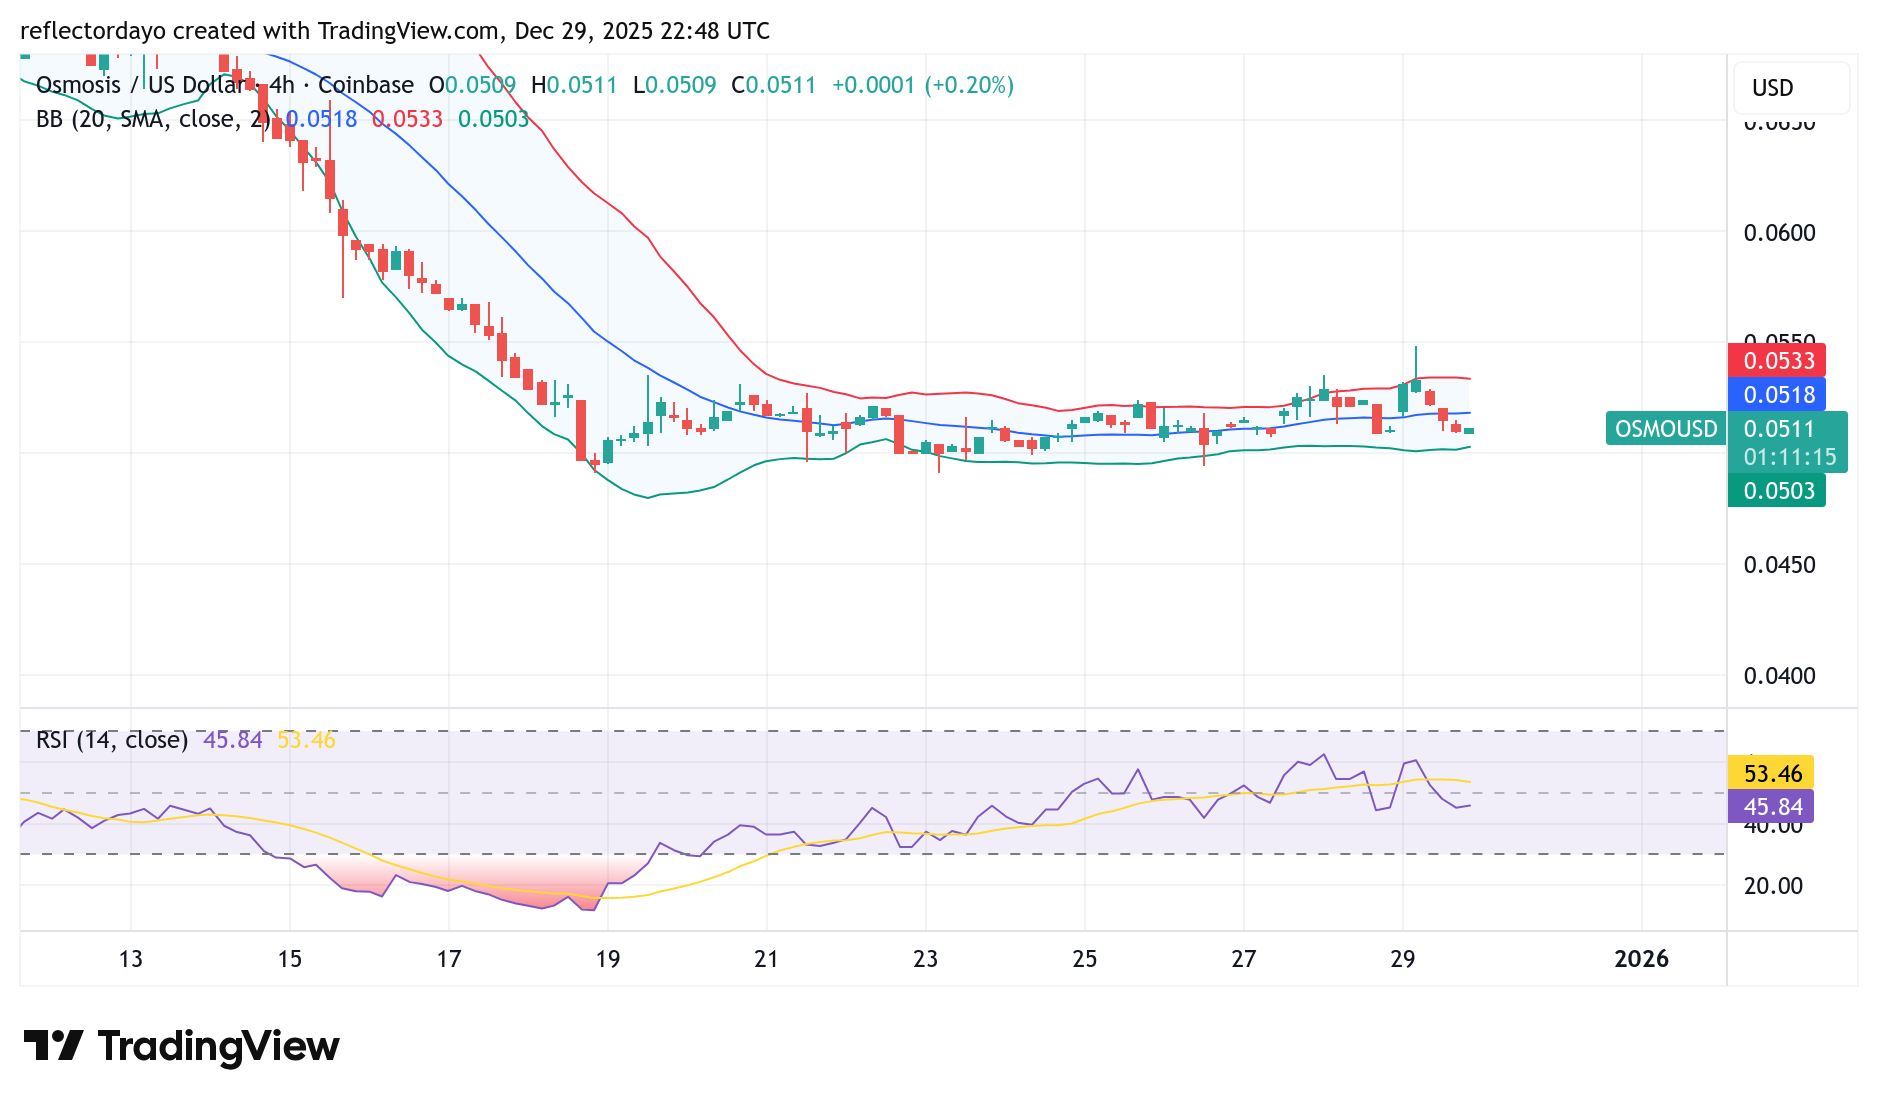
The ADX (Average Directional Index) indicator on the daily chart has risen above the 40 level, clearly signaling the presence of a strong directional trend. This reading aligns with the visibly steep downward slope on the daily chart, reinforcing the idea that the current move is trend-driven rather than corrective. Historically, ADX readings above this threshold suggest sustained momentum, especially when supported by clean price structure.

The ATR (Average True Range), on the other hand, shows a declining slope, indicating reduced volatility despite the ongoing downtrend. This explains the formation of relatively small-bodied candles, suggesting controlled selling pressure rather than panic-driven liquidation.

COINBASE:MANAUSD Chart Image by Nice11111Market Expectation

The prevailing price direction remains bearish, although volatility is muted. Therefore, trend-following strategies remain favorable. Price is expected to sink further until a clear shift in structure or volatility expansion emerges to challenge the current bearish control.

You can purchase Lucky Block here.  Buy LBLOCK

Note: Cryptosignals.org is not a financial advisor. Do your research before investing your funds in any financial asset or presented product or event. We are not responsible for your investing results

CMC 20 Index (DTF) Market Signals Rising Compression as Price Pauses Near Key Equilibrium

CMC 20 Index Price Prediction — December 29th

The CMC 20 Index (DTF) is showing clear signs of market hesitation as price stabilizes around the $184.00 region. Following a sharp repricing move earlier in the cycle, the index has transitioned into a controlled consolidation phase, with volatility steadily contracting. This behavior reflects a market that has absorbed recent shocks and is now recalibrating, awaiting a directional catalyst.

CMC 20 Index (DTF) Market Key Levels

Resistance levels:$203.00, $227.00
Support levels:$176.00, $97.00

CRYPTO:CMC20USD Chart Image by Gaint-writerCMC 20 Index Long Term Trend- Neutral (Daily Chart)

Bollinger Bands on the short-term timeframe are tightening noticeably, signaling reduced volatility and balance between buyers and sellers. Price is hovering close to the moving average, reinforcing the idea that the market is currently pricing fair value rather than trending aggressively. This type of compression often precedes expansion, making the surrounding range boundaries increasingly important.


What is the market outlook of CMC 20 Index?

From a broader perspective, the index is consolidating after an abnormal expansion move that pushed price sharply higher before stalling. The current structure resembles a digestion phase rather than distribution, with candles shrinking and momentum flattening. This suggests neither side has full control at present.

As long as price remains trapped between $176.00 and $203.00, the market bias stays neutral. A sustained breakout above resistance would signal renewed bullish participation and open room toward $227.00, while a breakout below support would indicate that the consolidation has failed, exposing deeper downside risk toward the $97.00 macro floor visible on the chart.

CRYPTO:CMC20USD Chart Image by Gaint-writerCMC 20 Index Short-Term – Neutral (4-Hour Chart)

On the lower timeframe, price continues to oscillate around the mean, reflecting equilibrium conditions. Buyers have not yet demonstrated strength above resistance, while sellers have also failed to force acceptance below support. This reinforces the idea that the next meaningful move will be reactive, not gradual.

CoinMarketCap 20 Index (CMC20) Market Statistics
Current Price:  $184.00
Market Capitalization:$6.36M
Trading Volume: $2.30M

You can purchase DTF here: BUY DTF

TRON (TRX/USD) Holds At $0.280 Key Level

TRX/USD Price Prediction – December 28th

TRON (TRX/USD) is trading around $0.280 key level, attempting to stabilize after a pronounced pullback from the late-summer highs. Selling pressure has clearly slowed, and price is no longer in a sharp decline. However, the market has not yet reclaimed any of the major resistance shelves above, keeping the broader structure fragile.

TRX/USD Market Levels

Support Levels: $0.270, $0.200
Resistance Levels: $0.300, $0.320

TRON (TRX/USD) Holds At $0.280 Key LevelTRX/USD Long Term Trend- Bearish (Daily Chart)

What we are seeing now is not a confirmed reversal, but a pause. TRX is building a short-term base beneath resistance, a condition that often leads to either a continuation breakdown or a sharp relief rally once direction is chosen.

What is the market outlook of TRX/USD?

From a higher-timeframe perspective, TRX transitioned from a strong advance into a corrective phase that erased multiple layers of support. The current range around $0.270–$0.280 represents a reaction zone where buyers are attempting to slow the decline.

That said, price is still trading below a dense resistance cluster, meaning this consolidation is happening under supply, not above reclaimed support. Until that changes, upside moves remain structurally corrective. MFI is hovering around neutral territory, indicating balanced capital flow. There is no sign of panic selling, but there is also no clear evidence of strong accumulation. This reinforces the idea of indecision rather than recovery.

TRON (TRX/USD) Holds At $0.280 Key LevelTRX/USD Short Term Trend- Bearish (4-Hour Chart)

On the 4-hour timeframe, TRX is moving sideways between $0.270 support and $0.30 resistance, with price clustering around the $0.28 mid-range. MFI is slightly elevated, showing modest short-term buying interest. This helps explain why $0.27 continues to hold. However, repeated upside attempts near resistance are being absorbed, preventing any clean breakout.

TRX/USD Market Statistics

Current Price: $0.28

Market Capitalization: $25.8B

Trading Volume: $260M


You can purchase TRON here. Buy TRX


Litecoin (LTC) Price Prediction: LTC/USDT Yet to Escape Gravitational Pull

Date: December 30, 2025

Litecoin has continued to trade near lower price levels, while overall price action remains weighed down by bearish sentiment. Although price movement on the daily chart is still holding above some key technical levels, downward forces remain firmly in control of the market.

LTC/USDT Long-Term Trend — Bearish (Daily Chart)

Key Price Levels

Resistance: $80, $85, $90

Support: $75, $70, $65

Litecoin (LTC) Price Prediction: LTC/USDT Yet to Escape Gravitational Pull

Price activity in the Litecoin 24-hour market is trending toward lower price levels. The price candle corresponding to the current session is red. However, this candle appears noticeably smaller, allowing price to remain slightly above the 9-day Exponential Moving Average (EMA) line. Meanwhile, the Stochastic Relative Strength Index (SRSI) indicator lines have just delivered a downward crossover. The terminal ends of the indicator lines are dropping through the 80 level and may continue moving lower.

Litecoin (LTC) Price Prediction: LTC/USDT Tests a Key Baseline

On the LTC daily chart, price action has been gradually declining over the past two sessions. Despite this, bearish momentum appears to have weakened slightly during the same period.

The most recent price candle is red with a relatively small body, as price tested the 9-day EMA curve. At the same time, the SRSI indicator lines have completed a downward crossover, with the terminal points of the indicator sliding toward lower thresholds. At this stage, it appears that bears may still retain control of the market.

Litecoin (LTC) Price Prediction: LTC/USDT Continues to Struggle (4-Hour Chart)

Even on the 4-hour chart, price action has remained unable to break above a key resistance level. The most recent price candle on this timeframe is green but heavily compressed, with a clear upper shadow.

Litecoin (LTC) Price Prediction: LTC/USDT Yet to Escape Gravitational Pull

Meanwhile, the SRSI indicator lines are turning upward from their position in the oversold region of the indicator. Nevertheless, price action remains capped below the 9-day EMA curve. As a result, this market still appears vulnerable to further downside, with prices potentially drifting toward the $75 level.

Get Litecoin (LTC) here. Buy LTC 

Bloomberg Strategist Predicts $2,000 for Ether Amid Current Market Conditions

Mike McGlone, a senior commodity strategist at Bloomberg Intelligence, has recently shared a bearish outlook on Ether. He is of the opinion that the token has the tendency to trade towards $2,000 rather than a move to $4,000.

As it stands, the analyst has pointed out that Ethereum has been on a prolonged decline in value. To this end, McGlone warns that the broader market challenges and macroeconomic risks may continue to weigh on its potential for growth.

Ethereum’s Struggles Compared to Bitcoin and Other Assets

McGlone, in the analysis, compared Ethereum’s tight range-bound movement to the performance of Bitcoin, gold, and major stock indices, which have all shown significant growth in recent times.

Bloomberg Strategist Predicts $2,000 for Ether Amid Current Market Conditions

He is of the opinion that the token has recorded an extended period without price increases, suggesting a potential shift and reallocation of investors’ portfolios.

To this end, McGlone’s remarks suggested that Ethereum’s failure to appreciate compared to other assets during long periods of market expansion could make it less appealing to investors.

Additionally, he stressed that the duration of market conditions plays a key role in asset performance. The analyst presented his observation that assets that underperform for extended periods are often reexamined by the market. He went on by stating that this becomes important for informed decisions to be made, especially when the broader economic environment shifts.

Other Analysts Present Optimistic Views on Ethereum’s Future

While McGlone has consistently been cautious about Ethereum’s outlook, other analysts have a more optimistic view. At the moment, the head of digital assets research at Standard Chartered, Geoffrey Kendrick, has suggested that improvements for Ethereum’s stability and institutional adoption will help boost momentum.

In a similar fashion, Gautam Chhugani, managing director at Bernstein, has also highlighted Ethereum’s role as the core infrastructure for on-chain finance. Hence, the manager notes that its value is linked to the growth of stablecoins and the issuance of real-world assets.

Additionally, David Duong, from Coinbase Institutional Research, also pointed to the importance of sustained developer activity and the rising use of layer-two solutions, raising the opinion that this could support stronger performance for Ethereum if the broader market condition for digital assets improve.

Put together, the cautious stance from McGlone on Ethereum appears to be contrasting with the combined views from other analysts. However, this analysis reflects the cloud of uncertainty that covers Ethereum as macroeconomic challenges persist.


In order to place winning trades with us via Bybit, you can open an account here.

Osmosis (OSMO/USD) Absorbs Bearish Pressure at $0.050

The Osmosis market has been in a sustained downtrend for some time, beginning in early October after peaking near the $0.20 price level. By October 10, the market identified the $0.050 level as a potential support zone, following an initial test of this area.

Since then, price action continued its gradual descent toward this support. When the market reached the $0.050 level on December 17, bullish interest began to emerge, effectively absorbing bearish pressure. This shift in sentiment has kept the price consolidating around the $0.050 level, suggesting that buyers are actively defending this zone.

Osmosis (OSMO/USD) Market Data

  • OSMO/USD Price Now: $1.238
  • OSMO/USD Market Capitalization: $462 million
  • OSMO/USD Circulating Supply: 375 million MORPHO
  • OSMO/USD Total Supply: 999.99 million MORPHO
  • OSMO/USD CoinMarketCap Ranking: #93

Key Levels to Monitor

  • Resistance: $0.06, $0.07, $0.08
  • Support: $0.04, $0.03, $0.02

Osmosis Market Analysis: Technical Viewpoint

Bullish resilience became evident after bearish price action reached this zone on December 17. The Osmosis market’s reaction at this level highlights growing buyer strength and suggests that accumulation may already be underway.

Given the historical significance of this price area in the crypto signal, it is natural to expect a bullish bias from traders around this level. The ongoing consolidation further supports the idea that market participants may be positioning ahead of a potential move. As a result, attention remains firmly on this zone, with expectations building for a possible breakout.

From an indicator perspective, the Relative Strength Index (RSI) shows the market hovering in oversold territory. When a key technical support level aligns with an oversold RSI reading, it often signals the potential for a strong price move—specifically, a rebound.

Osmosis (OSMO/USD) Absorbs Bearish Pressure at $0.050

OSMO/USD 4-Hour Chart Outlook

Zooming into the 4-hour timeframe, the Osmosis market shows signs of consolidation accompanied by a gradual upward bias. While price action remains range-bound, a subtle ascent is developing, which is also reflected in the Relative Strength Index (RSI). This suggests that bullish momentum is slowly building, even as broader bearish pressure persists.

However, bullish strength has not yet been sufficient to trigger a decisive breakout. Earlier today, bulls gathered enough momentum to attempt a move higher but were rejected at the $0.055 price level during the second 4-hour trading session. This rejection confirms $0.055 as a short-term resistance level.

Despite this setback, the market continues to maintain a gradual upward structure. If this steady ascent is sustained, the $0.055 resistance level may eventually give way to renewed buying pressure.

Trade crypto coins on BYBIT

The Unbendable in Trading

A trader will inevitably face moments when the market forces an exit. At such times, the trader’s mind can begin to quietly resist. The trader starts thinking, “Perhaps this isn’t real,” or “Maybe this is just a negligible shift in sentiment, not a true breakdown.”

This situation is not unusual in trading. It mirrors the inner dialogue people experience during periods of loss. At such times, the mind attempts to rewrite reality in order to avoid pain. In both life and trading, bargaining is often the final attempt to escape discomfort.

Just as grief demands acceptance rather than debate, a stop-loss requires the same discipline.

When a stop is triggered, the chart is no longer the issue. The real test is whether you can respect the rules you set when your mind was calm, rational, and free from pressure.

A stop-loss is not a forecast of market direction.

It is a commitment you made to yourself.

And that commitment is challenged at the exact moment you feel least inclined to honor it.

Why Stops Are Non-Negotiable

The instant a stop is hit is also when emotional bias is strongest. Much like the early stages of grief, the trader’s mind begins to bargain: “Just a little more time, and things might reverse.”

This impulse is natural, but it is also dangerous.

Stops exist because emotions distort judgment in real time. They act as a safeguard, removing you from a trade before fear, hope, and denial override the objectivity you had when you planned the trade.

Do not bargain—exit immediately.

Although clarity often comes only after action, clarity itself is a gift.

Feeling Versus Structure: A Valuable Distinction, but Not in the Moment

Traders often ask whether price movements are structural or driven by sentiment. This distinction is useful—but not in real time.

Just as a grieving person cannot clearly understand their emotional state until the grieving has passed, a trader cannot accurately interpret the nature of a price decline while it is unfolding.

A market-wide dip may be sentiment-driven, while a sharp price break may be structural. Often, the difference only becomes clear in hindsight. Your task in the moment is not interpretation—it is execution.

The False Comfort of Waiting for Confirmation

When bargaining takes hold, the mind looks for reasons to delay action:

“I’ll wait for a death cross.”

“I need volume confirmation.”

“Maybe the trend hasn’t really failed yet.”

This behavior reflects a deeply human tendency to postpone accepting uncomfortable realities.

However, seeking confirmation after a stop level has been breached is simply bargaining in disguise. The moment confirmation becomes necessary, the stop no longer protects—it negotiates.

And negotiations made during moments of loss rarely end well.

The Trap of Partial Exits

Selling only part of a position can feel sensible, much like how a grieving mind accepts fragments of truth while resisting the whole.

But unless partial exits are explicitly built into your trading system, they create serious problems. They introduce inconsistent risk, distort position sizing, and make performance evaluation unreliable.

More importantly, partial exits allow hope to re-enter the decision-making process—something disciplined traders work hard to exclude.

Hope is not a strategy. It is an emotional currency offered by a mind seeking to avoid closure.

A Perfect Stop Does Not Exist, but Honest Behavior Does

There will always be trades where a stop is hit, only for the market to reverse and move toward the original profit target. This experience carries a particular sting.

It feels like grief—a moment where everything was done correctly, yet the outcome still hurts. This discomfort is unavoidable in systematic trading. A trader’s job is not to avoid every wrong exit, but to avoid catastrophic ones.

Consistency only emerges when stops are treated as instructions, not invitations to renegotiate the future.

The Trader’s True Test

The market does not respond to desire, logic, or a sense of fairness. It is indifferent to how badly you want a trade to succeed.

A stop-loss is not a measure of intelligence—it is a measure of integrity.

It asks one simple question:

Will you accept reality, or will you argue with it?

Just as acceptance allows healing in grief, acceptance preserves capital in trading.

When a stop is triggered, the correct response is decisiveness and discipline—not debate.

BNB (BNB/USDT) Consolidates Amidst Signs of Potential Reversal

The market for BNB against Tether in the last 24 hours rose by 0.64%, performing slightly better than Bitcoin, which gained 0.44%. However, it appears that this increase came during a wider crypto market rally led by Bitcoin, as the coin briefly touched the $90,000 level. Meanwhile, from a technical point of view, market indicators support the pair’s upward move, as the RSI bounced to the north. This signals that selling pressure is easing and short-term momentum may continue if the market remains positive.

Beyond price action, ecosystem and institutional developments strengthened sentiment around BNB. This can be noticed in the Maxwell hard fork and VanEck and Franklin Templeton institutional activities as DeFi actions.

Currently, BNB trades at $851.83 with more than 90,000 volumes at the time of writing.

BNB (BNB/USDT) Consolidates Amidst Signs of Potential Reversal
BNBUSDT-Daily Chart

Technical Indicators

Major Resistance Levels: $860.00, $885.72, and $950.00

Major Support Levels: $859.15, $847.55, and $800.00

Technical Analysis

Technically, the market for BNB against Tether on the daily timeframe shows a period of range-bound moves after a sharp plummeted value. However, despite the recent dip in price, the pair hovers near a support level. This has drawn attention to possible bullish opportunities if key resistance levels are broken in the coming sessions.

As it stands, the price is below the moving averages, bringing to the limelight the dominating sides. However, with the formation of a double bottom at the current level, BNB may be preparing for more upside. Meanwhile, the pair awaits the test of $860 resistance for a solid base to the north as the Stochastic RSI reads an overbought condition.

BNB’s Update Today

On the smaller timeframe, BNB/USDT has been spotted to be building a base after a meltdown in October. The analyst suggests the token holds a lot of potential and resilience features despite massive bearish movement in the previous sessions. He opined that buying the dip with an anticipation of a northbound move brings the probabilities in the investors’ favor.

BNB/USDT Analysis: Setting the Stage?

On the 4-hour chart, BNB/USDT appears to be approaching the 100-period SMA after hitting slightly above $860. The pair tends to tend to the south, creating buying opportunities for the bulls as the lines of the momentum oscillator return into the neutral zone.

As it stands, BNB may extend upward soon, provided the $850 support holds, signaling a short-term bullish run again; otherwise, a fall below this level may lead to continued consolidation.

BNB (BNB/USDT) Consolidates Amidst Signs of Potential Reversal
BNBUSDT-4H Chart


You can purchase crypto coins here. Buy Crypto