BNB (BNB/USDT) Consolidates Amidst Signs of Potential Reversal

The market for BNB against Tether in the last 24 hours rose by 0.64%, performing slightly better than Bitcoin, which gained 0.44%. However, it appears that this increase came during a wider crypto market rally led by Bitcoin, as the coin briefly touched the $90,000 level. Meanwhile, from a technical point of view, market indicators support the pair’s upward move, as the RSI bounced to the north. This signals that selling pressure is easing and short-term momentum may continue if the market remains positive.

Beyond price action, ecosystem and institutional developments strengthened sentiment around BNB. This can be noticed in the Maxwell hard fork and VanEck and Franklin Templeton institutional activities as DeFi actions.

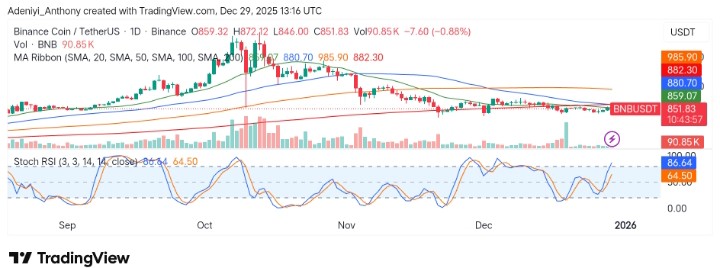
Currently, BNB trades at $851.83 with more than 90,000 volumes at the time of writing.

BNB (BNB/USDT) Consolidates Amidst Signs of Potential Reversal
BNBUSDT-Daily Chart

Technical Indicators

Major Resistance Levels: $860.00, $885.72, and $950.00

Major Support Levels: $859.15, $847.55, and $800.00

Technical Analysis

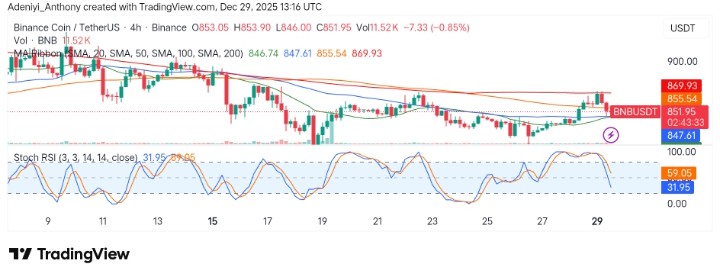
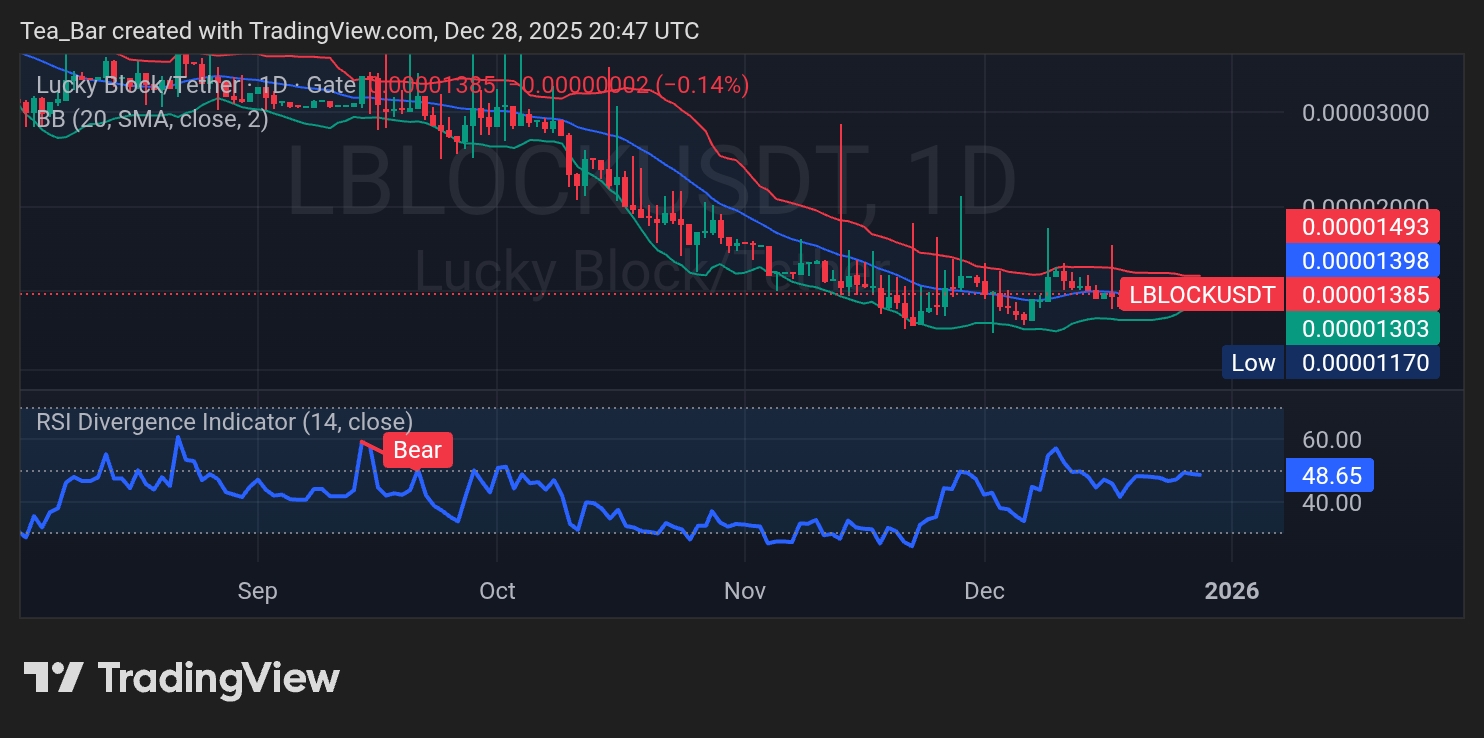
Technically, the market for BNB against Tether on the daily timeframe shows a period of range-bound moves after a sharp plummeted value. However, despite the recent dip in price, the pair hovers near a support level. This has drawn attention to possible bullish opportunities if key resistance levels are broken in the coming sessions.

As it stands, the price is below the moving averages, bringing to the limelight the dominating sides. However, with the formation of a double bottom at the current level, BNB may be preparing for more upside. Meanwhile, the pair awaits the test of $860 resistance for a solid base to the north as the Stochastic RSI reads an overbought condition.

BNB’s Update Today

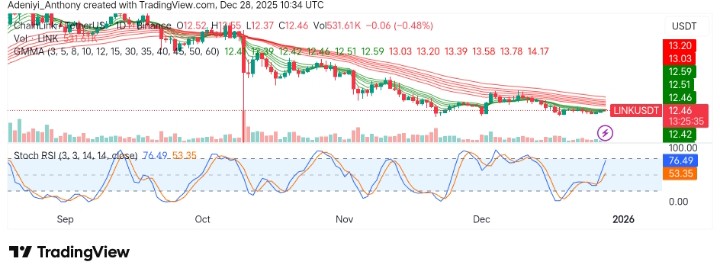
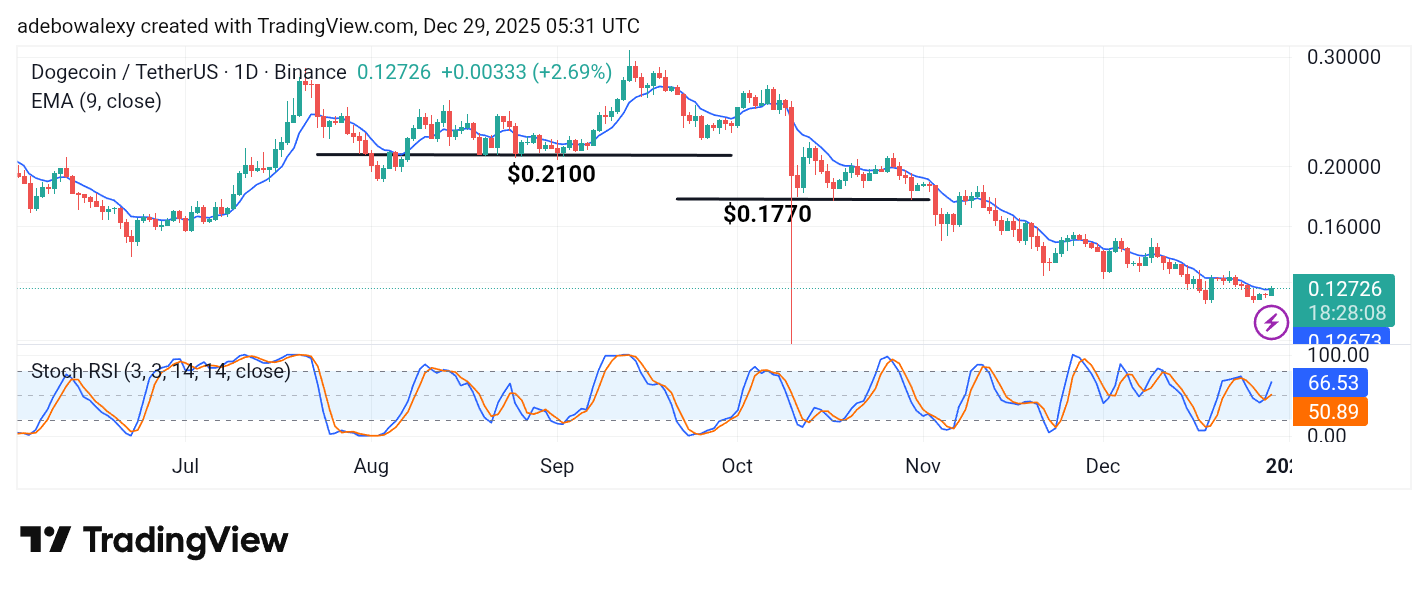
On the smaller timeframe, BNB/USDT has been spotted to be building a base after a meltdown in October. The analyst suggests the token holds a lot of potential and resilience features despite massive bearish movement in the previous sessions. He opined that buying the dip with an anticipation of a northbound move brings the probabilities in the investors’ favor.

BNB/USDT Analysis: Setting the Stage?

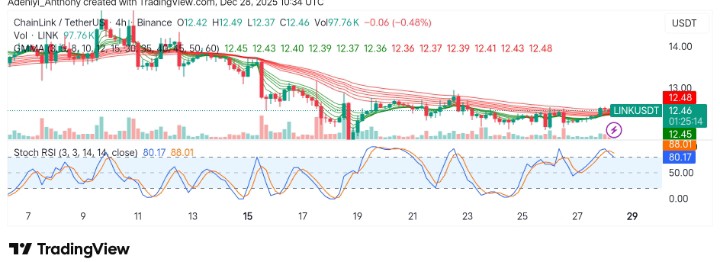
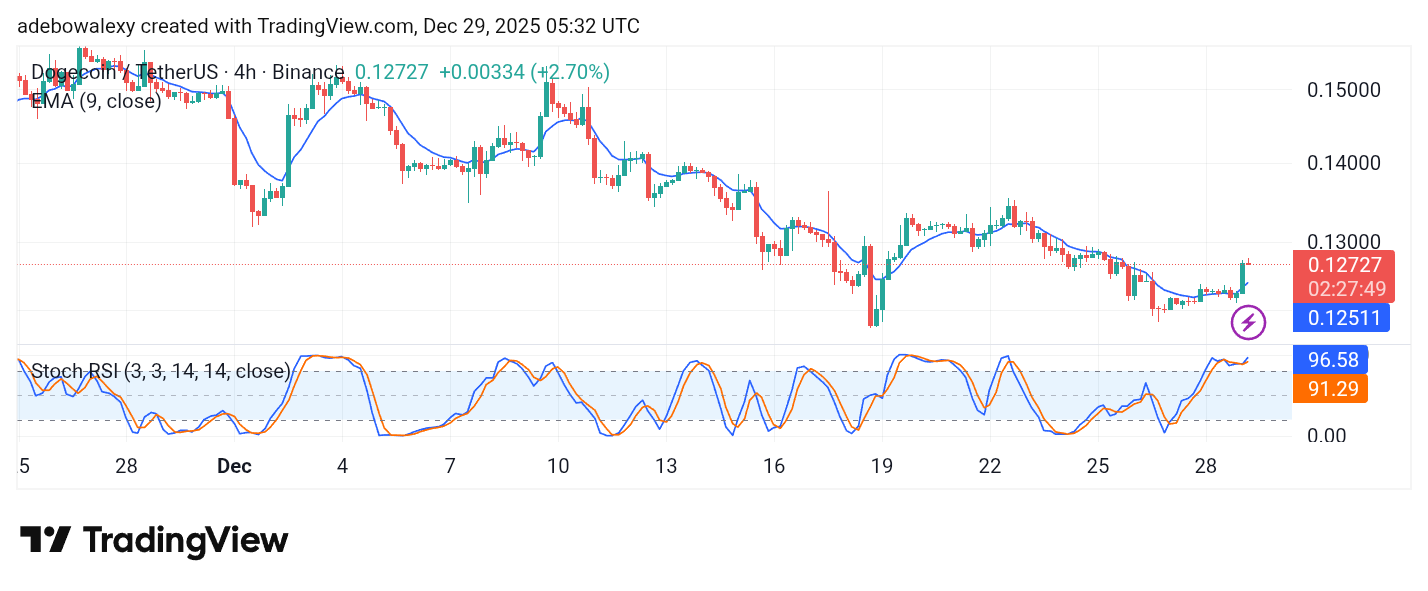
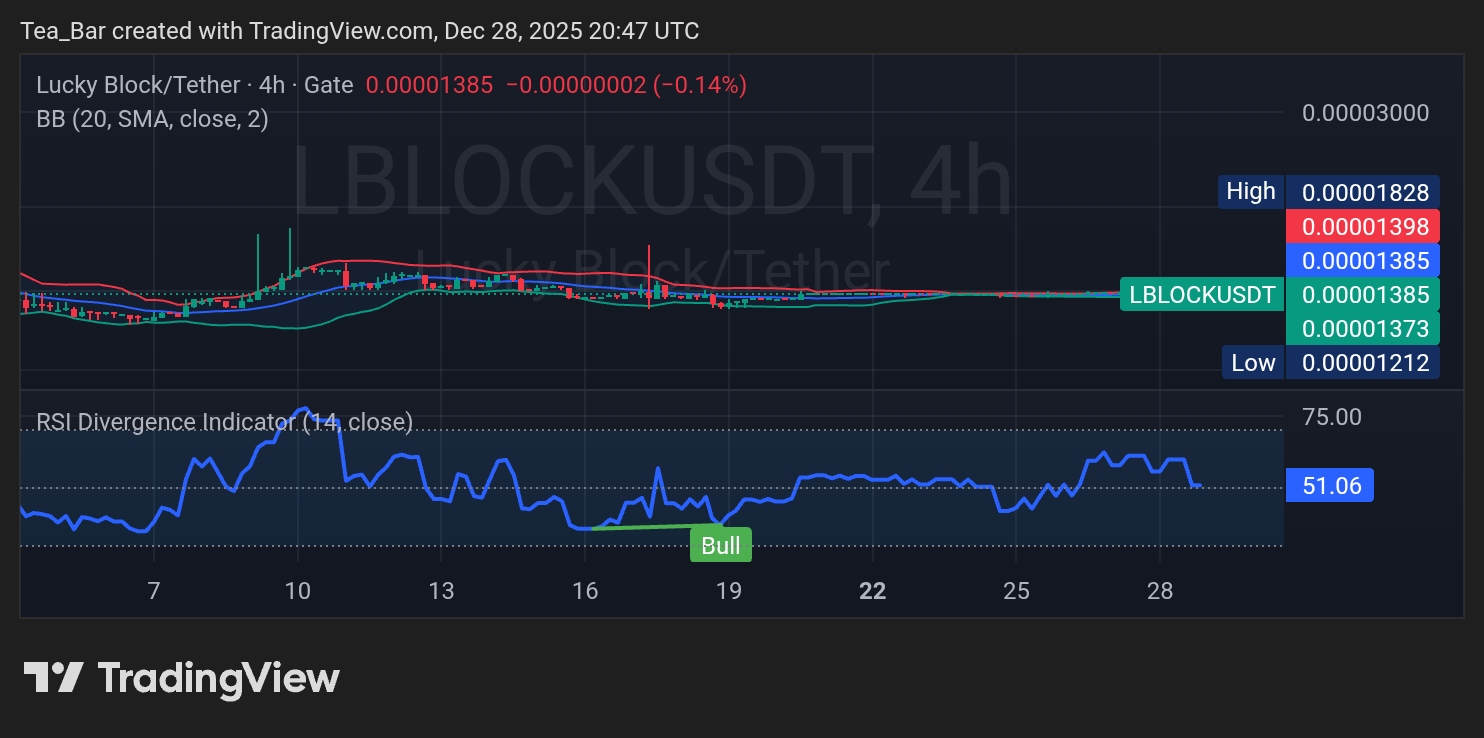
On the 4-hour chart, BNB/USDT appears to be approaching the 100-period SMA after hitting slightly above $860. The pair tends to tend to the south, creating buying opportunities for the bulls as the lines of the momentum oscillator return into the neutral zone.

As it stands, BNB may extend upward soon, provided the $850 support holds, signaling a short-term bullish run again; otherwise, a fall below this level may lead to continued consolidation.

BNB (BNB/USDT) Consolidates Amidst Signs of Potential Reversal
BNBUSDT-4H Chart


You can purchase crypto coins here. Buy Crypto

Dogecoin (DOGE) Price Prediction: DOGE/USDT Crawls Past the 9-Day EMA

Date: December 29, 2025

The Dogecoin market has been in a long-term bearish correction, with the price decline spanning three consecutive months. However, lately, the market appears to be making some attempts toward an upside recovery.

DOGE/USDT Long-Term Trend — Bullish (Daily Chart)

Key Price Levels:

Resistance: $0.1300, $0.1400, $0.1500

Support: $0.1200, $0.1100, $0.1000

Dogecoin (DOGE) Price Prediction: DOGE/USDT Crawls Past the 9-Day EMA

Today’s trading has pushed the Dogecoin market above the 9-day Exponential Moving Average (EMA) line. This occurred via the last price candle on the chart, which pierced through the 9-day EMA curve. Additionally, the Stochastic Relative Strength Index (SRSI) indicator lines are maintaining an upward trajectory after delivering an upside crossover above the 50 level of the indicator.

Dogecoin (DOGE) Price Prediction: DOGE/USDT Bulls Make a Move to Keep Dominating

Price action has recently managed to gain some bullish momentum. The last price candle on the Dogecoin daily chart appeared green and suggests more notable momentum than in previous sessions. It has also pushed the token to trade above the 9-day EMA curve. Furthermore, the SRSI indicator lines have delivered an upside crossover and are continuing along that path. Consequently, this aligns the market for further upward movement.

Dogecoin (DOGE) Price Prediction: DOGE/USDT May Stay on Track Despite Minimal Rejection (4-Hour Chart)

Looking at the Dogecoin market on the 4-hour chart, it can be seen that upside forces have pushed price action above the 9-day EMA curve, achieved during the previous session.

Dogecoin (DOGE) Price Prediction: DOGE/USDT Crawls Past the 9-Day EMA

Nevertheless, the last price candle on the chart is a small red one, but it still keeps the token trading above the 9-day EMA line. Similarly, the SRSI indicator lines are in the overbought region, yet they continue to point upward. This suggests that prices in this market may advance a bit further, potentially reaching the $0.1360 price level in the near term.

Get Dogecoin (DOGE) here. Buy DOGE 

Social Engineering Scams: Manipulating Trust for Financial Gains

Social engineering scams are deceptive method used by criminals to trick people from an emotional angle.

It involves fraudulent attack on human trust, fear, and the need for urgency to illegally access personal or corporal assets.

The Psychology: Human Nature and Social Scam

Social engineering scams naturally work because human beings are naturally trusting and curious. Fraudsters usually take advantage of this opportunity by using psychological tricks to prompt victims into action without critical thinking.

Social Engineering Scams: Manipulating Trust for Financial Gains

As it stands, some commonly used tactics include phishing, which involves fraudulent emails that appear to be from trusted companies, leading victims to click on malicious links or enter their login credentials. Another one is called vishing, an act of impersonating authorities or customer service representatives over the phone to steal personal information. Also, there is smishing (SMS phishing), a well-constructed text message designed to lure users into clicking links or revealing personal data. Aside from the aforementioned, there also exist Business Email Compromise (BEC), romance scams, and a lot more.

However, it is important to note that these tactics exploit emotions like urgency or fear, pushing victims to act quickly without time for rational appraisal for authentication.

Forms of Social Engineering Scams

Social engineering scams come in variants; some are familiar, others come with technological loopholes. For example, tech support scams trick victims into calling fake support numbers, where they are asked to install virus-infused applications or pay for non-existing services.

Social Engineering Scams: Manipulating Trust for Financial Gains
Source: M&T Bank

Research shows that in 2024, some parts of Southeast Asia saw a rise in romance-to-investment scams. This is a type of social scam where victims were emotionally manipulated into investing in fake cryptocurrency platforms. As expected, this action led many into significant financial losses, all in the name of emotional feelings.

The Red Flags: Spotting Social Scams

To easily identify socially engineered requests, one must take note of unexpected requests for money or personal information alongside strange grammar or odd URLs in emails or messages.

Additionally, it is important to watch out for unusual caller IDs, panic and level of secrecy, and uncommon payment requests, such as cryptocurrency or gift cards.

As it stands, knowing these schemes is never enough; one must learn to prevent them. It is important never to share one-time passwords (OTPs) or passwords, even if the request seems official. Also, the use of multi-factor authentication (MFA) and double-checking the identity of senders is essentially irrespective of the familiarity level.

However, in the case of financial institutions, it is important to infuse an AI-driven system to detect scams and never take customers’ education on scams as a wasted investment.

Conclusively, social engineering scams show that people, rather due to emotions, are often the weakest link in security, and sensitization is needed.


In order to place winning trades with us via Bybit, you can open an account here. 

Lucky Block Builds Quiet Strength as the Next Move Takes Shape

Lucky Block (LBLOCK) is showing encouraging signs of balance and structure as it trades around $0.00001385, suggesting the market may be laying the groundwork for a fresh advance. Rather than signaling weakness, the current price behavior reflects a calm, controlled phase where selling pressure has eased and buyers are beginning to reassert themselves. This type of environment often marks the transition from correction to recovery, positioning Lucky Block as an increasingly interesting project to watch as momentum gradually rebuilds.

Daily Chart – Where Stability Turns Into Opportunity

On the daily chart, LBLOCK is holding comfortably near the middle of the Bollinger Bands, a sign that price action has entered a phase of equilibrium. The narrowing bands point to declining volatility, a technical condition that frequently precedes a meaningful breakout. Crucially, the recent floor near $0.00001170 has remained intact, reinforcing confidence that a durable base is forming rather than another leg lower.

Lucky Block Builds Quiet Strength as the Next Move Takes Shape
LBLOCKUSDT – Daily Chart

Momentum indicators echo this stabilizing narrative. The RSI hovering around the neutral 50 level suggests bearish pressure has largely been absorbed, leaving room for a constructive push higher. A decisive move above the mid-band near $0.00001398 would strengthen the bullish case and could invite a gradual climb toward the upper band around $0.00001493, signaling the early stages of trend recovery.

4H Chart – The Market Holds Its Breath

Zooming into the 4-hour timeframe, Lucky Block is compressing within a tight range between $0.00001373 and $0.00001398. This orderly consolidation reflects growing market patience and often hints at accumulation by forward-looking participants. The flattening Bollinger Bands underline the idea that price is coiling, preparing for its next directional move rather than drifting aimlessly.

Lucky Block Builds Quiet Strength as the Next Move Takes Shape
LBLOCKUSDT – 4H Chart

The 4-hour RSI sitting slightly above 50 adds a subtle bullish bias, showing that buyers are quietly gaining the upper hand. A clean break above the upper band could act as a trigger for short-term momentum traders, potentially propelling LBLOCK toward the recent swing high near $0.00001828.

Conclusion – A Calm Phase With Promising Potential

Lucky Block’s current structure is defined by stability, tightening volatility, and improving momentum across both daily and intraday charts. These conditions often precede stronger moves, especially when selling pressure has already been absorbed. As this consolidation matures, LBLOCK appears well-positioned for a renewed upside phase, making this an opportune moment to keep Lucky Block firmly on the radar.

Invest wisely, and let Lucky Block’s potential work in your favor. You can purchase Lucky Block here.  Buy LBLOCK

Stellar (XLMUSD) $0.20 Holds as the Market Waits for Direction

XLM/USD Price Prediction– December 27th

Stellar (XLMUSD) is trading around $0.20 key zone, pressing against a key long-term decision zone after months of persistent downside pressure. The aggressive selling phase that followed the mid-year rally has slowed, but price has not yet shown enough strength to suggest a meaningful trend reversal.

XLMUSD Market Levels

Support Levels: $0.20, $0.10
Resistance Levels: $0.40, $0.35

COINBASE:XLMUSD Chart Image by Gaint-writerXLMUSD Long Term Trend- Bearish (Daily Chart)

From a higher-timeframe perspective, XLM remains in a clear downtrend. The sequence of lower highs and lower lows is still intact, and price is currently sitting at the lowest marked demand zone on the chart. This makes $0.21 the most important level in play right now.

What is the market outlook of XLMUSD?

The market is no longer aggressively selling, but it is also not attracting strong dip buyers. That balance creates a slow, compressed environment where patience is required and confirmation matters more than anticipation.

These levels define the broader range Stellar must work through before any trend change can be confirmed. On the daily chart, XLM remains structurally bearish. The breakdown from the upper range earlier in the year led to sustained distribution, with price gradually stepping lower rather than capitulating in one move. That type of decline often results in long basing periods rather than sharp V-shaped reversals.

COINBASE:XLMUSD Chart Image by Gaint-writerXLMUSD Short Term Trend- Bearish (4Hour Chart)

On the 4-hour timeframe, XLM is locked in a tight range between $0.20 and $0.26. Price action is rotational, with frequent back-and-forth movement and no meaningful expansion. This is typical behavior when the market is waiting for a higher-timeframe trigger.

PPO is hovering near the zero line and moving sideways, confirming that short-term momentum is neutral. MFI is also balanced, showing neither strong accumulation nor distribution.

XLM/USD Market Statistics

Current Price: $0.2080

Market Capitalization: $5.9B

Trading Volume: $120M


You can purchase Stellar here. Buy XLM

Compound (COMPUSD) Observes Consistent Pullback

Price Analysis – COMPUSD Draws towards Trendline Resistance

Compound’s price crash suddenly halted at the $23.50 region, resulting in the formation of a clear swing low on the daily chart. From that point, market sentiment shifted briefly as buyers stepped in aggressively. Consequently, the market has printed consistent and consecutive bullish daily candles, signaling a corrective ascent rather than a full trend reversal. This rebound stands out, especially within a broader bearish crypto environment.

Compound Key Levels

Demand Levels: $27.50, $20.00, $18.00
Supply Levels: $39.20, $54.70, $62.30

BITSTAMP:COMPUSD Chart Image by Nice11111Compound previously recorded an explosive rally in June, driven by a single strong displacement move. Price surged from the former demand level at $39.20 to a peak near $62.30, delivering approximately a 57% gain in one impulsive move. However, the high of that displacement established a major swing high, which later served as the anchor for a dominant bearish trendline.

Subsequently, persistent lower highs exerted pressure on the $39.20 support level until it eventually failed. Sellers maintained control and extended the bearish momentum, forcing a clean breakdown below $28.20 as well.

BITSTAMP:COMPUSD Chart Image by Nice11111Market Expectation

Although the market has recorded five consecutive days of bullish ascent, this move appears corrective in nature. Price is currently drawing toward the descending resistance trendline, which may act as a ceiling. A rejection at this zone could reinforce bearish continuation in line with the prevailing trend.

You can purchase Lucky Block here.  Buy LBLOCK

Note: Cryptosignals.org is not a financial advisor. Do your research before investing your funds in any financial asset or presented product or event. We are not responsible for your investing result.

Top Five Trending Coins for December 28: RTX, RVV, VELO, ESPORTS, SRM

This week’s list of trending markets features a wide variety of assets, reflecting mixed market sentiment across the board. While some markets are experiencing strong price surges and showing signs of bullish recovery, others remain relatively stable as they attempt to maintain balance amid ongoing pressure. Without further ado, let us delve into the analysis of each market one after the other.

RateX (RTX)

Major Bias: Indecision
The RateX market is currently attempting to recover from a period of downward price action. After bullish momentum peaked around the $4.50 price level on December 21, selling pressure emerged, pushing the market into a downtrend. As the price broke below the $3.00 level, volatility intensified as optimistic buyers clashed with sellers. However, bulls managed to establish a key rebound point near the $2.50 price level. At present, bears are defending the $3.00 resistance, causing the market to consolidate within this range. A decisive break above the $3.00 level will be critical for confirming a sustained bullish recovery.

Current Price: $2.88
Market Capitalization: $47.7 million
Trading Volume: $309.7 million

Top Five Trending Coins for December 28: RTX, RVV, VELO, ESPORTS, SRM

Astra Nova (RVV)

Major Bias: Bullish
The market is currently undergoing a strong and notable bullish recovery. This rally follows a period of consolidation that came after a bearish price move stalled around the $0.0018 level, where buyers began to step in. Initially, price action struggled to gain direction, moving sideways around this support level. However, between yesterday and today, bullish momentum surged, triggering a sharp upside breakout. The market has now entered overbought conditions, prompting a corrective pullback. With the RSI still signaling overbought levels, further correction remains possible. If this occurs, the $0.006 price level is likely to serve as a potential reentry zone for bulls.
Current Price: $0.00695
Market Capitalization: $6.93 million
Trading Volume: $46.3 million

Top Five Trending Coins for December 28: RTX, RVV, VELO, ESPORTS, SRM

Velo (VELO)

Major Bias: Bullish
The Velo market is following the broader market trend, which is recovering from a recent downtrend. However, its bullish recovery appears weaker compared to other markets. While prices have rebounded, the market is currently facing strong resistance at the $0.0075 level. Bulls have so far lacked the momentum needed to break above this critical threshold, as evidenced by the recent rejection at this level. A decisive breakout above $0.0075 is essential for the bullish recovery in the crypto signal to gain traction and continue upward.

Current Price: $0.00745
Market Capitalization: $128 million
Trading Volume: $215.8 million

Top Five Trending Coins for December 28: RTX, RVV, VELO, ESPORTS, SRM

Yooldo (ESPORTS)

Major Bias: Bullish
The Yooldo (ESPORTS) market has entered a consolidation phase after a sustained bullish run marked by continuous upward price movement. The rally stalled near the $0.500 level, where buying momentum weakened and price was rejected. Following this rejection, the market pulled back and established a near-term support around the $0.400 level. With both levels holding firm, price action has settled into a consolidation range. This behavior may signal exhaustion in the bullish trend, or it could indicate that bearish pressure is gradually building. Traders should remain cautious and prepare for either a continuation or a potential downside move.

Current Price: $0.41
Market Capitalization: $95 million
Trading Volume: $987.04 million

Top Five Trending Coins for December 28: RTX, RVV, VELO, ESPORTS, SRM

Serum (SRM)

Major Bias: Indecision
The Serum market, ranked fifth in this week’s lineup, has recorded a remarkable and aggressive price surge. Price action accelerated sharply, breaking through several key resistance levels in quick succession. The bullish recovery began in the previous daily trading session around the $0.005 level and powered through notable resistance zones at $0.010, $0.015, and $0.020. The rally peaked near the $0.025 level before undergoing a pullback toward $0.020.

Currently, price is attempting to stabilize around the $0.022 area. If bulls fail to defend this level, further retracement toward the $0.020 support zone is likely. However, if current bullish strength is maintained, the market may consolidate around the $0.020 region. Such consolidation could serve as a base for either a continuation of the upward move or a corrective phase before the next directional breakout.

Current Price: $0.02
Market Capitalization: $7.18 million
Trading Volume: $3.03 million

Top Five Trending Coins for December 28: RTX, RVV, VELO, ESPORTS, SRM

Trade crypto coins on BYBIT

Chainlink (LINK/USDT) Faces Short-Term Resistance Amidst a Weak Recovery

The market for ChainLink against Tether over the last 24 hours has risen 1.14%, operating around $12.39. These statistics show that the pair is outperforming the broader crypto market’s 0.39% gain.

As it stands, it has been identified that accumulation worth $8.5 million by the whales in the last 48 hours and ETF stability are the prominent factors that have led to a mild rebound, as the prices seem settled above the $12 support level in recent times.

Currently, ChainLink trades at $12.46, with more than 531,000 volumes at the time of writing.

Chainlink (LINK/USDT) Faces Short-Term Resistance Amidst a Weak Recovery
LINKUSDT-Daily Chart

Technical Indicators

Major Resistance Levels: $12.59, $13.03, and $13.90

Major Support Levels: $12.42, $12.20, and $11.85

Technical Analysis

Technically, on the daily chart, ChainLink against Tether has been consolidating in a relatively narrow range, with a slight bearish trend. As it stands, the recent stochastic RSI readings point to overbought conditions, suggesting a potential pullback if the price cannot break above the immediate upper limit. However, the volume displays no convincing bullish or bearish strength as the price remains under the GMMA’s long-period EMAs.

As it stands, the price needs to reclaim the $12.59 resistance; otherwise, a short-term pullback may be recorded in the coming session.

ChainLink’s Update Today

Over the weeks, nothing has really happened in the ChainLink market as the token hangs upon support around $11.85 and $12.11. As it stands, the market still awaits evidence that the bulls are taking the lead, but the activities in the market remain calm with the hope that volatility will return late Sunday or Monday for the price to grind higher.

LINK/USDT Analysis: Price Sees a Short-Term Momentum Reversal

On the 4-hour chart, LINK/USDT is showing a slight upward move with the stochastic RSI reaching overbought levels. However, the lines of the indicator in recent times seem to be indicating a possible pause or correction soon, as the lines curl downward. The price has been hovering around $12.45–$12.48, but it is still battling resistance in the $12.48 range in this timeframe.

To this end, this range may act as a ceiling for the time being, as the volume and GMMA fail to indicate a change favorable to the bulls.

Chainlink (LINK/USDT) Faces Short-Term Resistance Amidst a Weak Recovery
LINKUSDT-4H Chart


You can purchase crypto coins here. Buy Crypto

Trust Wallet Records Over $6 Million Suspected Hack

ZackXBT, a blockchain influencer, in a recent update, has shared troubling news on his Telegram channel, revealing that multiple Trust Wallet users had reported having their funds stolen.

As it stands, the influencer on this announcement has updated his followers, stating that the number of victims has grown to hundreds or even higher. To this end, he analyzed that over $6 million has been drained from the account of the users in the form of SOL, EVM tokens, and Bitcoin.

Possible Supply Chain Attack Linked to Wallet Extension Update

At the moment, the cause of the hack remains unclear, but some experts believe it could be related to a supply chain attack tied to a recent update to Trust Wallet’s browser extension on December 24.

As it stands, a user known as Akinator suggested that the update included hidden code that sends wallet data and vital information out of the user’s device. This code pretends to be analytics but actually tracks wallet activity, especially when a seed phrase is imported. This theory matches reports on social media, where users claimed that their funds were withdrawn after they entered their seed phrases into the Trust Wallet browser extension.

Trust Wallet’s Response and Recommendations to Victims

ZackXBT expressed hope that Trust Wallet would offer compensation to the victims if it is confirmed that the wallet extension is responsible for the breach. Meanwhile, security researcher Vladimir S. revealed that he had contacted a Trust Wallet team member anonymously, suggesting all Trust Wallet extensions be uninstalled to avoid further damage.

Trust Wallet Records Over $6 Million Suspected Hack

As of now, Trust Wallet has not publicly commented on these allegations. To this end, Vladimir S. has, however, stated that the team is investigating the issue and will provide updates and recommendations on the situation soon.


In order to place winning trades with us via Bybit, you can open an account here.