Chainlink Faces Rejection at $15, Risks Further Decline
Estimated Reading Time: 3 minutes
Don’t invest unless you’re prepared to lose all the money you invest. This is a high-risk investment and you are unlikely to be protected if something goes wrong. Take 2 minutes to learn more

Free Crypto Signals Channel
Chainlink (LINK) Long-Term Analysis: Bearish
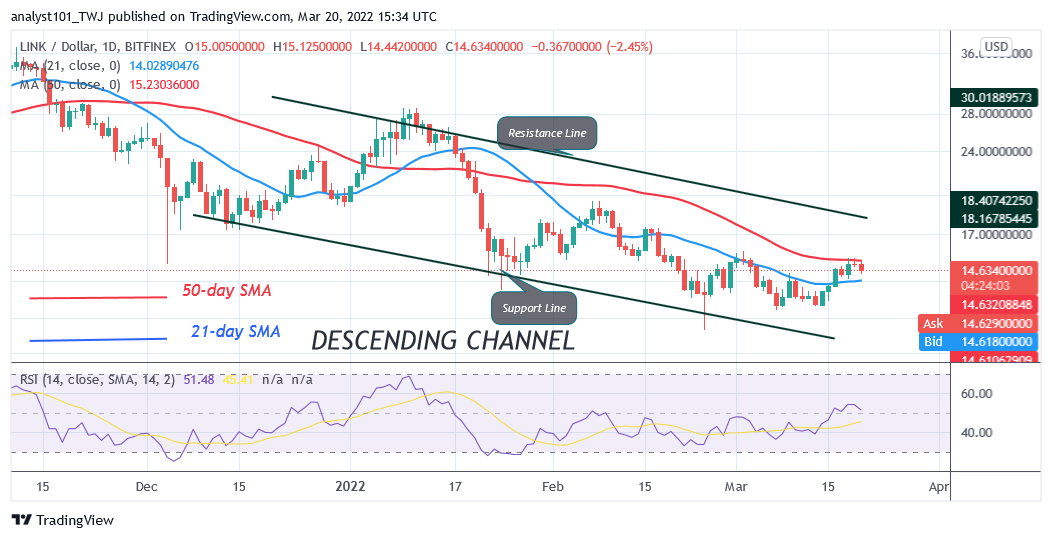
Chainlink’s (LINK) price faces rejection at the 50-day line moving average as it risks further decline. In other words, Chainlink is facing rejection at the $15 high. Since March 16, LINK/USD has been in a range-bound move between the 50-day line moving average and the 21-day line moving average. The altcoin will trend when the moving average lines are breached. For instance, if price breaks above the 50-day line moving average, the LINK price will rally above $19 high. Conversely, if the altcoin breaks below the 21-day line moving average, the altcoin will decline to $13 low. In the meantime, the LINK price is falling and has reached the low of $14.
Chainlink (LINK) Indicator Analysis
Chainlink is at level 51 of the Relative Strength Index Period 14. It indicates that there is a balance between supply and demand. The crypto’s price is in between the moving averages indicating a sideways move. Chainlink is below the 20% range of the daily stochastic.
Buyers are likely to emerge in the oversold region to push prices upward. The 21-day SMA and the 50-day SMA are sloping southward indicating the downtrend.
Technical indicators:
Major Resistance Levels – $40.00, $42.00, $44.00
Major Support Levels – $26.00, $24.00, $22.00
What Is the Next Direction for Chainlink (LINK)?
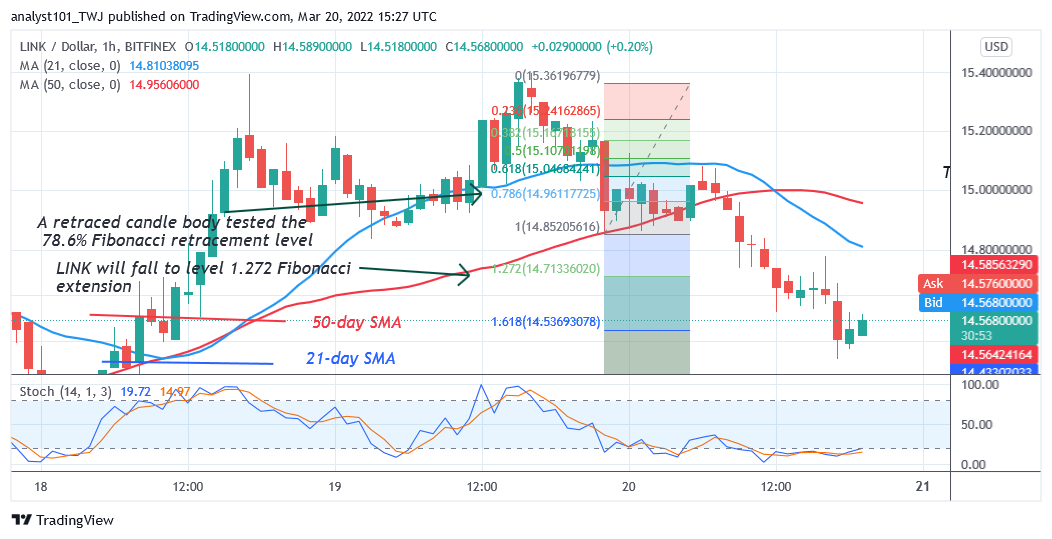
Chainlink is in a range-bound move between the moving averages as it risks further decline. The altcoin retraced to $14.44 and resumed upward. Meanwhile, on March 19 downtrend; a retraced candle body tested the 78.6% Fibonacci retracement level. The retracement suggests that LINK will fall to level 1.272 Fibonacci extension or $14.71. The market has declined to $14.44 and it is consolidating above the current support.
You can purchase crypto coins here. Buy LBlock
Note: Cryptosignals.org is not a financial advisor. Do your research before investing your funds in any financial asset or presented product or event. We are not responsible for your investing results