Quant Price Prediction: QNT/USD Slides Below $101 Level
Estimated Reading Time: 2 minutes
Don’t invest unless you’re prepared to lose all the money you invest. This is a high-risk investment and you are unlikely to be protected if something goes wrong. Take 2 minutes to learn more
Quant Price Prediction – November 27
The Quant price prediction shows that QNT is likely to create a low at $95 if the price dips more for new buyers to surface.
QNT/USD Medium-term Trend: Ranging (1D Chart)
Key Levels:
Resistance levels: $115, $120, $125
Support levels: $85, $80, $75
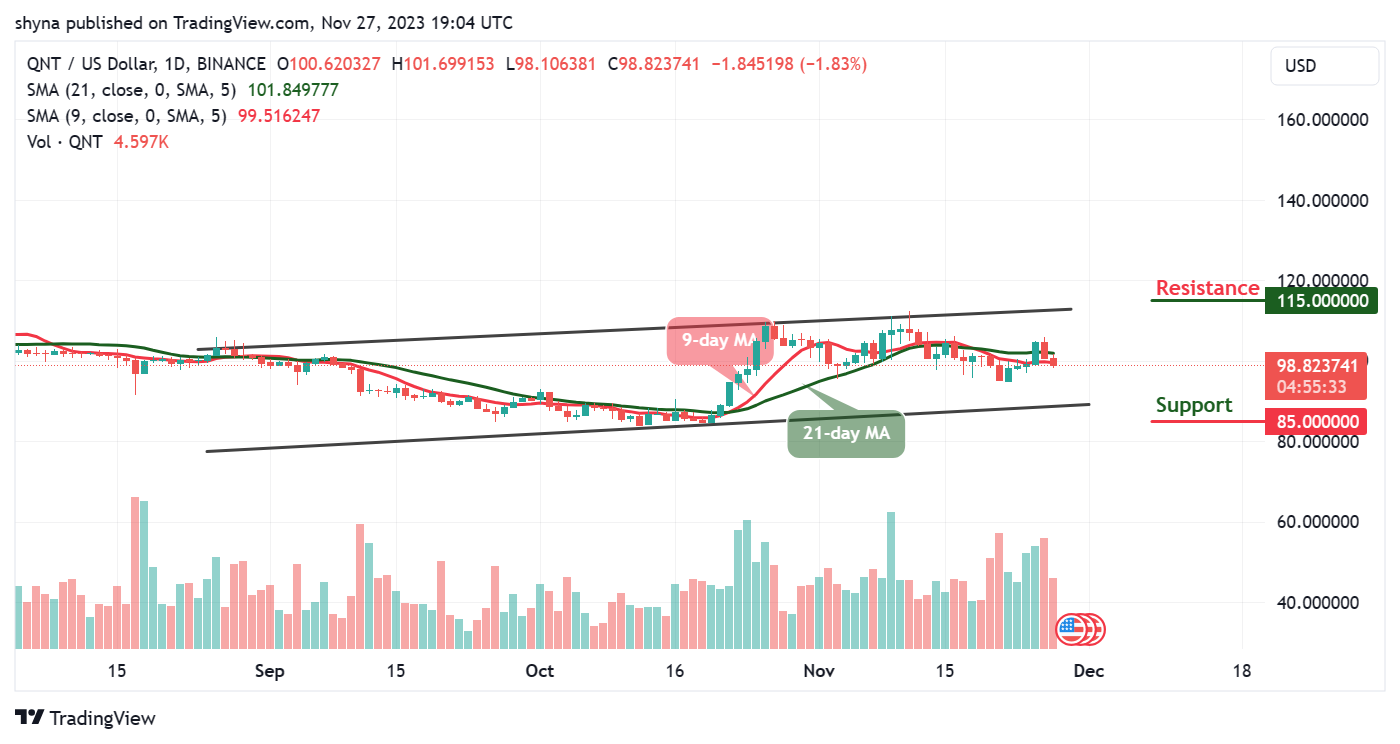
QNT/USD is currently trading at $98.8 within the 9-day and 21-day moving averages. The daily chart reveals that the sellers are bringing the coin toward the south as this could allow the new buyers to step into the market while the existing buyers are expected to buy the dips.
Quant Price Prediction: QNT Price Could Retreat
The Quant price is likely to face more downtrends, the coin may drop more as the 9-day moving average remains below the 21-day moving average. However, if the sellers increase the selling pressure, the Quant price may hit the supports at $85, $80, and $75 respectively.
However, should buyers hold the current support of $98 and push the coin higher; the bulls can expect immediate resistance to be located at $105. Any further bullish movement above the upper boundary of the channel could hit the resistance levels at $115, $120, and $125.
QNT/USD Medium-term Trend: Bearish (4-Hour Chart)
On the 4-hour chart, the Quant price remains below the 9-day and 21-day moving averages, this will allow new buyers to come into the market. Nevertheless, the existing buyers are also expected to buy the dip as the buyers gather momentum to begin a new bullish movement.
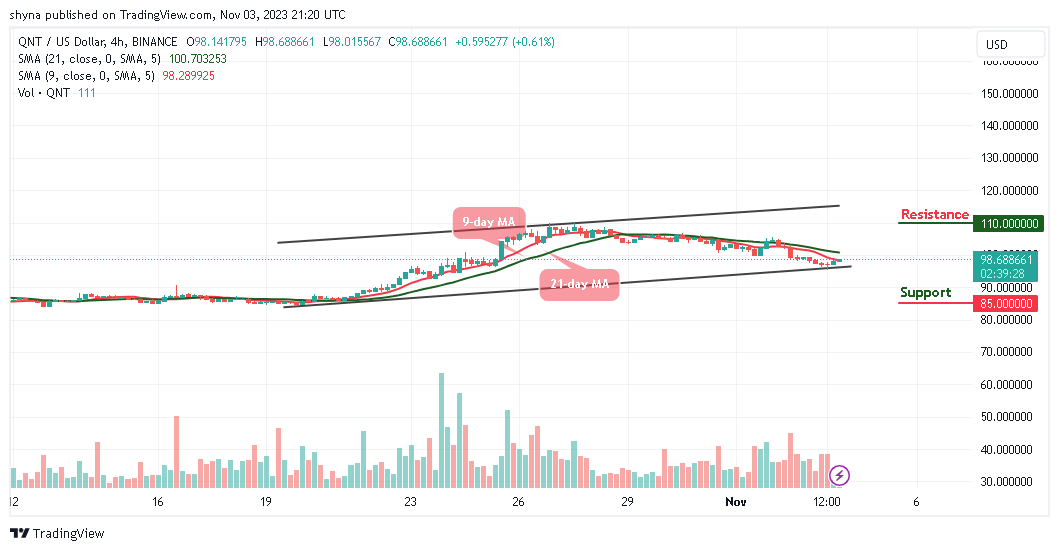
From the upside, if the buyers push the price above the 9-day and 21-day moving averages, the potential resistance level could be found at $105 and above. Moreover, should the coin slide toward the lower boundary of the channel, the critical support may come at $92 and below while the 9-day MA crosses below the 21-day MA, suggesting downward movement.
Place winning Quant trades with us. Get QNT here