Solana (SOL/USD) Price Is in Confines, Attempting a Trial Rebound
Estimated Reading Time: 3 minutes
Don’t invest unless you’re prepared to lose all the money you invest. This is a high-risk investment and you are unlikely to be protected if something goes wrong. Take 2 minutes to learn more
Solana Price Prediction – April 6
The resistance line of $200 has been seen as the major barrier that bulls have gained points against the valuation of the US Dollar to peak, given that the crypto-economic trade is in confines, attempting a trial rebound.
If additional lowering forces are required, the market would be facing the zone indicated by the horizontal line drawn beneath the lower Bollinger Band. That trade line has proven to be supportive. A price consolidation is aiming to happen around the pivot; it doesn’t seem to progress safely in the long run.
SOL/USD Market
Key Levels:.
Resistance levels: $200, $220, $240
Support levels: $150, $140, $130
SOL/USD – Daily Chart
The SOL/USD daily chart showcases that the crypto-economic price is within the range of $200 and $160, attempting a trial rebound.
The $200 and $160 marks serve as crucial trade areas where price is likely to play further in one direction or another. These are indicated by the Bollinger Band indicators. To draw attention to securing sluggish motion on the negative side, the stochastic oscillators have been moving around in the oversold area.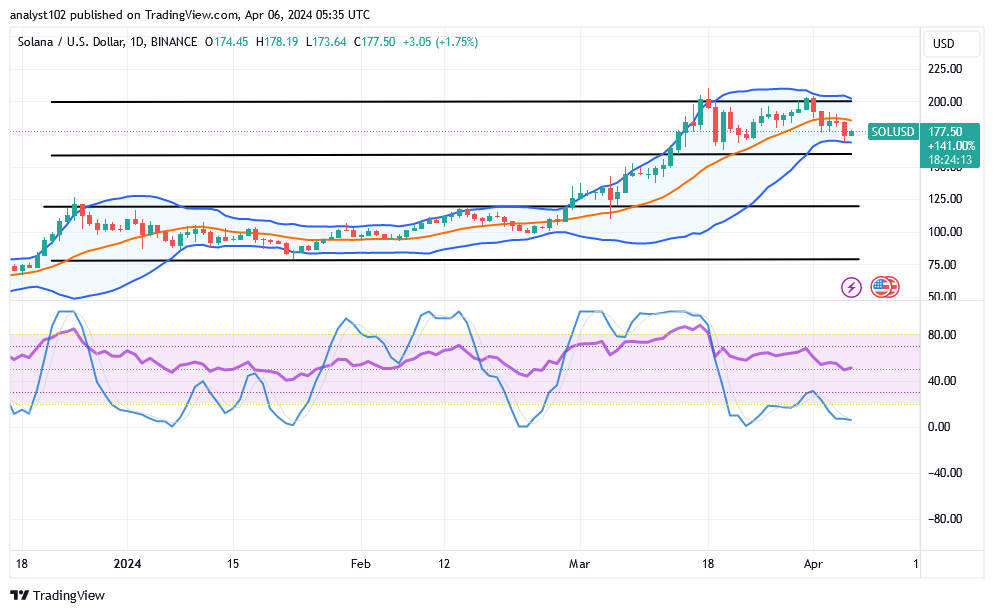
What trade style is psychologically ideal for buyers to keep in the SOL/USD market at this point?
At this point, it would be expected of long-position pushers to begin gathering points around the trend path of the lower trend, given that the SOL/USD market is in confines, attempting a trial rebound.
A closure technical outlook showcases that a line of declines has been staged to a considerable lower spot to give back the moment of graining catalysts. As it is, buyers would have to maintain a firmer footstep.
As the market has gone down through variant points to the south side to reach the line of the lower Bollinger Band, raise a warning signal note against more lows. Considering the stochastic oscillator’s positional point, sellers should be cautious about regaining points around a higher zone because moving to the south side more won’t make sustainable impulses if it ends up continuing from its current trade spot.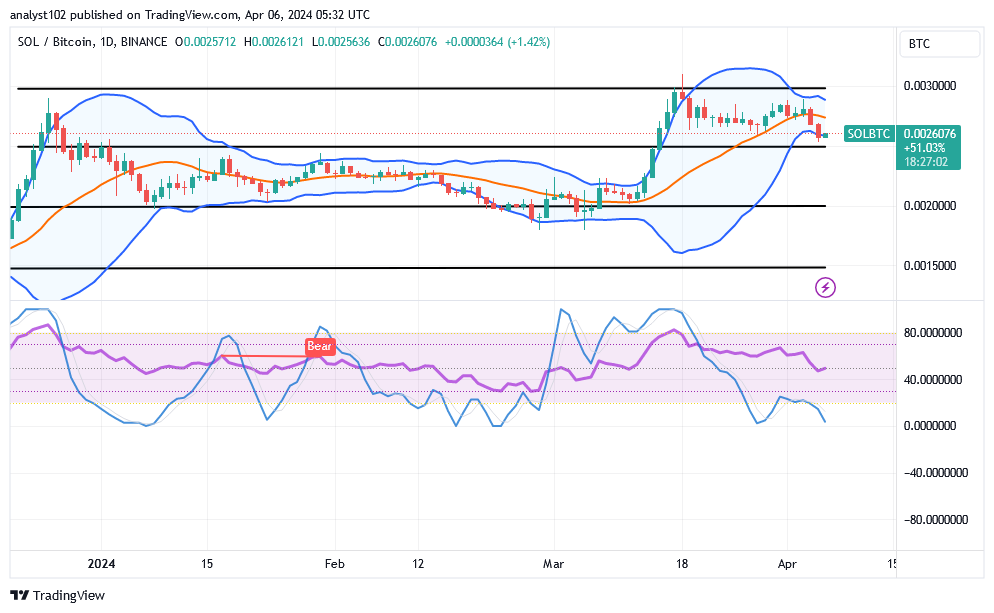
SOL/BTC Price Analysis
In contrast, the Solana market has been seen transferring to the south against Bitcoin, attempting a trial rebound around the lower Bollinger Band.
Around the bottom end, the Bollinger Band trend lines are posing an instrumental signal with a smaller bullish candlestick. To generate a cautionary note about further declines, the stochastic oscillators have been circling the oversold area.
Note: Cryptosignals.org is not a financial advisor. Do your research before investing your funds in any financial asset or presente product or event. We are not responsible for your investing results.
You can purchase Lucky Block here. Buy LBLOCK