Solana (SOL/USD) Market Is Attempting a Gradual Fall-Off
Estimated Reading Time: 3 minutes
Don’t invest unless you’re prepared to lose all the money you invest. This is a high-risk investment and you are unlikely to be protected if something goes wrong. Take 2 minutes to learn more
Solana Price Prediction – May 4
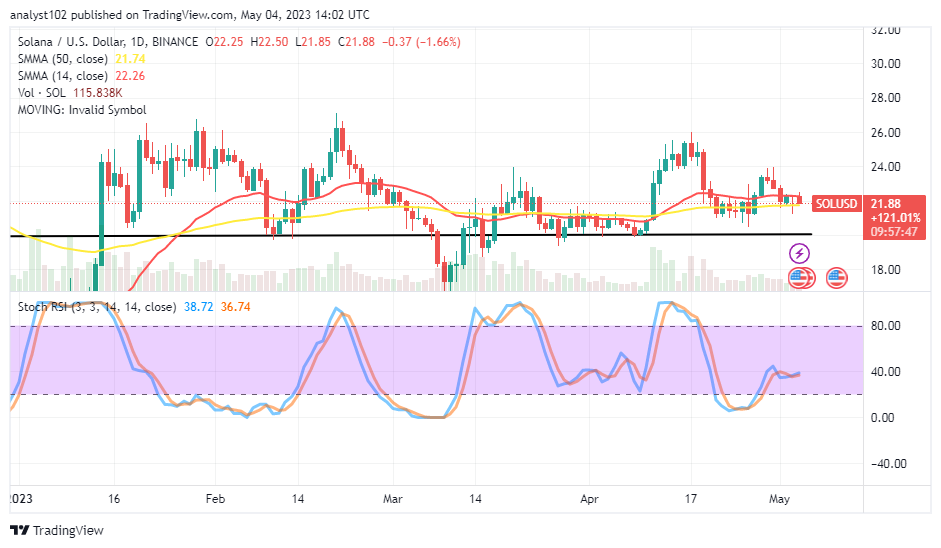
Solana market is attempting a gradual fall-off push after completing a surging journey to hit resistance around $24 in the last five days’ operations. Today’s round of transactions has witnessed high and low-value lines between $21.85 and $22.50 at an average negative percentage rate of 1.66. Buyers’ efforts have been decimating to settle for another potential rebounding upswing, possibly toward or around the support line of $20.
SOL/USD Market
Resistance levels: $24, $25, $26
Support levels: $20, $19, $18
SOL/USD – Daily Chart
The SOL/USD daily chart showcases the crypto market is attempting a gradual fall-off move around the points of the SMA trend lines. The 50-day SMA indicator’s $21.74 point gets overtaken by the 14-day SMA indicator’s $22.26. The positions maintained by the Stochastic Oscillators, following a northbound movement from the oversold region to 36.74 and 38.72 points, means the market may not remain the falling trait for long.
Should those looking to enter long positions on the SOL/USD market wait until they reach the $20 support level?
It would be that the SOL/USD market buyers open instant buy positions when detecting a complimentary situation denoting exhaustion of a bearish move as the crypto market currently attempts a gradual fall-off. The reason is that bears’ capacity may fade off in the long run if there is a continuity of intensifying decline forces. In the meantime, investors should hold on to their positions irrespective of the level of buys.
On the downside of the technical analysis, it would have been better for sellers to have joined the current bearish move instantly from the point of the 50-day SMA trend line. Joining in haste to the downside below that zone could result in an unnecessary whipsawed condition. Therefore, bears tend not to compound further even if a consolidation movement appears to surface below afterward.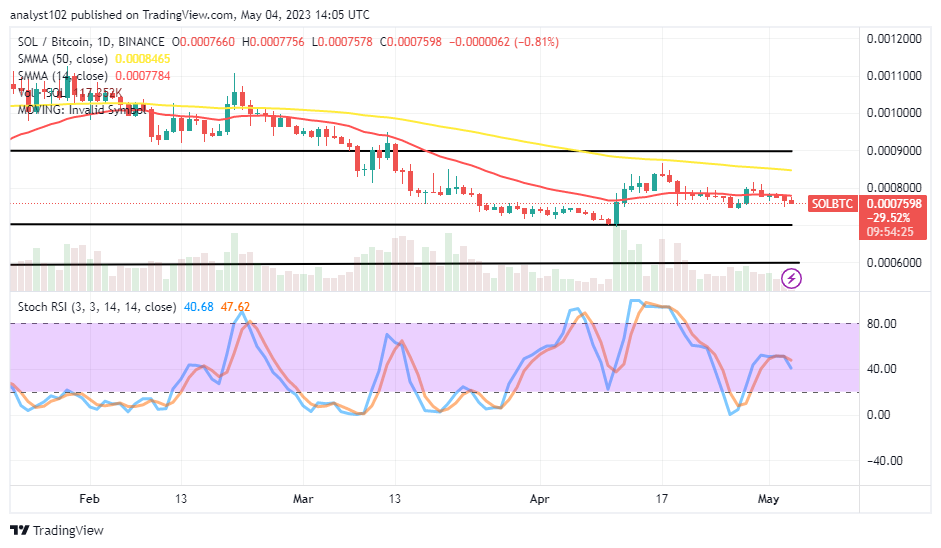
SOL/BTC Price Analysis
Contrasting the push weight of Solana with Bitcoin, presently, the base crypto is attempting a gradual fall-off session around the trend line of the smaller SMA. The 50-day SMA indicator is above the 14-day SMA indicator. And they are somewhat pointing in the east-southward direction. The Stochastic Oscillators have crossed southbound from a near higher point to 47.62 and 40.68, signaling that a decreasing moment is on course. However, the motions might not last longer than necessary before returning to an upward motion resumption.
Note: Cryptosignals.org is not a financial advisor. Do your research before investing your funds in any financial asset or presented product or event. We are not responsible for your investing results.
You can purchase Lucky Block here. Buy LBLOCK