Ethereum Is in Decline but Remains above $1,800 Support
Estimated Reading Time: 2 minutes
Don’t invest unless you’re prepared to lose all the money you invest. This is a high-risk investment and you are unlikely to be protected if something goes wrong. Take 2 minutes to learn more
Ethereum Price Long-Term Analysis: Bearish
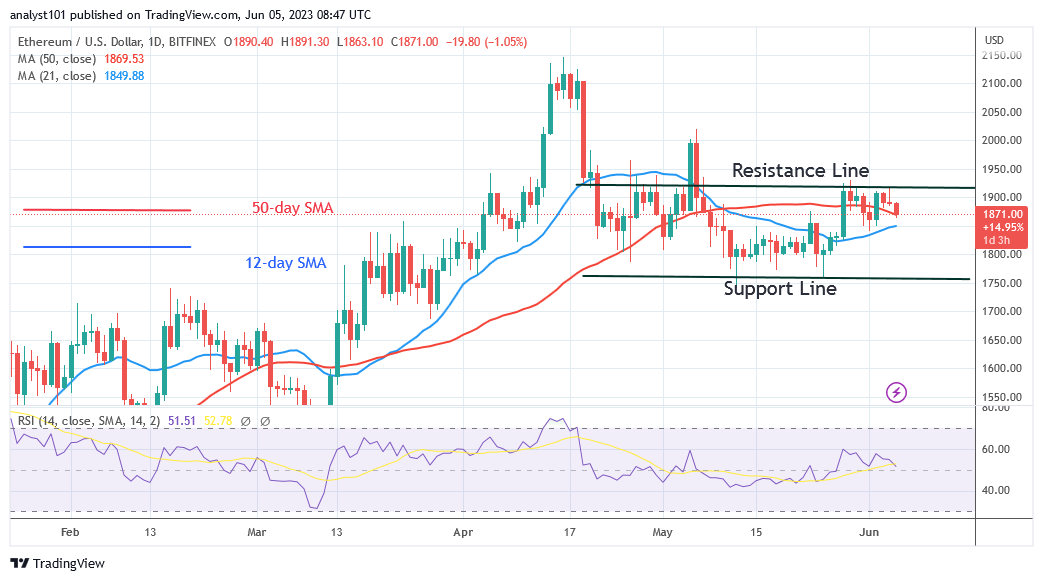
Ethereum (ETH) price is being rejected at the $1,920 barrier but remains above $1,800 support. The barrier level for the cryptocurrency’s upper range is $1,920. Buyers failed to keep the price above the resistance after four attempts. Ether has retraced to a low of $1,867.90 as of this writing. Today’s price of Ether is below its 50-day SMA. The cryptocurrency is located between the moving average lines. If the bears move below the moving average lines, selling pressure on Ether will increase once more. Just beyond the $1,750 support will be Ether’s lowest point. For Ether, though, the range-bound movement between the moving average lines might continue.
Ethereum Indicator Analysis
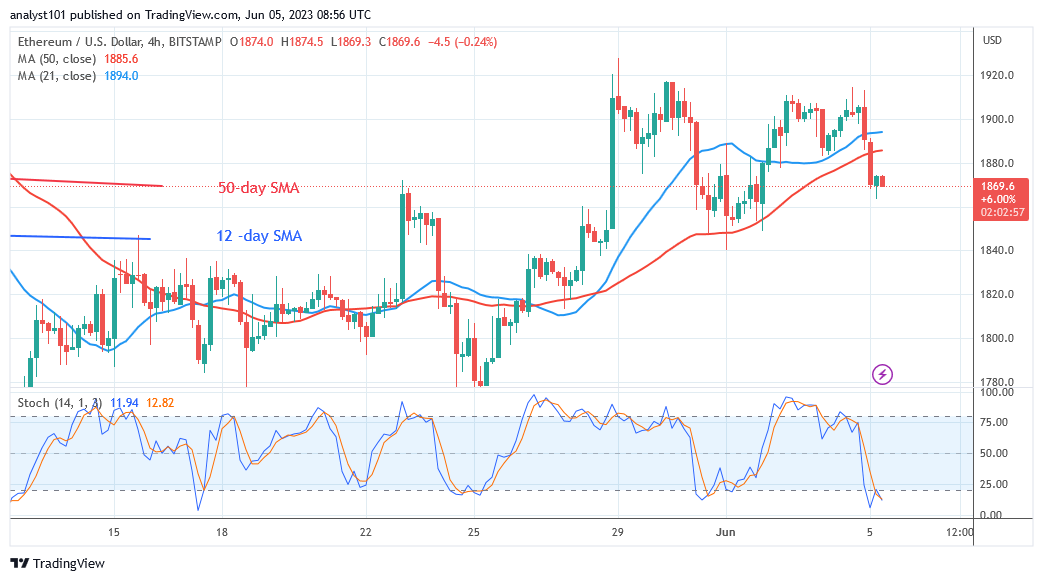
Ether has fallen to level 51 of the Relative Strength Index for period 14. As supply and demand balance, the price of the biggest altcoin has achieved its equilibrium level. The price bars have broken below the 50-day SMA, indicating a range-bound trend. Ether is in a bearish trend because it is now trading below the daily Stochastic barrier of 20. The coin’s bearishness can no longer be increased.
Technical indicators:
Major Resistance Levels – $2, 600, $2,800, $3,000
Major Support Levels – $1.600, $1, 400, $1,200
What Is the Next Direction for Ethereum?
The price of Ethereum has broken through the 21-day moving average line but remains above $1,800 support. Ether is currently falling after hitting the $1,920 resistance. The largest altcoin will resume moving sideways if the price is held between the moving average lines. If the bears breach below the moving average lines, the selling pressure will intensify until it reaches the lower price range at level $1,750.
You can buy crypto coins here. Buy LBLOCK
Note: Cryptosignals.org is not a financial advisor. Do your research before investing your funds in any financial asset or presented product or event. We are not responsible for your investing results