Chiliz (CHZUSD) Struggles as Sellers Maintain Control

CHZUSD Analysis – Chiliz Buyers Struggle to Take Over

CHZUSD struggles as sellers maintain control. Chiliz remains under heavy selling pressure, with the price dipping toward the $0.0690 key zone. Buyers have struggled to gain momentum this year, failing to break resistance at $0.1000 and facing further declines after challenging the $0.0800 level. The bearish trend remains dominant, with sellers looking to push prices even lower.

Chiliz Key Levels

Support Levels: $0.0690, $0.0650
Resistance Levels: $0.0750, $0.0800

COINBASE:CHZUSD Chart Image by Gaint-writer
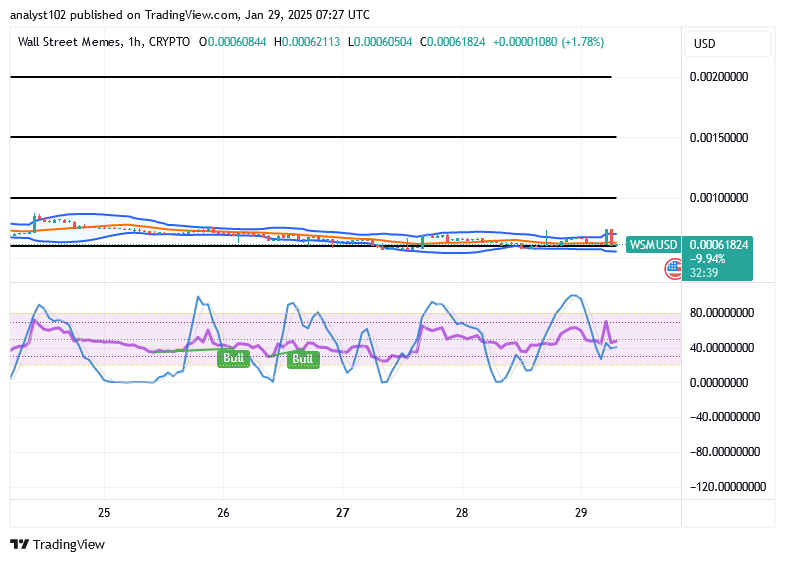
Chiliz continues to lack the strength needed for a recovery, with sellers maintaining dominance since the start of the year. The Stochastic Oscillator reflects ongoing bearish momentum, confirming that buyers have yet to regain control.

The Momentum indicator also signals a decline, suggesting that further downside pressure is likely unless buyers mount a strong comeback. If the bearish trend persists, CHZUSD could test the $0.0650 support level in the coming sessions. If the sellers maintain control, Chiliz could dip further below $0.0690, with $0.0650 acting as the next major support level.

A breakdown below this zone would reinforce the bearish outlook, potentially leading to deeper declines. For buyers to regain confidence, CHZUSD needs to reclaim $0.0750 and hold above it. Without strong bullish momentum, any recovery may be short-lived.

COINBASE:CHZUSD Chart Image by Gaint-writerMarket Expectation

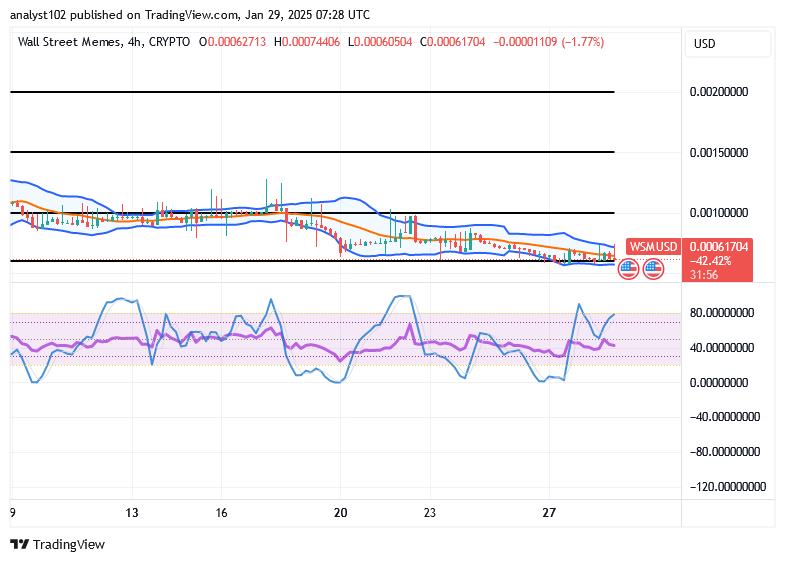
On the 4-hour chart, sellers remain firmly in control, with the Momentum indicator trending downward. The Stochastic Oscillator is nearing a bearish crossover, signalling that further declines could be imminent.

If bearish momentum continues, Chiliz could drop to $0.0670 in the short term, with additional losses possible if buyers fail to step in. A minor pullback toward $0.0720 could occur before another bearish push.
.
You can purchase Lucky Block here.  Buy LBLOCK
.
Note: Cryptosignals.org is not a financial advisor. Do your research before investing your funds in any financial asset or presented product or event. We are not responsible for your investing results

Enjin Coin (ENJUSD) Sellers Target Deeper Decline Below $0.17600 Key Levels

Enjin Analysis – Enjin Coin Faces Bearish Pressure

ENJUSD sellers target deeper decline below $0.17600 key levels. Enjin Coin faces increased selling pressure, with the price slipping below the $0.17600 support level. Bullish momentum has weakened significantly since the start of the year, and sellers appear to have regained control, threatening further declines in the market.

Enjin Key Levels

Resistance Levels: $0.20000, $0.25400
Support Levels: $0.17600, $0.15000

ENJUSD Sellers Target Deeper Decline Below $0.17600 Key LevelsEnjin Coin bulls initially attempted to rally early this year but were forced out at $0.25400. The subsequent shift in direction has led to sustained bearish momentum, with the price breaching the $0.17600 support level. With selling pressure mounting, ENJUSD is likely to continue declining, potentially targeting the $0.15000 area in the near term.

The Bollinger Band indicator highlights expanding market volatility, favoring further bearish movement. Meanwhile, the Momentum indicator shows limited buyer activity, suggesting that sellers are firmly in control. If sellers maintain their momentum, ENJUSD could drop toward $0.15000, reinforcing the bearish trend. A sustained decline below this level would indicate continued seller dominance, potentially opening the door for deeper losses.

On the other hand, buyers would need to reclaim $0.17600 as a support level to prevent further downside. However, the current market sentiment makes a significant bullish recovery unlikely in the short term.

ENJUSD Sellers Target Deeper Decline Below $0.17600 Key LevelsMarket Expectation

On the 4-hour chart, sellers continue to press the market lower, with buyers showing minimal resistance. The Bollinger Band indicator reflects widening volatility, while the Momentum indicator confirms that bearish activity remains dominant.

If bearish momentum persists, Enjin Coin could test $0.16000 in the medium term, with $0.15000 as the ultimate target. A brief consolidation near $0.17000 may occur, but this is unlikely to disrupt the broader downtrend.

You can purchase Lucky Block here.  Buy LBLOCK

Note: Cryptosignals.org is not a financial advisor. Do your research before investing your funds in any financial asset or presented product or event. We are not responsible for your investing results

Chiliz (CHZUSD) Sellers Dominate Below $0.07800 Key Level

Chzusd Analysis – Chiliz Sellers Could Mount More Pressure Lower

Chiliz sellers are gaining control, driving the price below the $0.07800 support level. Buyers have struggled to break higher, with bullish momentum stalling after targeting $0.0980 last week. The market now leans heavily toward bearish sentiment, with sellers poised to push prices lower.

CHZUSD Key Levels

Resistance Levels: $0.08500, $0.09800
Support Levels: $0.07800, $0.06050

Chiliz (CHZUSD) Sellers Dominate Below $0.07800 Key LevelThe bears have taken advantage of weak buyer momentum, driving prices down to the $0.07800 zone. Failure to maintain bullish strength above this level has opened the door for further declines, with $0.06050 acting as the next critical support zone.

The Bollinger Band indicator highlights increasing market volatility, favoring bearish expansion. Additionally, the Momentum indicator remains stable within a bearish range, signaling that sellers maintain control over market direction.

If sellers sustain their momentum, Chiliz could drop toward $0.06050 in the coming sessions. A strong bearish push would reinforce the downward trend, potentially keeping buyers out of the picture in the short term. Should buyers attempt a recovery, the market may face resistance near $0.08500, with further gains unlikely unless bullish momentum increases significantly.

Chiliz (CHZUSD) Sellers Dominate Below $0.07800 Key LevelMarket Expectation

On the 4-hour chart, sellers are maintaining dominance, with the Momentum indicator reflecting steady bearish activity. The Bollinger Band also signals room for further downward movement, suggesting that the price may continue to decline.

If bearish pressure persists, CHZUSD could target $0.07000 in the medium term, with $0.06050 as the ultimate bearish target. A brief consolidation or minor pullback may occur near $0.07500 before another downward push.

You can purchase Lucky Block here.  Buy LBLOCK

Note: Cryptosignals.org is not a financial advisor. Do your research before investing your funds in any financial asset or presented product or event. We are not responsible for your investing results

Pepe Unchained (PEPU/USD) Builds Bullish Momentum Toward $0.015

Pepe Unchained bulls appear to be gaining control at the $0.013 price level. Previous market analysis indicated that the price remained pegged around this level due to the ongoing battle between demand and supply. However, in today’s trading session on the daily chart, the market has broken out from this range and is moving upward toward the $0.015 level. This price point is a key resistance area, and a decisive break above it could further strengthen bullish sentiment, attracting more buyers into the market.

Key Levels to Watch:

  • Resistance: $0.015, $0.016, and $0.017
  • Support: $0.013, $0.012, and $0.011

Pepe Unchained (PEPU/USD) Builds Bullish Momentum Toward $0.015

Pepe Unchained Price Analysis from an Indicator Perspective

In the past few days, the market has exhibited substantial volatility, characterized by significant Pepe Unchained price swings between demand and supply. A key observation in the ongoing bullish trend is the formation of higher lows, indicating a clear ascending price action.

As the price approached the $0.015 level, resistance was triggered, leading to a rejection that prevented bullish momentum from extending beyond this level. Despite this crypto signal, buyers have maintained pressure on the key resistance zone.

In the previous Pepe Unchained analysis, the Bollinger Bands were observed to be converging, signaling declining volatility. However, with increased bullish pressure, the upper band has started to diverge upward, suggesting renewed volatility. This heightened market activity could lead to increased price oscillations, making it more challenging for bulls to sustain a breakout above the $0.015 resistance level.

Pepe Unchained (PEPU/USD) Builds Bullish Momentum Toward $0.015

Short-Term Outlook for PEPUUSD: 1-Hour Chart

The bullish momentum appears consistent in the smaller timeframes. However, bearish pressure at the $0.015 level has resurfaced as the price reaches this critical resistance zone. With the market now at a crossroads, a decisive breakout above $0.015 is essential for further bullish continuation.

Although there was a brief breakout above this level during today’s trading session, profit-taking by traders has caused the price to retrace back to $0.015. Notably, the presence of a gravestone doji in the ongoing session suggests a potential market correction. However, the formation of higher lows continues to position the market for a possible breakout and further upward movement.

Buy PEPU!

Buy and stake NOW on the L2 for DOUBLE staking rewards! Pepe Unchained (PEPU)

XRP’s Rise: Challenging Ethereum’s Crypto Dominance

XRP’s meteoric rise continues, with the cryptocurrency surging more than 12% in the recent trading session to attain a  new high of $3.4. At the moment, profit-taking activities have caused the market to retrace backward from the hige to find stability near the $3.0 support level. This remarkable surge has propelled XRP’s market capitalization to around 42.6% of Ethereum’s, fueling speculation about a potential shift in the cryptocurrency landscape.

XRP Challenges Ethereum’s Market Dominance Amid Growing Momentum

For years, the crypto community has speculated about Ethereum (ETH) surpassing Bitcoin (BTC) or Solana (SOL) overtaking Ethereum. While these shifts have yet to occur, a new contender is making waves—XRP is steadily gaining traction in its bid to challenge ETH’s dominance.

Currently trading at $3.06, XRP holds a market capitalization of $177 billion, standing at approximately 47% of Ethereum’s $385 billion valuation. To surpass ETH, XRP would need an addition of more than $221 billion in market cap. With 57,493,120,449 XRP in circulation, the asset remains about 18% below its all-time high, signaling room for potential growth.

As XRP continues its upward trajectory, market observers are closely watching whether it can disrupt Ethereum’s position in the rankings.

XRP's Rise: Challenging Ethereum’s Crypto Dominance
Source: create.vista.com

XRP’s Road to the Top: Can It Reclaim Its Former Glory?

XRP last reached its all-time high on January 7, 2017, nearly seven years ago, when it traded at $3.40 per coin. However, even at that peak, it remained behind Ethereum (ETH) in market capitalization. For XRP to surpass ETH—assuming Ethereum’s price and circulating supply remain unchanged—it would need to surge by 133.5% against the U.S. dollar, bringing its price to approximately $6.70 per token.

Interestingly, XRP once held the position of the second-largest cryptocurrency by market cap, before being overtaken by Ethereum (ETH) and Tether (USDT). In August 2013, XRP was ranked third with a market cap of $47.71 million. By September 22, 2013, it had climbed to second place, boasting a valuation of $100.59 million.

As XRP continues to gain momentum, the question remains—can it reclaim its former status in the crypto market?

XRP’s Market Battle: A History of Ups and Downs

During the 2013 bull market, Litecoin (LTC) managed to surpass XRP by year’s end, holding onto that position well into 2014. It wasn’t until October 2014 that XRP reclaimed its second-place ranking, reaching a market cap of $138.81 million while trading at just $0.004789 per coin. However, with Ethereum’s rise and the explosive 2016–2017 bull run, XRP once again lost its second-place standing and has yet to reclaim it. For much of its early history, XRP traded for less than a single U.S. cent.

Despite past setbacks, XRP’s progress toward narrowing the gap with Ethereum underscores its growing market presence. While overtaking ETH remains a significant challenge, XRP’s sustained momentum suggests that competition among top cryptocurrencies could become even fiercer. As the crypto landscape continues to evolve, XRP’s trajectory will remain a key point of interest for both investors and market analysts.

Trade crypto coins on BYBIT!

IMPTUSDT Price: Double Bottom Chart Pattern at $0.0047 Position

Buyers are getting ready take over

IMPT (IMPTUSDT) Price Analysis – January 29

The critical support level of $0.0047 may be broken lower and the lows of $0.0045 and $0.0043 may be hit if sellers add more assets. The $0.0049 resistance level can be broken higher, challenging the $0.0052 and $0.0055 levels, as buyers gain momentum in IMPTUSDT market.

IMPTUSDT Market

Key Levels:

Resistance levels: $0.0049, $0.0052, $0.0055

Support levels: $0.0047, $0.0045, $0.0043

IMPTUSDT Long-term Trend: Bullish

Despite having influence over IMPT, sellers are opposing the upward trend. At the $0.0067 resistance level, the price reached its top. For a few days, the price stays at the same level. The price breached the $0.0065 and $0.0055 support levels as the bears grew more powerful. It retested the $0.0055 after pulling back. On January 9, the price broke through the $0.0052 support level and challenged the $0.0049 support level. Despite the price decline, it is currently attempting to break over the predetermined level of $0.0049.

IMPTUSDT Price: Double Bottom Chart Pattern at $0.0047 Position

The market is dominated by buyers, according to the daily chart. On the daily chart, the price movement has resulted in a double bottom pattern. Right now, the cost is going down. The critical support level of $0.0047 may be broken lower and the lows of $0.0045 and $0.0043 may be hit if sellers add more assets. The $0.0049 resistance level can be broken higher, challenging the $0.0052 and $0.0055 levels, as buyers gain momentum. A buy signal is indicated when the QQE MOD’s histogram is greater than zero.

IMPTUSDT Medium-term Trend: Bullish

The 4-hour chart pattern indicates that IMPT is performing nicely. On the 4-hour chart, the bears have been exerting pressure on the cryptocurrency’s performance. Following the long-term consolidation breakthrough. The cost keeps going up. On December 12, the $0.0065 resistance level was examined. The gain was stopped by the sellers’ drive, and it is now testing the $0.0049 level.

IMPTUSDT Price: Double Bottom Chart Pattern at $0.0047 Position

The price is trading below the Hull suite crypto signal, suggesting that sellers are in charge. The QQE MOD indicates a sell signal when it falls below the zero threshold.

Buy IMPT token on Exchanges!: IMPT (IMPT)

Happy International Day to Reduce CO2 Emissions!


Sonic (S/USD) Eyes Strong Rebound as It Nears $0.40 Support

Fantom (FTM) completed its transition to Sonic (S) on January 16, 2025. Leading up to this transition, FTM’s price experienced significant volatility. In December 2024, the token reached a high of $1.40. However, by January 13, 2025, just days before the transition, the price had declined to $0.64, representing a 54% decrease.

Following the transition, the newly rebranded Sonic (S) token continued to face downward pressure. By January 21, 2025, S was trading at approximately $0.57, marking a further decline.

Sonic Market Data

  • S/USD Price Now: $0.46
  • S/USD Market Cap: $1.3 billion
  • S/USD Circulating Supply: 2.88 billion S
  • S/USD Total Supply: 3.17 billion S
  • S/USD CoinMarketCap Ranking: #68

Sonic (S/USD) Eyes Strong Rebound as It Nears $0.40 Support

Key Levels

  • Resistance: $0.50, $0.60, and $0.70
  • Support: $0.40, $0.35, and $0.30.

The Sonic Market Through the Lens of Indicators

On January 16, 2025, when the Sonic market fully transitioned to Sonic (S), it experienced significant volatility, reaching an unprecedented high. Within the first four hours of trading, bullish momentum drove the price to a peak of $2.00 before a sharp correction set in. However, buying interest emerged around the $0.70 level, briefly stabilizing the decline.

Despite attempts by bulls to sustain the price at this level, selling pressure gradually intensified, leading to a continued downtrend. The current bearish movement is unfolding gradually rather than sharply, as market participants remain locked in a battle between bullish and bearish forces.

Over an extended trading period, the price has steadily drifted toward the $0.40 mark, though it has yet to reach this level. A resurgence in bullish sentiment at this stage could set the groundwork for a recovery. If the market finds support at $0.40, a rebound toward the $0.70 price level may soon materialize.

Sonic (S/USD) Eyes Strong Rebound as It Nears $0.40 Support

S/USD Price Prediction: 1-Hour Chart Analysis

A closer look at the Sonic market from a smaller timeframe reveals an ongoing struggle between demand and supply. However, at certain intervals, the bears gain the upper hand, driving prices lower. The market’s gradual decline suggests that a significant number of traders are still holding a bullish bias, preventing a sharp sell-off.

It appears that the crypto signal is awaiting a test of the $0.40 price level before a potential rebound. Given the current price action, it is likely that the downtrend will persist toward $0.40 before a recovery attempt takes place.

Trade crypto coins on BYBIT!

$SPONGE (SPONGE/USD): Testing the Depths

The $SPONGE (SPONGE/USD) market is currently locked in a fierce battle between bullish and bearish forces. The $0.000024 level has emerged as a critical support zone, a psychological anchor resisting the downward pressure from sellers. While sellers have recently intensified their efforts, pushing prices deeper into bearish territory, the resilience of this support level suggests that bulls may yet regain control. The $0.000024 level has proven to be a pivotal point in the market’s trajectory, and its ability to hold could be a crucial factor in determining the future direction of the $SPONGE price.

Key Market Dynamics:

  • Resistance Levels: $0.00005, $0.000055, $0.000060
  • Support Levels: $0.000020, $0.0000195, $0.000019

$SPONGE (SPONGE/USD): Testing the Depths

$SPONGE (SPONGE/USD) Technical Analysis

The SPONGE/USD market appears to be entering a period of increased volatility after a period of relative stability where price action was confined around the $0.000024 level. This consolidation phase was characterized by a significant narrowing of the Bollinger bands—a phenomenon known as a “volatility squeeze,” which often precedes dramatic price movements. While a breakout appears to be underway, the direction of this volatility remains uncertain. While bears may have initially gained momentum, they may encounter resistance from a prior support level held by bulls at the $0.000020 price level, potentially hindering their ability to sustain a significant downward move.

$SPONGE (SPONGE/USD): Testing the Depths

$SPONGE (SPONGE/USD) 1-Hour Chart Observations

In the previous analysis, the price was noted to be near the $0.000026 level, but subsequently declined back to the critical support level at $0.000024. While the bearish price action following this decline appeared strong, bulls have demonstrated resilience in defending the $0.000024 support. The market may experience a rebound in the next trading session due to the lack of significant trading volume to sustain the current bearish momentum. With bullish sentiment evident around the $0.000024 support level, a rebound from this level in the next trading session is a possibility.

Buy $SPONGE!

Join the SPONGE community and be part of the next big crypto sensation! Buy Sponge ($SPONGE) today!

Wall Street Memes (WSM/USD) Trade Inactive, Waxing Spirals

Wall Street Memes Price Prediction – January 29

So much effort is put into the long-term position movers that they have been trying to make stances to get over the lowly declines in the business activities that make Wall Street Memes coin the base to the valuation of the American fiat money, as the financial trade level shows that the price is inactive, waxing spirals at a negative spot.

The technical setup for the WSM/USDUSD market is denoting a high-probability scenario in which the moves, after exhausting their downward pace, will experience a strong rebound. In the interim, the oscillators suggest a tentative overbought market condition that could mean that buyers may see a pause before the trade is set for a potential recovery. A reversal from the $0.0006 and $0.0005 price levels would align with the broader market psychology, making those axes key points of interest for those looking to capitalize on the next upward price journey.

WSM/USD Market
Key Levels
Resistance levels: $0.0012, $0.0017, $0.0022
Support levels: $0.0005, $0.0004, $0.0003

WSM/USD – 4-hour Chart

The WSM/USD market 4-hour chart showcases that the crypto-economic market is inactive, waxing spirals in inputs.

A modest downward arrangement has been built up to demonstrate that the Bollinger Bands’ trend lines may be approaching a maximum point, indicating a crucial condition against obtaining a superior bargain to execute new shorting orders. Indicating that capitalists are preparing for big, gigantic pushes soon, the stochastic oscillators are observed veering via varied points toward the overbought area.
Wall Street Memes (WSM/USD) Trade Inactive, Waxing Spirals

Will there be consistent downward swings after the many attempts to touch the lower Bollinger Band, given that the WSM/USD market is now trading at about $0.00061704?

A line of reversals has been made mostly as the WSM/USD market touches the lower trend line of the Bollinger Bands to signify that buyers are in top shape of continued securing of dip buys, as the WSM/USD market is said to be inactive, waxing spirals in inputs at the time of this write-up.

Aligning with a longer-term outlook sentiment, the present market conditions represent a tactical opportunity to continue to enter longing orders, particularly the levels, which are positioned as critical support zones. These levels serve as a psychological threshold for market participants, and a successful test of these areas could trigger a substantial buying response.
Wall Street Memes (WSM/USD) Trade Inactive, Waxing Spirals

WSM/USD 1-hour chart

The 1-hour chart showcases that the WSM/USD market is inactive, waxing spirals in inputs at lower ends.

The Bollinger Bands’ trend lines have consistently stayed extended eastward, confirming that the downward swings are a little more under pressure. From the standpoint of hourly settings, the stochastic oscillators have been consistently swinging north and south based on bullish signal notes.

I’m beginning to realize the benefits of Deepseek.

Buy and stake WSM now!: Wall Street Meme (WSM)