Grayscale Expands Crypto Investment Options with Miners ETF

Grayscale, one of the giants in the investment management field, in grand style has injected into the list of growing crypto services the Bitcoin Miners ETF, also known as the MNRs ETF. The intent of this option is to offer investors more knowledge about a firm’s activities in the mining industry.

It is important to note that this ETF is based on the Indxx BTC Miners index; this helps to monitor firms generating income from mining, hardware, software, and other infrastructural services. To this end, it does not relate to investing in cryptocurrency directly but helps to provide choices for investors looking to gain knowledge of the workings of the sector without holding any digital assets.

Grayscale’s Growing Influence on the Crypto ETF Market

Grayscale remains one of the prominent players in extending the frontier of digital asset investment. The newly introduced MNRs ETF is designed to assist investors in gaining good insight into the price movement of the major crypto, especially Bitcoin, through mining-related firms. Additionally, this fund does not assist in investing directly into the digital world, derivatives, or give ICO. Instead, it provides exposure to the unique attributes of the mining ecosystem and offerings of the market.

Grayscale Expands Crypto Investment Options with Miners ETF

To this end, the firm is sustaining its dominating force in terms of the crypto landscape, even in the face of stiff competition. Moreover, despite the market position of the firm behind BlackRock’s IBIT and Fidelity FBIC in the BTC ETF ranking, Grayscale’s current innovation points to the firm’s commitment to building a strong link between Traditional Finance (TradFi) and Decentralized Finance (DeFi).

Extending Product Offerings and Future Outlooks

Aside from the introduction of MNRs, the company has been working relentlessly to expand its range of investment options. Grayscale has applied for a spot Litecoin ETF, awaiting approval ahead of other altcoin ETFs. Also, the company expects Solana ETF to add to its range of products in the near term, reflecting the business interest in the other choices provided by the Blockchain system.

However, beyond ETFs, the firm has recently introduced 40 new digital assets. These include AI and meme tokens in its range of products. The firm has also expanded access to Horizen Trust (HEZEN), removing exclusive access to institutional investors alone.

To further diversify its offerings to the public, the firm has launched new trusts for Stellar (XLM), Lido DAO, and Optimum, reinforcing its commitment and consistency in the digital assets world.


In order to place winning trades with us via Bybit, you can open an account here.

Wall Street Memes (WSM/USD) Price to Hike, Holding Ground

Wall Street Memes Price Prediction – January 30

In a bid of the principles of continuity, the Wall Street Memes has been seen letting to experience a feeble line of declines versus the pushing force of the US Dollar, as the crypto business price is settling to hike, holding ground.

With a confirmed bullish signal from the oscillators, it is plausible that the underlying asset is positioning itself with the necessary catalysts for a rapid recovery. From a psychological perspective, this presents an opportune moment for long-term investors to continue accumulating positions, capitalizing on potential rebounds despite prevailing market conditions.

WSM/USD Market
Key Levels
Resistance levels: $0.0012, $0.0017, $0.0022
Support levels: $0.0005, $0.0004, $0.0003

WSM/USD – 4-hour Chart

The WSM/USD market 4-hour chart reveals that the crypto-economic market is getting ready to hike, holding ground.

At the time of this piece, most of the indicators have compressed southward to considerable lower spots portending that the falling movements are on the verge of ending soon. As a result, it is now observed that the trend line of the Bollinger Band is positioned around $0.0006 or thereabouts with variant promissory price actions. The stochastic oscillators are already southbound-placed in the oversold region, portending a signal note to cease a further fall.
Wall Street Memes (WSM/USD) Price to Hike, Holding Ground

Is it an opportune time for short-term buyers to enter the WSM/USD market based on the current technical setup?

It is an opportune cycle for short-term purchasers to begin entering positions in the operations of the WSM/USD market, given that the crypto-economy has been more closely observed getting steady to hike, holding ground.

It is now highly probable that bulls will regain control near the $0.0006 price level in the near term. From a technical standpoint, it is advisable for traders, particularly those with a short-term outlook, to refrain from using large lot sizes when initiating positions, ensuring proper risk management during this phase of market uncertainty.
Wall Street Memes (WSM/USD) Price to Hike, Holding Ground

WSM/USD 1-hour chart

The 1-hour chart mirrors that the WSM/USD market is preparing to hike, holding ground.

From a technical perspective, as indicated by the hourly chart structure, the stochastic oscillators have maintained their oscillatory movement across varying levels, exhibiting bullish momentum. Meanwhile, the Bollinger Bands are reflecting an expanded range, suggesting that the market is likely to experience continued consolidation or sideways movement in the near term.

Trump Issues Executive Order to Transition from the Year of the Snake to the Year of the Eagle.

Buy and stake WSM now!: Wall Street Meme (WSM)

Uniswap (UNI) Price Prediction: UNI/USDT May Have Found New Support

Uniswap (UNI) Price Prediction: January 30

The Uniswap token shows a notable correlation with the Bitcoin market. This is because BTC has been declining, breaching medium-term support levels in recent sessions. However, with Bitcoin breaking above the $105,000 ceiling, UNI has followed suit, retracing toward higher price levels.

UNI/USDT Long-Term Trend: Bullish (Daily Chart)

Key Price Levels:

Resistance: $13.00, $14.00, $15.00

Support: $11.00, $10.00, $9.00

Uniswap (UNI) Price Prediction: BTC/USDT May Have Found New Support

An upside retracement appears to have begun in the Uniswap market over the past two sessions. The current session has extended this trend, pushing UNI’s price higher. As a result, the latest price candle has brought the market closer to testing the 100-day Moving Average (MA) line as a resistance level. At the same time, the Stochastic Relative Strength Index (RSI) lines are rising toward higher levels after emerging from the oversold zone.

Uniswap (UNI) Price Prediction: Poised to Advance Beyond the $12.00 Threshold

Price action in the Uniswap daily chart recently dipped below the $12.74 level, which had served as strong support in previous sessions. However, buyers quickly stepped in when the price tested support around $11.00. This resulted in a swift rebound, pushing UNI back above the $12.00 price mark.

The Stochastic RSI indicator further supports this bullish movement, as its lines are now rising out of the oversold region. Additionally, the latest price candle shows an upper shadow, indicating that buying pressure is still present in the session. Given these factors, UNI appears positioned for further gains in the near term.

Uniswap (UNI) Price Prediction: Uniswap Crosses a Medium-Term Technical Landmark (4-Hour Chart)

Uniswap’s 4-hour chart remains bullish, with the latest price candle nearing a key technical level at $12. This movement has also placed UNI above the 50-day MA line. Furthermore, the Stochastic RSI indicator recently formed a bullish crossover above the 80 level, with the lines continuing to trend upward.

Uniswap (UNI) Price Prediction: BTC/USDT May Have Found New Support

Market indications suggest that Uniswap has a strong foundation to extend its rally. The breakout above the 50-day MA signals growing bullish momentum, while the Stochastic RSI trajectory confirms the presence of upward pressure. As a result, the market seems to be heading toward the $12.50 price level and potentially higher.

Get Uniswap here. Buy UNI 

Scotty The Ai Price Prediction: SCOTTYAIUSD Price Reverses as It Starts to Increase

Scotty The Ai Price Prediction – January 30

The Scotty The Ai price pair saw a significant correction today. The crypto reverses as the price starts to increase, with emerging reversal patterns and growth following the pioneer digital asset Bitcoin surge above $102k. The cryptocurrency is rising after signaling a pump at the low level of $0.0012. Consequently, if the crypto makes an intense rally from its present price at the $0.0014 supply value above the moving average line, it will enter a bullish trend. Hence, the buy traders may see immediate gains if this advance extend to the $0.0029 resistance area, fueling the surge in the coin price.

Technical indicators:
Key Resistance Levels: $0.0018, $0.0019, $0.0020
Key Support Levels: $0.0010, $0.0009, $0.0008

SCOTTYAI/USD Long-term Trend: Bearish (Daily Chart)

The Scotty Ai pair shows strength as it reverses and increases below the supply, indicating a bearish trend pattern in its higher time frame. The coin is trading below the EMA-50, confirming its bearish trend.
Scotty The Ai Price Prediction: SCOTTYAIUSD Price Reverses as It Starts to Increase
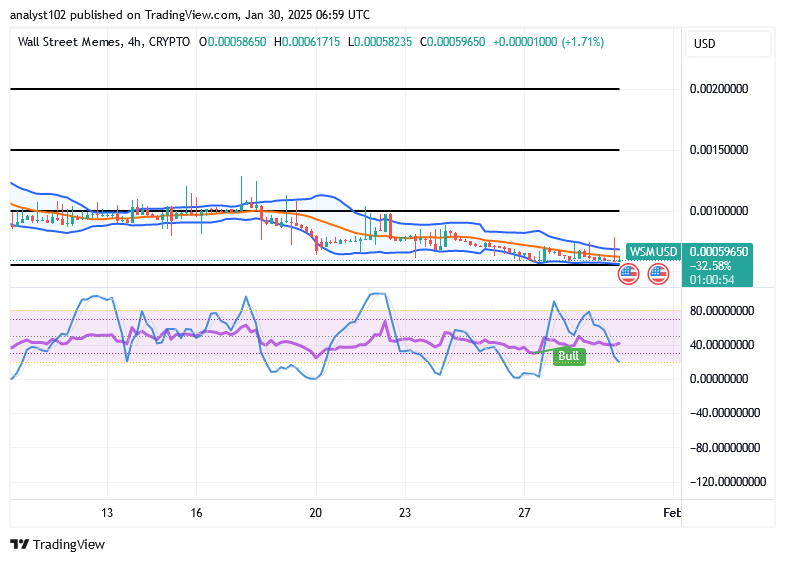
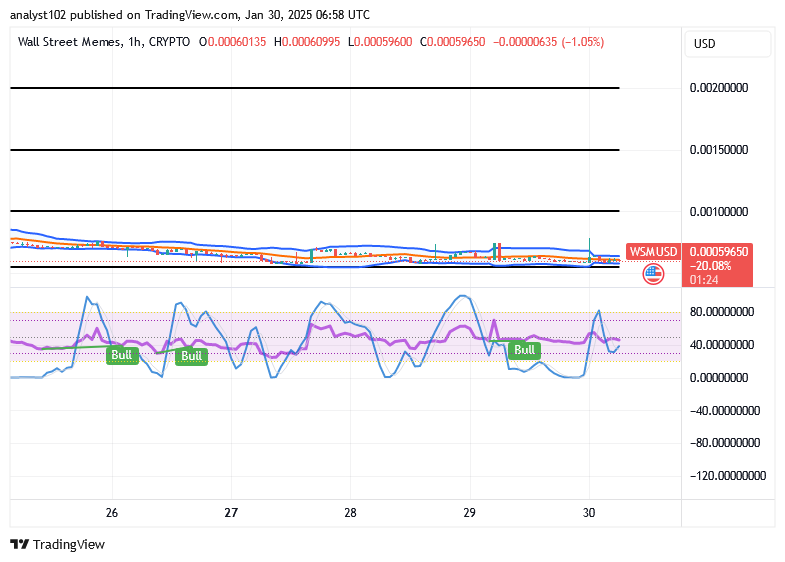
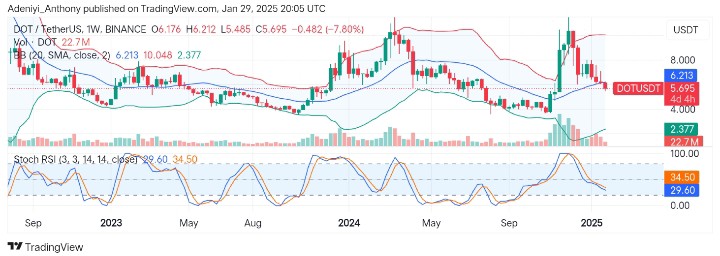
The sustained bearish pressure at the $0.0012 support value in the last session has caused the coin price to drop below the supply levels and start to increase in its recent price level.

At press time, the SCOTTYAIUSD price reversed and increased to the $0.0014 high value below the EMA-50 as the daily chart opens today, demonstrating remarkable resilience in a correcting market.

Thus, if the bulls raise their level of market tension, the price tendency will climb over the crucial levels to hit the $0.0029 resistance, footing the potential for further increase.

Additionally, Scotty, the AI price is up on the daily stochastic, suggesting a further increase in the coin price.

Hence, as the SCOTTYAIUSD price reverses and starts to increase, if buyers can break above the $0.0029 previous supply trend line, the market participants may witness a new recovery rally to the $0.021 upper high mark in the coming days as the price reverses and starts to increase in its long term forecast.

SCOTTYAI/USD Medium-term Trend: Bearish (4H Chart)

The Scotty Ai price reverses and starts to increase after a recent dip below $0.0012 as the coin selling pressure is winding up in its medium-term outlook. The coin price is below the supply levels, indicating a bearish market.
Scotty The Ai Price Prediction: SCOTTYAIUSD Price Reverses as It Starts to Increase
The bears’ pressure at a $0.0011 low value in the last few hours has dropped SCOTTYAIUSD’s price beneath the supply trend lines in its recent price level.

The Scotty Ai price reverses and starts to increase to the $0.0014 supply level beneath EMA-50 as the 4-hourly chart resumes today, suggesting a renewed surge in buyers’ interest. Nevertheless, traders might seize this opportunity to invest in the coin at a lower rate for more gains.

Meanwhile, with sustained investors’ enthusiasm, the crypto price could reach as high as the $0.0024 resistance level, indicating a strong possibility for a bullish correction.

Furthermore, the SCOTTYAIUSD pair could experience an increase as the market rises up on the daily stochastic, indicating a possible increase in the near term.

As a result, a breakout above the resistance level to reach the $0.0029 high level might be possible soon and expose further to a $0.0210 upper high level in the days as it starts to increase in its medium-term outlook.

With our income share for partners, you can help the https://x.com/scottythe_ai team while maximizing the value of your tokens without any slippage, buy/sell tax, or chart impact!

🐙 OTSea x Scotty AI 🤖


Trade $SCOTTY now on OT Sea, OTC platform!

Maximize the value of your tokens with no slippage, no buy/sell tax, and no chart impact, all while supporting the https://t.co/lu5zLuaVrU team with our revenue share for partners!

Scotty Ai is an innovative… pic.twitter.com/NnYJBq3wwQ

— Scotty The Ai (@ScottyThe_Ai) January 28, 2025

$SCOTTY claim is now live! Stake your claimed tokens below to earn rewards!

ApeCoin (APE/USD) Extends Bearish Momentum Amid Key Support Test

Price Analysis: APEUSD Resumes Its Bearish Trend, Testing the Critical $0.900 Support Level

ApeCoin has resumed its broader bearish trend following a failed bullish reversal, leading to sustained downward pressure. Throughout April 2024, the asset exhibited a pronounced bearish trajectory, marking consistent declines.

APEUSD Key Levels

Demand Levels: $0.900, $0.600
Supply Levels: $1.390, $1.760

ApeCoin (APE/USD) Extends Bearish Momentum Amid Key Support Test
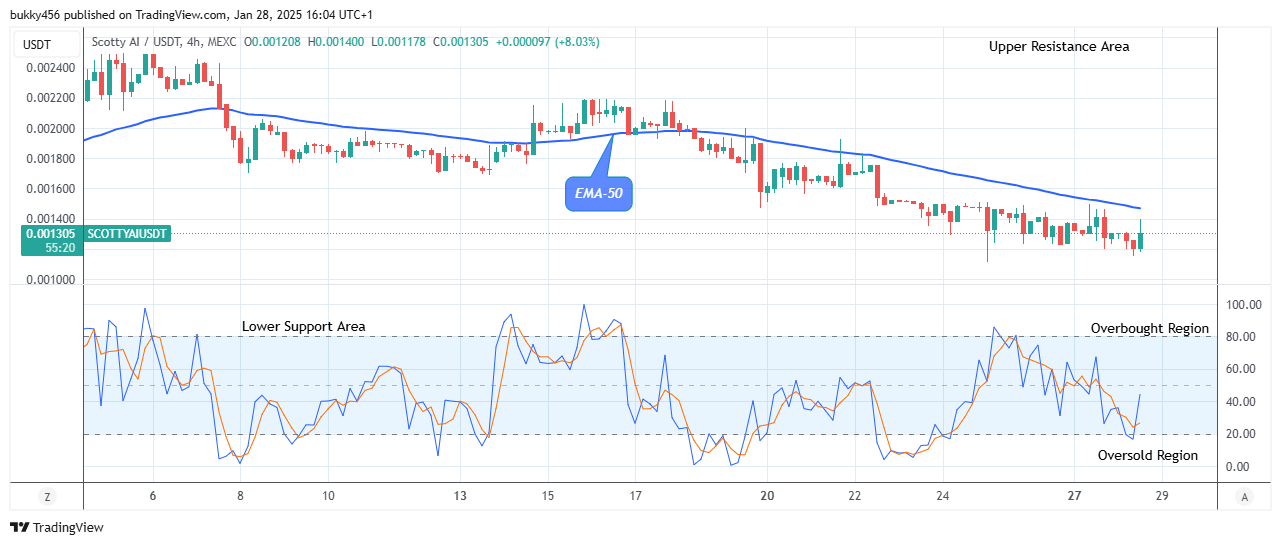
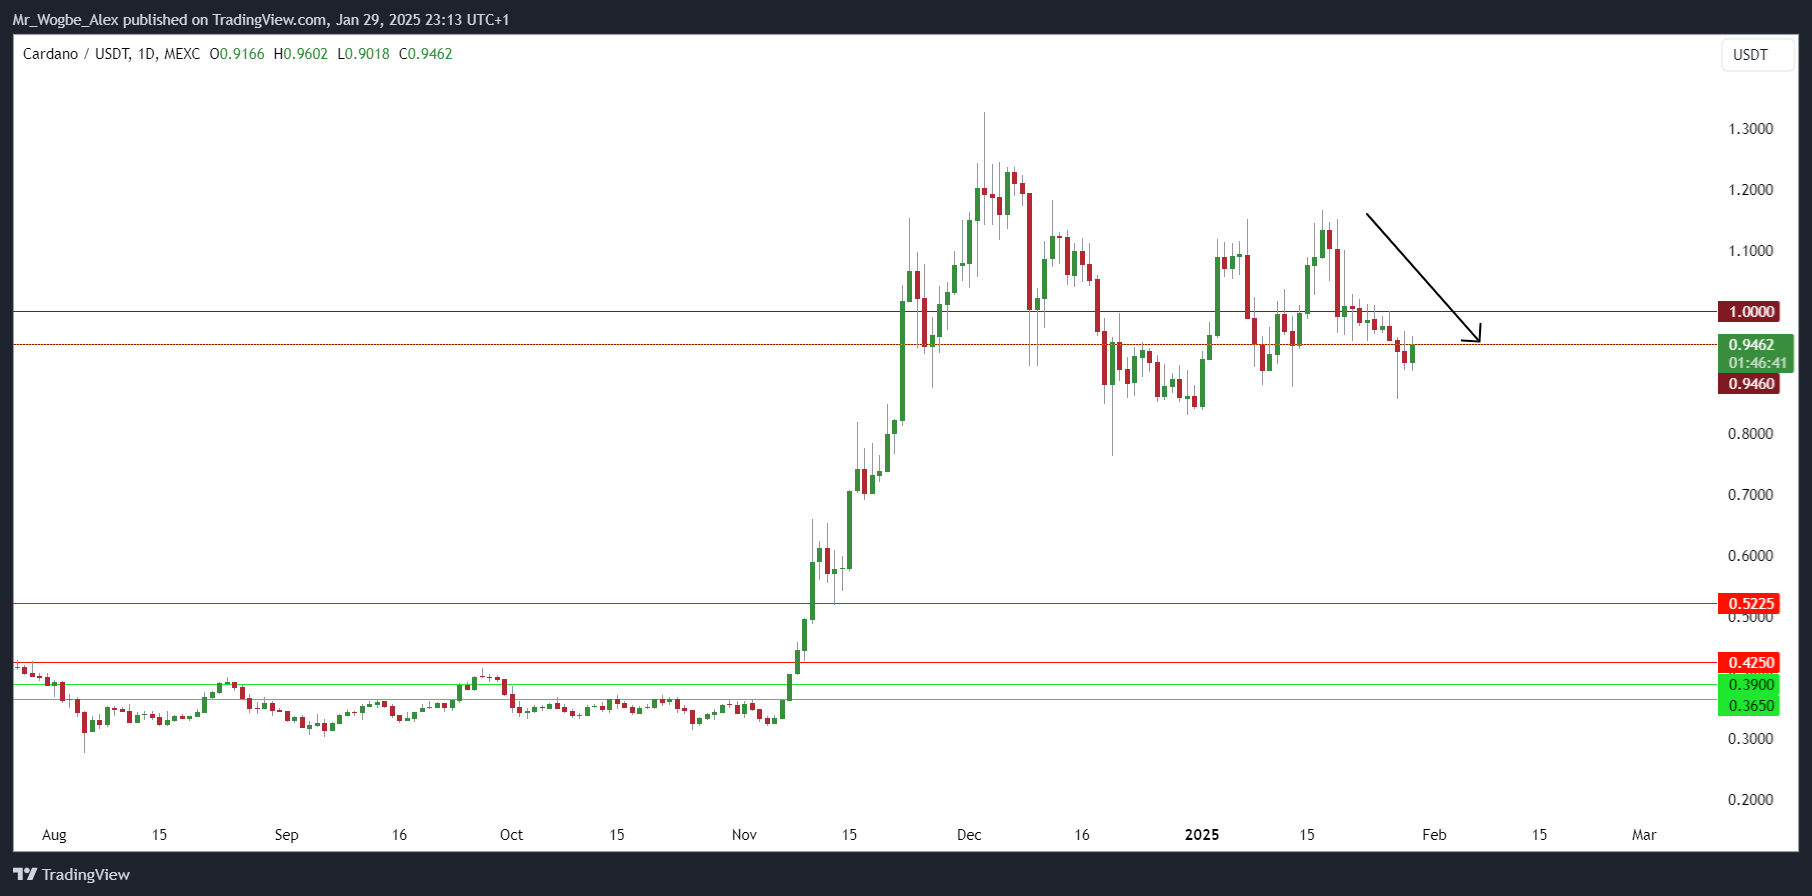
However, as price action reached the $0.600 level in early August 2024, a significant bullish phase emerged, characterized by a series of higher highs. This upward movement persisted until early December 2024, when a renewed selling wave overpowered bullish momentum, leading to a structural shift in price action.

Currently, ApeCoin is testing the critical $0.900 support level, with bearish sentiment prevailing. Given the strength of the recent downtrend, a breakdown below this level appears likely. The 4-hour timeframe highlights a sequence of lower lows, further reinforced by the 4-hour moving average, which continues to signal bearish conditions as price remains below the indicator. Additionally, both the 4-hour and daily moving averages confirm the prevailing downside bias.


ApeCoin (APE/USD) Extends Bearish Momentum Amid Key Support TestMarket Expectation

Despite the strong bearish momentum, traders should exercise caution, as the daily Relative Strength Index (RSI) is approaching the oversold territory. This suggests that selling pressure may soon wane, potentially leading to a temporary relief rally or trend reversal. However, confirmation signals are necessary before anticipating a shift in market sentiment.

You can purchase Lucky Block here.  Buy LBLOCK

Note: Cryptosignals.org is not a financial advisor. Do your research before investing your funds in any financial asset or presented product or event. We are not responsible for your investing results

Decentraland (MANA/USD) Bearish Pressure Intensifies

Price Analysis: MANA/USD Faces Renewed Bearish Pressure as Key Support Level Weakens

MANA/USD has entered a period of decline following its peak in early December 2024. This downturn comes after a significant bullish rally that temporarily reversed the prolonged bearish trend observed throughout mid-2024 to November 2024.

MANAUSD Key Levels

Demand Levels: $0.4160, $0.3270
Supply Levels: $0.5210, $0.6830

Decentraland (MANA/USD) Bearish Pressure Intensifies
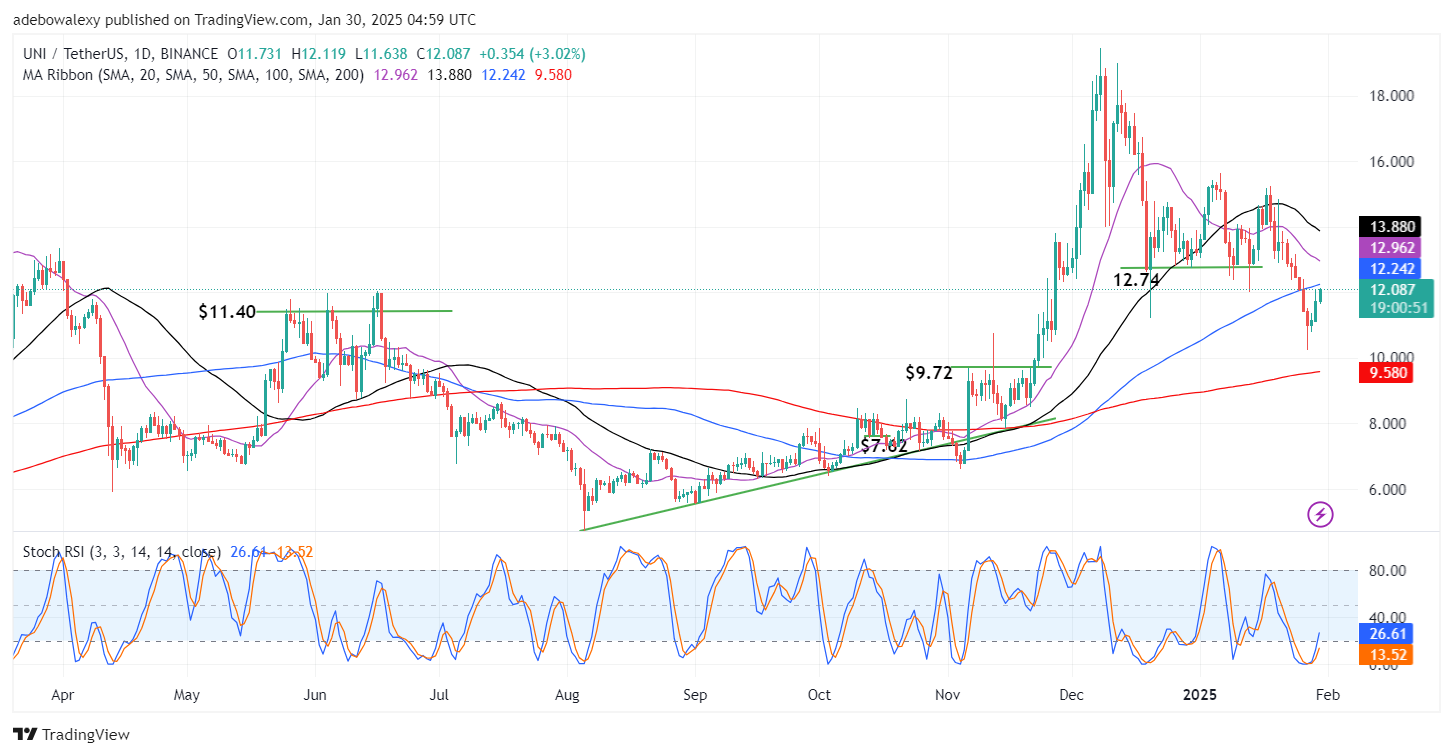
During this bullish phase, the price swiftly breached multiple resistance levels, leading to initial expectations that the bullish momentum would dominate. However, the uptrend lost steam as selling pressure intensified, marking the beginning of a renewed bearish phase.

As the price declined, it encountered initial bullish support at the $0.4160 level, triggering a short-lived upward reaction and the formation of a minor trendline. Despite this temporary rebound, bearish pressure persisted, ultimately leading to a breakdown of the trendline. The price has since revisited the $0.4160 level with increasing bearish intent, signaling the likelihood of a further breakdown.

Technical indicators reinforce the bearish outlook. The daily Moving Average positions the price below its trend line, confirming the downward momentum. Additionally, the Relative Strength Index (RSI) reflects weakening price strength, adding further confluence to the bearish bias.

Decentraland (MANA/USD) Bearish Pressure IntensifiesMarket Expectation

Given the prevailing market structure, a decisive breach of the $0.4160 support appears imminent. Should this level fail to hold, MANA/USD is expected to extend its decline towards the next major support at $0.3270, with little resistance anticipated along the way.

You can purchase Lucky Block here. Buy LBLOCK

Note: Cryptosignals.org is not a financial advisor. Do your research before investing your funds in any financial asset or presented product or event. We are not responsible for your investing results.

Polkadot (DOT/USDT) Breaks Below Dynamic Support Levels

Polkadot Long-term Analysis: Bearish

The market for Polkadot against the Tether has experienced a strong downtrend after the price broke above the $10.048 level in the previous trade. This highlights the struggle to regain bullish momentum as prices decline 7.80% for the week.

Recently, DOT/USDT has seen a further downtrend as the price retraced below the dynamic support at $6.213 as the oscillator below the weekly chart signals an oversold condition for the pair.

Currently, Polkadot trades at $5.695, with over 22 million traded volumes.

Polkadot (DOT/USDT) Breaks Below Dynamic Support Levels
DOTUSDT-Weekly Chart

Technical Indicators

Major Resistance Levels: $6.220, $7.100, and $8.000

Major Support Levels: $5.000, $4.500, and $2.377

Polkadot Technical Analysis

The analysis of Polkadot against the Tether on a weekly timeframe shows that the pair is on a strong downtrend as suggested by the current and previous price movements. The Bollinger bands seem to be diverging, signaling increased volatility and strong selling pressure.

However, the Stochastic RSI indicates a bearish momentum as the lines read 34.50 and 29.60. This signals the pair approaches a critical oversold zone, indicating a potential reversal might surface in the near term.

To this end, expectations in the short term revolve around the ability to stabilize at the current level, followed by potential attempts to reclaim the $6.213 dynamic level if bullish momentum emerges.

DOT/USDT Analysis: What’s Next?

The daily chart for DOT/USDT is showing signs of mild recovery as the pair sees a gain of 1.05% for the day. Though the price action around the lower Bollinger band indicates an oversold condition, the intended opening of the bands indicates price might retrace to the North soon.

On the other hand, the Stochastic RSI suggests the pair may be due for an upside movement if buyers step in as the indicator’s lines read below the 10-mark level. However, the bearish trend remains intact; the price may test the immediate support level before attempting a breakout above $6.510, but a break below $5.200 would indicate a further downtrend.

Polkadot (DOT/USDT) Breaks Below Dynamic Support Levels
DOTUSDT-Daily Chart


You can purchase crypto coins here. Buy LBlock

Ethereum (ETH/USDT) Suspends Between Critical Levels

Ethereum Long-term Analysis: Ranging

Ethereum against the Tether on a weekly basis towards the end of last year has seen a significant rally to the North in the previous session. However, the seems to be experiencing a pullback as the price drops 3.47% below the previous session.

Recent price actions suggested by the Guppy Multiple Moving Averages (GMMAs) and the Stochastic RSI show the tendency for a possible correction phase, though the medium-to-long-term bullish trend remains intact.

To this end, the market remains cautiously bullish, with ETH/USDT holding above key support levels.

Currently, Ethereum is trading at $3,120.37 with 1.42 million traded volumes for the week.

Ethereum (ETH/USDT) Suspends Between Critical Levels
ETHUSDT-Weekly Chart

Technical Indicators

Major Resistance Levels: $3,253.91, $3,287.31, and $3,400

Major Support Levels: $3,094.53, $3,025.61, and $2,991.24

Ethereum Technical Analysis

The analysis of Ethereum against the Tether on a weekly timeframe shows that the pair is currently ranging within a tight range as seen in the positioning of the price between the short-term and long-term EMAs.

Moreover, the Stochastic RSI suggests the pair is approaching the oversold region, as the lines trend below the 20-mark level. Though this signals a continued downtrend, it is a buying opportunity if buying momentum increases soon.

However, the overall sentiment remains slightly bullish, but breaking below $3,025.61 would trigger a deeper correction.

ETH/USDT Analysis: A Renewed Hope on the Horizon

On the daily timeframe, ETH/USDT is currently trending downward, with the price operating below the GMMAs. This suggests the bears are still in control of the market; however, the current uptick of 1.22% in price reflects a positive rebound for the day.

Also, the oscillator at the bottom of the chart indicates the pair is oversold and may be due for a short-term bounce if buying pressure increases.

However, as ETH/USDT awaits confirmation, a break above $3,134 with increased bullish volume would push the price toward $3,201 in the near term; otherwise, a break below the current level would dip the price toward $3,000.

Ethereum (ETH/USDT) Suspends Between Critical Levels
ETHUSDT-Daily Chart


You can purchase crypto coins here. Buy LBlock

Cardano Takes Historic Step Toward Complete Decentralization

Cardano, one of the world’s leading blockchain platforms, is making a major change in how it operates. The network is rolling out its Plomin hard fork today, marking a shift to full community-based governance where ADA token holders will have direct voting power over the network’s future.

Major Changes Coming to Cardano Governance

This update represents the biggest change in how Cardano makes decisions since its launch in 2017. For the first time, people who own ADA tokens will be able to vote on important matters like:

  • Changes to how the network works
  • How to spend funds from the treasury
  • Whether to make updates to the blockchain
  • Other key decisions about Cardano’s direction

The move to this new system required strong support from the network’s participants. Over 78% of Cardano’s node operators have already installed the latest software version needed for the change. The update also needed approval from at least 51% of stake pool operators and received support from the Interim Constitutional Committee (ICC).

Speaking about the update, the Cardano Foundation called it “a milestone in blockchain governance.” The Foundation emphasized how this change puts real power in the hands of ADA holders, letting them shape how the network grows and operates.

One notable feature of the Plomin update is its new rules for staking rewards. Users will now need to pick a decentralized representative (DRep) to receive their staking rewards. This requirement aims to encourage more people to take part in governing the network.

Market Impact and Price Analysis

The price of ADA, Cardano’s native token, has seen some movement around this news. While the token reached $1.34 in November 2024 during what market watchers called the “Trump Trade” period, it’s currently trading at around $0.95. 

Despite recent price changes, ADA has performed well over the past year, rising about 94%—outpacing Ethereum’s 39% gain during the same period.

Looking at market performance, ADA’s total value now stands at $33.6 billion. Technical analysts watching the token’s price patterns have spotted an indication suggesting ADA might move toward $1.90 in the medium to long term.

Cardano Takes Historic Step Toward Complete Decentralization
ADA/USDT Daily Chart

However, the token needs to break through the $1 round figure first, which has been acting as a resistance level.

The Plomin update follows earlier improvements to Cardano’s capabilities. The network has already shown its worth in various real-world applications, catching the attention of major organizations. This latest change to decentralized governance puts even more control in the hands of its community.

As Cardano moves forward with this update, it’s setting up a system where its users truly control how the network develops. This approach to blockchain governance could serve as a model for other projects in the cryptocurrency space.

For ADA holders interested in participating, the new governance system is designed to be straightforward while maintaining the network’s security and reliability. The coming weeks will likely show how effectively this community-driven approach works in practice.

ADA Statistics Data

ADA Current Price: $0.9500

ADA Market Cap: $33.6B

ADA Circulating Supply: 35.1B

ADA Total Supply: 45B

ADA Market Ranking: #9

Interested in learning how to day trade crypto? Get all the information you need here