Wall Street Memes Price Prediction – January 31
Practically, it is now becoming obvious that long-term position movers are getting more and more energy against letting the price movements go freely to the negative side, as the WSM/USD market now bounces, holding firmly.
The bullish signal provided by the oscillators remains firmly validated, indicating that it would be contrary to technical principles to entertain any actions that could disrupt the current long-term momentum. Consequently, holders of Wall Street Memes coin positions should maintain their stance, positioning themselves for substantial upward movement in the near future.
WSM/USD Market
Key Levels
Resistance levels: $0.0012, $0.0017, $0.0022
Support levels: $0.0005, $0.0004, $0.0003
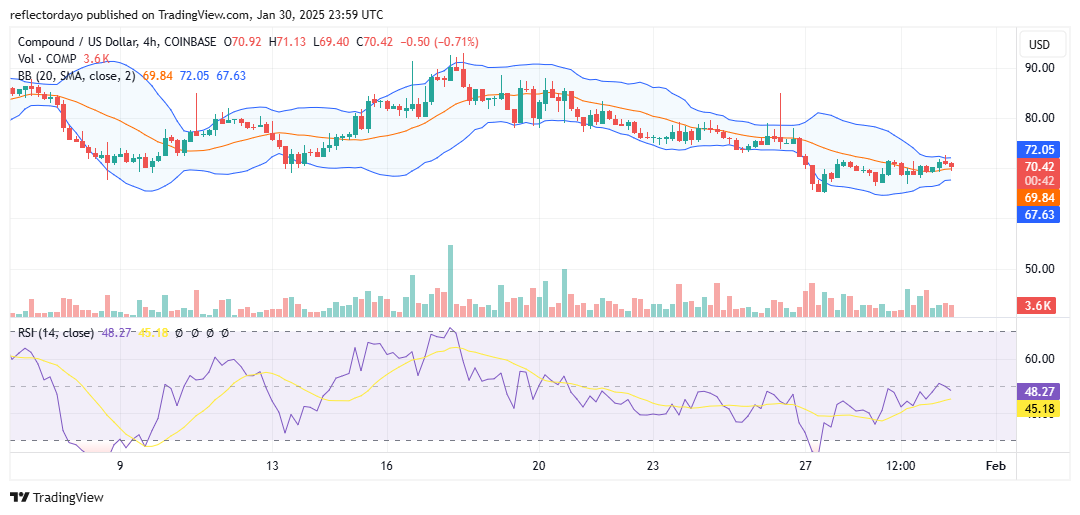
WSM/USD – 4-hour Chart
The WSM/USD market 4-hour chart reveals that the crypto-economic market presently bounces, holding firmly.
The Bollinger Bands indicators have been found, managing to get a repositioning posture at a given lower end to fine-tune a threshold upon which buying forces will start emanating. Looking at the variant candlesticks at their bottom sides, it appears that price has been recouping for real recovery alongside the lower part of the Bollinger Bands. As it is, the stochastic oscillators have perfectly kept a northbound-swirling style across different points.
Given the WSM/USD market’s failure to sustain momentum at the upper Bollinger Band, should positions executed at this level be promptly liquidated?
Considering the spots that the trend lines of the indicators of Bollinger Bands have been featuring, it is seen that the whole area is a considerable good point of executing longing orders, as the WSM/USD market bounces, holding firmly.
From a technical perspective, prioritizing the decision to accumulate additional positions is strategically favorable. The optimal entry point lies within the trade zones between the middle and lower Bollinger Band trend lines, as these levels provide a strong foundation for invalidating potential minor pullbacks, thereby enhancing the likelihood of sustained upward movement.
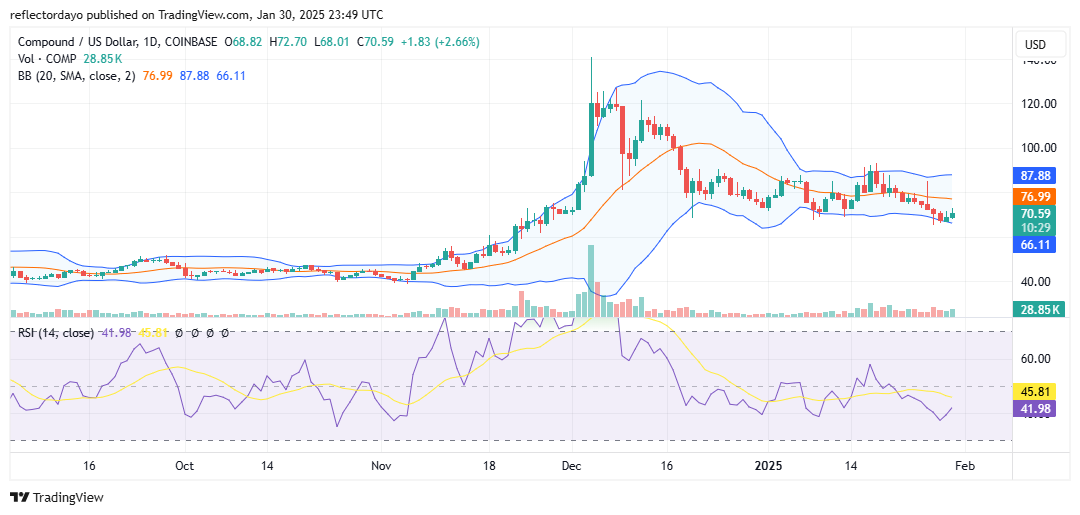
WSM/USD 1-hour chart
The 1-hour chart showcases that the WSM/USD market bounces, holding firmly on the thresholds of the Bollinger Bands.
In alignment with the rebound strategy for the underlying asset, the candlestick patterns are exhibiting a series of lower highs and lower lows, signaling potential bearish consolidation. However, the stochastic oscillators, as observed in the hourly chart, are indicating the likelihood of impending upward momentum, suggesting a potential reversal against the current downtrend in the U.S. dollar market.
Deepseek is now exposing the whole system rn
Deepseek exposing the whole system rn https://t.co/4cF6dzlPcx pic.twitter.com/q22YDJMy5A
— Wall Street Memes (@wallstmemes) January 30, 2025
Buy and stake WSM now!: Wall Street Meme (WSM)
 The price bars are below the moving average, due to the high inflow from the sell traders. However, there is about to be a turnaround for the D2TUSD buy traders as a new upswing begins.
 The market price of Dash 2 Trade which increases to a $0.000828 high level below the moving averages as the 4-hourly session opens today, suggests the return of the bulls to the market and an improved bullish market sentiment.


 The price of the cryptocurrency has fallen below the supply trend lines as a result of the bears’ pressure, bringing it to a low of $0.0011 in the last session. As it is, the coin price will rise further as it begins its bullish correction to drive the coin market upward.
 The high order flow from the short traders to the $0.0012 support value in the last session also added to its bearishness in its recent high. Meanwhile, the SCOTTYAIUSD price will rise further as the bulls anticipate more commitment to the asset for potential gains.