Ondo Finance Brings Tokenized US Treasuries to XRPL

Ondo Finance is launching Ondo Short-term US Government Treasuries (OUSG), a tokenized US Treasury fund on the XRP Ledger (XRPL). Within six months, this measure will allow institutional investors to access OUSG through XRPL.

OUSG is a safe, compliant, and yield-generating digital asset backed by high-quality US Treasuries. It will also work smoothly with Ripple’s RLUSD stablecoin, allowing instant buying and selling. This marks a big step in bringing traditional finance and Decentralized Finance (DeFi) closer together.

A New Investment Option for Institutional Users by Ondo

Ondo U.S. Government is a dependable and secure investment governed by strict laws and backed by US Treasury securities. As a result of these rules institutional investors may now easily access this tokenized asset through its listing on XRPL.

Ondo Finance Brings Tokenized US Treasuries to XRPL

The XRPL has built-in features, like Decentralized Identifiers (DIDs) and on-chain credential management, making sure that all transactions follow Know Your Customer (KYC) and Anti-Money Laundering (AML) rules.

Liquidity is another key benefit. Ripple and Ondo Finance have already arranged for funds to be available when OUSG launches. This will speed up the adoption of stablecoin by offering investors fast access to buy and sell. To this end, this application further strengthens XRPL’s financial network for tokenized real-world assets (RWAs).

Seamless Transactions with 24/7 Liquidity

One of the advantages of Ondo’s OUSG on XRPL is its ability to work with Ripple’s RLUSD stablecoin. Investors can instantly exchange RLUSD for OUSG, making it possible to buy and sell at any time. Unlike traditional markets, which only operate during certain hours, this 24/7 liquidity ensures financial flexibility.

The XRPL is designed for fast and low-cost transactions, making it the perfect place for institutions to manage digital assets. With planned features such as Multi-Purpose Tokens (MPTs) and permissioned Domains, the XRPL will continue to be a popular choice for tokenized finance. By integrating OUSG with XRPL, Ondo Finance assists institutions in better managing their money through blockchain technology.


In order to place winning trades with us via Bybit, you can open an account here.

Bitcoin (BTC) Price Prediction: BTC/USDT May Have Found New Support

Bitcoin resumed trading above the $100,000 mark about 10 sessions ago. Since then, the token has consistently remained above this threshold. More importantly, it has sustained a position above the $101,184 level, suggesting that BTC may have found strong support at this price point.

BTC/USDT Long-Term Trend: Bullish (Daily Chart)

Key Price Levels:

Resistance: $105,000, $110,000, $150,000

Support: $100,000, $95,000, $90,000

Bitcoin (BTC) Price Prediction: BTC/USDT May Have Found New Support

A green price candle has formed to represent today’s trading activity. This candle has emerged directly off the $101,184 support level and remains above the 20-day Moving Average (MA) line, as well as all other MA lines on the chart. Meanwhile, the Stochastic Relative Strength Index (RSI) indicator continues to decline sharply into the oversold region.

Bitcoin (BTC) Price Prediction: Tailwinds May Drive BTC Higher

Price action on the Bitcoin daily chart suggests that BTC has established new support above the $101,000 price mark. Additionally, the position of today’s price candle indicates that bullish momentum could be gaining strength. However, the Stochastic RSI indicator lines continue to descend into the oversold region.

This decline appears to result from the price drop observed over the past three sessions. However, the movement of the Stochastic RSI lines seems exaggerated, signaling that bearish momentum may be weakening. This could provide an opportunity for an upside retracement. Given that the latest price candle remains above all MA lines, an upward move could be imminent.

Bitcoin (BTC) Price Prediction: Short-Term Market Outlook (4-Hour Chart)

On the Bitcoin 4-hour chart, the latest price candle remains green, consistent with observations from the daily chart. Additionally, the current price of BTC is positioned between the 20-, 50-, 100-, and 200-day MA lines, which appear to be widening.

Bitcoin (BTC) Price Prediction: BTC/USDT May Have Found New Support

Moreover, the Stochastic RSI lines have converged just below the 80 mark. This setup is promising, as an upside crossover has already occurred in the overbought region, suggesting that bullish momentum may intensify. Consequently, the market appears poised for short-term price increases.

Given these technical indicators, traders could target a retracement toward the $105,000 price level, as the likelihood of reaching this mark seems high based on current market signals.

Get Bitcoin here. Buy BTC 

Scotty The Ai Price Prediction: SCOTTYAIUSD Price May Bounce-off the Support Level Soon

Scotty The Ai Price Prediction – January 29

Scotty, the AI market may likely bounce off the support line and break up the resistance level at $0.0210 as soon as the new correction begins. A strong push by the long traders above the $0.0029 previous high point with a one-hour candle closing could signify a shift in the market dynamics. Such a breakthrough would provide an opportunity for buyers to regain control and potentially drive the price of Scotty AI towards the $0.0210 mark.

Technical indicators:
Key Resistance Levels: $0.00148, $0.00149, $0.00150
Key Support Levels: $0.00090, $0.00080, $0.00070

SCOTTYAI/USD Long-term Trend: Bearish (Daily Chart)

The SCOTTYAIUSD price may bounce off the support level following the new correction in the crypto market. The coin price initiated another bullish candle below the supply level, indicating bearish momentum in its long-term view.
Scotty The Ai Price Prediction: SCOTTYAIUSD Price May Bounce-off the Support Level Soon
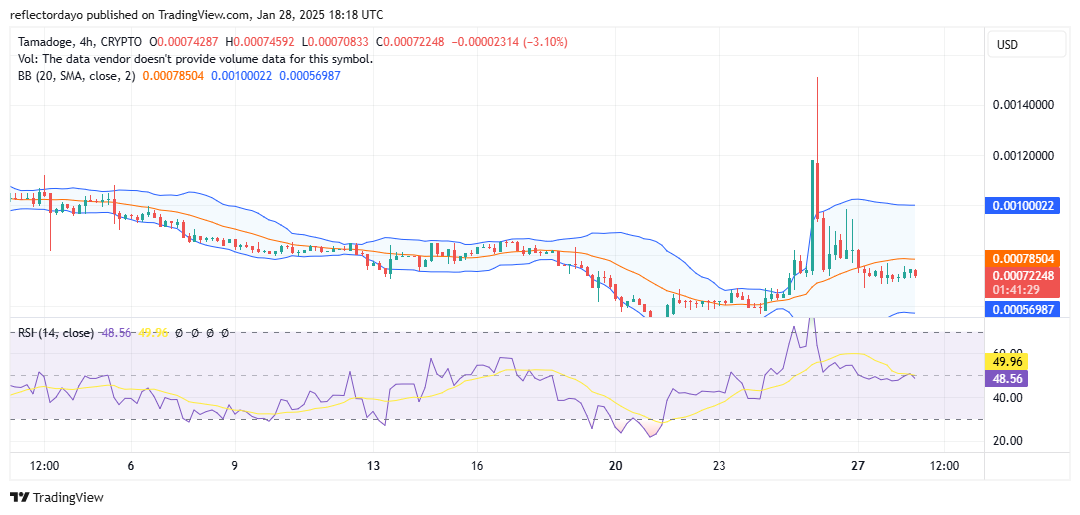
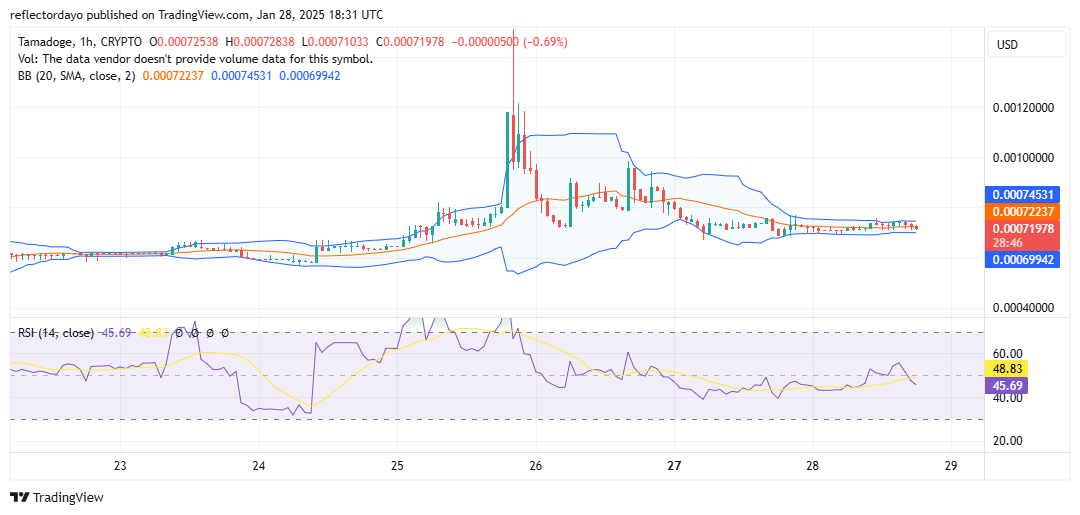
The high order flow from the bears at a $0.00111 low level in the past few days has dropped the crypto price below the EMA-50 in its recent high.

Earlier today, Scotty The Ai buyers initiated a bullish action and increased the coin price to a $0.00150 high point below the supply level, suggesting that the coin market may bounce off the support level soon as the journey up north begins.

Thus, increasing investors’ interest and a break above the $0.0210 resistance mark could replenish the recovery sentiment and intensify the buying pressure on the crypto.

Hence, the current correction phase may bounce off the support line soon and trigger a bullish move as the momentum indicator points upwards.

Due to this, the Scotty The Ai price might reach a significant $0.0300 supply trend line as the bulls continue to initiate a bullish trend in its long-term perspective.

SCOTTYAI/USD Medium-term Trend: Bearish (4H Chart)

The SCOTTYAIUSD pair initiates a new correction to bounce –off the support level, while the bulls direct the movement of the pair below the supply levels in its medium-term outlook.
Scotty The Ai Price Prediction: SCOTTYAIUSD Price May Bounce-off the Support Level Soon
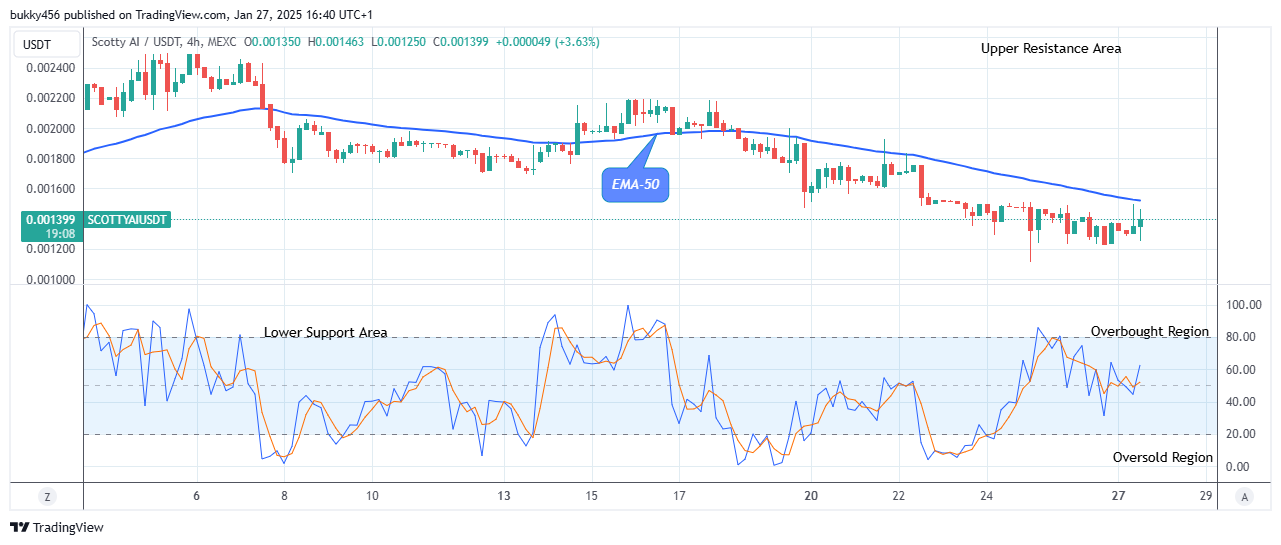
The sustained bearish pressure at the $0.00130 value in the previous action has dropped the coin price below the resistance line in its recent price level.

After completing the downside move at $0.00111, the Scotty Ai price bounced off the support level to a $0.00150 resistance level below the EMA-50 as the 4-hourly chart opens today, indicating that the traders are actively buying at this level.

Hence, should the bulls increase their buying motives, the previous high of $0.00249 value might be retested soon, offering a good entry opportunity for buyers.

Hence, Scotty The Ai is showing more upside possibility as indicated by the daily stochastic, pointing in an upward direction.

Therefore, the token price may bounce off the support level to reach the $0.0210 high mark in the coming days as the journey up north begins in its medium-term perspective.

On the OT Sea, OTC platform, trade $SCOTTY right now!


$SCOTTY claim is now live! Stake your claimed tokens below to earn rewards!


Dash 2 Trade Price Predictions for Today, January 29: D2TUSD Price Anticipates Further Growth

Dash 2 Trade Price Forecast: D2TUSD Price Anticipates Further Growth (January 29)

Dash 2 Trade market anticipates further growth as the bulls decide to shape the price trajectory as it approaches the anticipated target. The coin price is likely to grow further if the current support at $0.00089 value holds and the daily chart closes above the $0.00390 resistance level. As a result, the coin price might swing to its recent swing high at the $0.00390 level and extend to the $0.01000 upper resistance level, resulting in an intraday gain for the coin buyers.

Key Levels:
Resistance levels: $0.00800, $0.000900, $0.00100
Support levels: $0.000650, $0.000600, $0.000550

D2T (USD) Long-term Trend: Bearish (Daily Chart)

The D2TUSD pair, anticipates further growth as the bulls interest continue to increase, moving the coin price towards the resistance zone in the long-term outlook. The price bar is trading below the moving averages, implying the coin market is in a bearish trend.
Dash 2 Trade Price Predictions for Today, January 29: D2TUSD Price Anticipates Further Growth However, the token price anticipates further growth as the bulls are set to increase the trend and may likely break up the resistance level soon.

The bearish pressure at the $0.00089 support level in the past few days has made the coin stayed below the supply trend levels in its recent times.

However, there is likely for the Dash 2 Trade price retesting the $0.00390 level soon as the bulls has just resumed their rising pattern.

Actions from buyers have also increased the coin further up to the $0.00101 resistance value below the EMA-50 as it journeys up north, indicating that the bulls are returning gradually for an increase in the coin price and to command the Dash 2 Trade’s price actions.

Thus, the coin price will grow further if the buy traders could add more pressure to their buying actions in the market.

Further, the daily stochastic indicates an uptrend. In this case, the price of Dash 2 Trade might continue its bullish trend pattern and the price could grow further to reach the $0.01000 supply mark sooner in its long-term outlook.

D2T (USD) Medium-term Trend: Bullish (4H Chart)

The D2TUSD pair is positive in its medium-term time frame, trading in a bullish trend. The price currently trades above the EMA-50, suggesting a bullish move and triggering a smooth bull cycle pattern, which could lead the prices to an overhead trend line.
Dash 2 Trade Price Predictions for Today, January 29: D2TUSD Price Anticipates Further Growth 
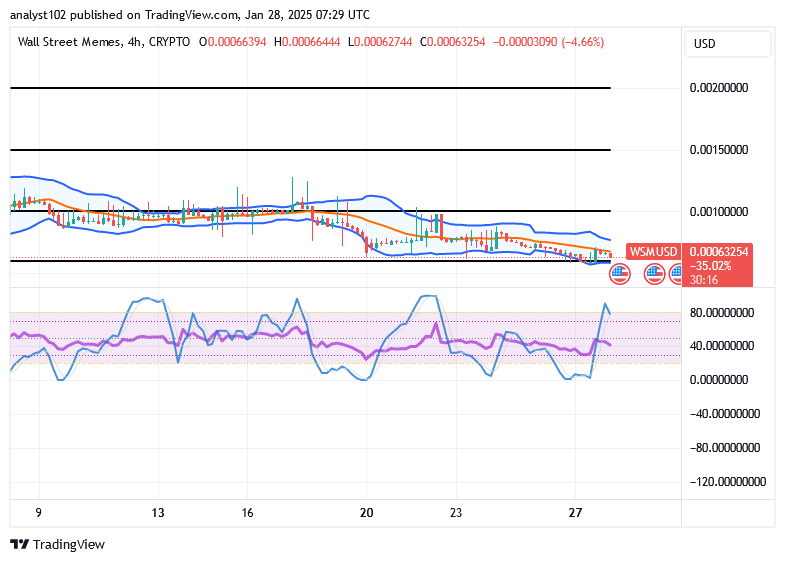
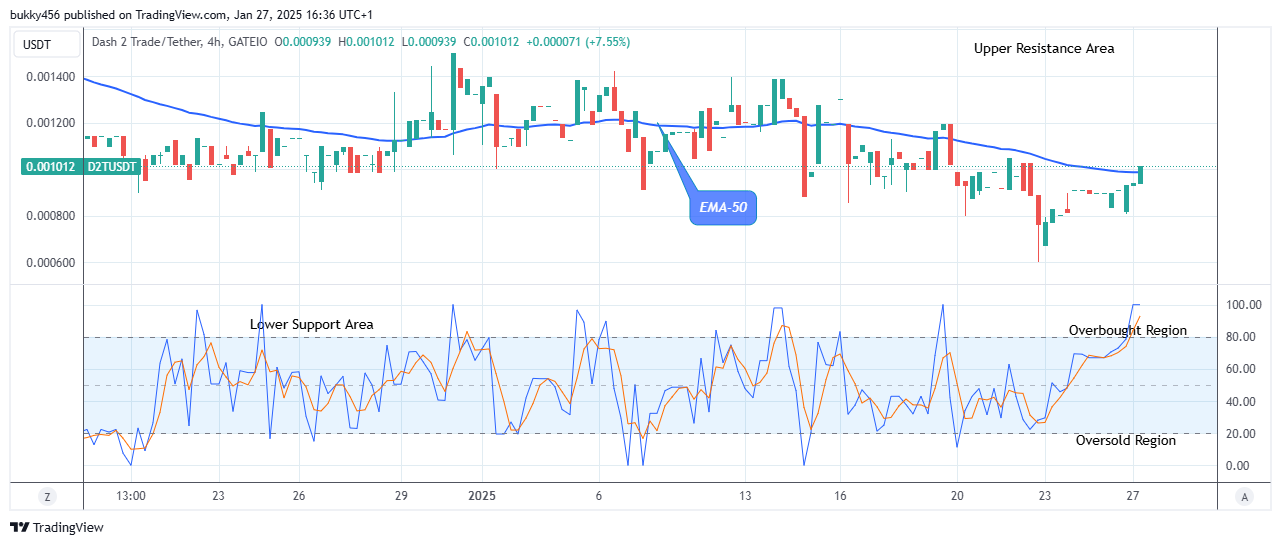
The bulls’ pressure on the currency pair at a $0.000934 high level in the past few hours has made it easier for the price to remain in an upward trend zone in its recent high.

The Dash 2 Trade price increased to the $0.00101 resistance level below the EMA-50 as the 4-hourly chart opens today, suggesting an increase in investors’ interest on the crypto investment.

The market participants are responding to this pattern, and its breakout should offer a good entry opportunity for interested traders.

Meanwhile, further upsides are likely as the price signal is pointing upwards, indicating that the upward rally will continue and may likely breakup the $0.00150 resistance value, and this may reach the $0.01000 supply value soon in the medium-term time frame.

Our platform keeps an eye on the market in real time, so let Dash 2 Trade handle the heavy lifting.

Want a coin that has a huge potential for massive returns? That coin is Dash 2 Trade. Buy D2T now.

Pepe Unchained (PEPU/USD) Market Update: Price Maintains Stability Above $0.013

In our recent analysis of the Pepe Unchained (PEPUUSD) market, we observed that the price stabilized at the $0.013 level, influenced by trader indecision as the price rallied and secured a foothold at this key support zone. This stability has continued into today’s trading session. The price is currently in a favorable position, with bullish sentiment prevailing as it remains above the 20-day moving average. The bulls have solidified support at $0.012 and are holding steady at $0.013, with an eye on reaching the $0.014 price level.

Key Levels to Watch:

  • Resistance: $0.014, $0.015, $0.016
  • Support: $0.013, $0.012, $0.011

Pepe Unchained (PEPU/USD) Market Update: Price Maintains Stability Above $0.013

Technical Analysis: Resilience in Bullish Sentiment

The Pepe Unchained crypto signal has shown resilience, with the price consistently rebounding above the $0.013 level and maintaining this position through today. This recovery and stability indicate the persistence of bullish sentiment, signaling potential for further upward movement as the market has established support at both the $0.012 and $0.013 levels.

The Bollinger Bands indicate a reduction in market volatility, as evidenced by the narrowing horizontal range. This is further supported by recent candlestick patterns, where price action aligns with the horizontally moving 20-day moving average, reflecting balanced buying and selling pressure.

Recent trading sessions have been characterized by indecision around the $0.013 level, resulting in minimal price movement. This indecision is also reflected in lower trading volume, indicating a lack of significant buying or selling activity. However, with the price remaining above the 20-day moving average, the market sentiment currently favors the bulls. Despite some fluctuations, the price of the Pepe Unchained market has held steady above $0.013, suggesting that the market may be poised for continued upward movement..

Pepe Unchained (PEPU/USD) Market Update: Price Maintains Stability Above $0.013

Short-Term Outlook: 1-Hour Chart Analysis

The declining volume histogram bars indicate low levels of trading activity, suggesting a lack of significant buying or selling pressure, which has resulted in the market remaining in a state of equilibrium.

The current candlestick, a moderate bullish pattern, signals the potential for a price increase. The bulls have successfully maintained support at the $0.012 and $0.013 levels, with the price now approaching a breakout above the $0.014 level.

Buy PEPU!

Buy and stake NOW on the L2 for DOUBLE staking rewards! Pepe Unchained (PEPU)

EigenLayer (EIGEN/USDT) Struggles to Regain Bullish Momentum

The market for EigenLayer against the Tether has shown signs of renewed interest amidst difficulty in maintaining momentum. However, the Guppy Multiple Moving Averages (GMMAs) signal a prolonged downtrend, as the bearish traders dominate.

Recently, EIGEN/USDT has experienced strong selling pressure with several failed attempts at high resistance levels. The position of the green EMAs and their spread below the red EMAs signals the market may be trending South despite the current 1.90% gains. However, the oscillator suggests traders can expect a short-term recovery soon.

Currently, EigenLayer is trading at $2.628 with over 6 million traded volume.

EigenLayer (EIGEN/USDT) Struggles to Regain Bullish Momentum
EIGENUSDT-Daily Chart

Technical Indicators

Major Resistance Levels: $2.853, $3.116, and $3.345

Major Support Levels: $2.537, $2.268, and $2.000

EigenLayer Technical Analysis

The analysis of EigenLayer against Tether on a daily timeframe shows that the pair operates at a critical zone. Despite the recent uptick in price, the pair is struggling in sustaining bullish momentum, as the overall sentiment as indicated by the GMMAs remains bearish.

On the other hand, the Stochastic RSI signals a rebound in the near term as the lines read extreme oversold values. To this end, an increase in volume and price breakout above $2.853 in the nearest term would indicate a bullish reversal; otherwise, a break below $2.537 would signal more downside movement.

EIGEN/USDT Analysis: What’s Next?

On the 4-hour chart, EIGEN/USDT shows price is dipping, reflecting a 2.12% decline over the previous trading session, as the market slopes downward.

However, the price seems to have retraced below $2.669, but the overbought condition of the Stochastic oscillator and the volume of trade suggest the pair might face another wave of selling pressure soon unless strong buying momentum emerges.

To this end, EIGEN may retest $2.574 or lower in the near term, unless stronger bullish pressure surfaces.

EigenLayer (EIGEN/USDT) Struggles to Regain Bullish Momentum
EIGENUSDT-4H Chart


You can purchase crypto coins here. Buy LBlock

Tamadoge (TAMA/USD) Stabilizes Near $0.0007, Setting the Stage for a Potential Rebound

Prior analyses identified $0.0008 as a critical price level for the Tamadoge market. This level served as a significant support zone, effectively buoying the market above it for an extended period. However, a surge in selling pressure eventually overwhelmed this support, driving prices downward. Over the weekend, the market experienced a significant shift, with prices successfully breaking above the $0.0008 resistance level.

Key Levels

  • Resistance: $0.00085, $0.0009, and $0.00095
  • Support: $0.0007, $0.00065 and $0.0006

Tamadoge (TAMA/USD) Stabilizes Near $0.0007, Setting the Stage for a Potential Rebound

TAMA/USD Price Analysis: The Indicators’ Point of View

The weekend witnessed a significant price breakout above the $0.0008 resistance level in the Tamadoge market, attracting substantial bullish momentum. This momentum propelled prices to a notable high of $0.0015. However, this rapid ascent was followed by a sharp price correction, characterized by a significant sell-off as bearish forces capitalized on the momentum to exert downward pressure on the market.

Bullish sentiment re-emerged around the $0.0008 price level, with buyers attempting to defend this level as a support zone. However, the crypto signal remained volatile, leading to continued price swings. Ultimately, bearish pressure prevailed, pushing prices below the $0.0008 level. At the current price level of $0.00072, the market appears to be in a state of equilibrium.

Tamadoge (TAMA/USD) Stabilizes Near $0.0007, Setting the Stage for a Potential Rebound 

Tamadoge Short-Term Outlook: 1-Hour Chart

Zooming into a smaller timeframe, the market is currently stabilizing around the $0.0007 level, with price action exhibiting a degree of consolidation in this area. Concurrently, the Bollinger Bands are converging, forming a narrow price channel. This phenomenon, often referred to as a ‘volatility squeeze,’ typically precedes a period of increased volatility and potential significant price movements.

While recent candlesticks have demonstrated a degree of harmony with the horizontally moving 20-day moving average, suggesting a period of relative calm, traders should remain vigilant for a potential breakout. This breakout could potentially occur in either direction, although a move above the $0.0008 level may provide a more significant bullish signal.

Buy TAMA/USD!

Buy TAMA today!

Wall Street Memes (WSM/USD) Trade Is Weak, Muscling Catalysts

Wall Street Memes Price Prediction – January 28

A more lesser declining force has been allowed to thrive tentatively in the mode of pushing moves between bulls and bears of the market lines that paired the valuation of Wall Street Memes with the purchasing stance of the American currency, as the financial situation is weak, muscling catalysts in the wake of finding an all-time low.

The majority of subsequent price actions will likely be to create favorable conditions for longing position orders as soon as a sudden upsurge occurs in the form of a powerful bullish candlestick. This is especially true if the situation is combined with an oscillator arrangement that points north from a specific reduced point.

WSM/USD Market
Key Levels
Resistance levels: $0.0012, $0.0017, $0.0022
Support levels: $0.0005, $0.0004, $0.0003

WSM/USD – 4-hour Chart

The WSM/USD market 4-hour chart showcases that the crypto-economic market is weak, muscling catalysts at a given lower end.

The overall technical outlook of the positioning pattern of the Bollinger Bands has surrendered to finding a mounting base around $0.0006. The stochastic oscillators are in a slight northbound-swerving mode, placing in the overbought region to give birth to a mere warning signal note against seeing untimely further pushes to the moon direction.
Wall Street Memes (WSM/USD) Trade Is Weak, Muscling Catalysts

Should buyers of the WSM/USD market give in to disadvantages that often arise with regard to the oscillators’ positioning postures?

Considering the current positioning setup of the oscillating tools, it is not likely that some stances will surface in the direction of the negative side, as the WSM/USD trade is weak, muscling catalysts in inputs.

Traders looking to take long positions should focus on entering as the price approaches the support levels of 0.0005, 0.0004, or 0.0003. These levels present a good risk-to-reward setup, as the price is likely to bounce higher from these support zones, especially if momentum starts to shift in favor of buyers.
Wall Street Memes (WSM/USD) Trade Is Weak, Muscling Catalysts

WSM/USD 1-hour chart

The 1-hour chart showcases that the WSM/USD market is weak, muscling catalysts at reduced trading spots.

The stochastic oscillators’ swerving approach has shown a significant amount of bullish-signal setups at various lower points, most of which include the oversold zone. The Bollinger Bands’ trend lines are still extending eastward, confirming the market’s sideways movement. With the hope that the price would ultimately break through the overhead resistance levels of 0.0012, 0.0017, and 0.0022, the market is offering long-position traders a chance to come close to the support levels of 0.0005, 0.0004, and 0.0003. Before expanding their holdings, traders should exercise patience and wait for evidence of a higher trend, especially a breakout over $0.0012.

Has the AI bubble burst recently?

Buy and stake WSM now!: Wall Street Meme (WSM)

OFFICIAL TRUMP (TRUMP/USD) Holds Steady at $30 Amid Market Consolidation

The OFFICIAL TRUMP market experienced a significant rally, surging close to the $80 mark before undergoing a substantial pullback. Currently, the market is recovering from a newly established support zone, specifically rebounding from the $25 price level. This recovery hints at the potential for more stable and measured price movements in the sessions ahead.

The initial surge was fueled by remarkable hype, particularly as the presidential inauguration drew near. Such market behavior is common with tokens driven by hype, especially memecoins or “politifi” coins. They often launch with a wave of excitement, only for interest and momentum to wane shortly after.

The OFFICIAL TRUMP Market Data

  • TRUMP/USD Price Now: $29.60
  • TRUMP/USD Market Cap: $ 5.9 billion
  • TRUMP/USD Circulating Supply: 200 million TRUMP
  • TRUMP/USD Total Supply: 1 billion TRUMP
  • TRUMP/USD CoinMarketCap Ranking: #25

TRUMP OFFICIAL (TRUMP/USD) Holds Steady at $30 Amid Market Consolidation

Key Levels

  • Resistance: $35, $40, and $50
  • Support: $25, $20, and 15.

The OFFICIAL TRUMP Market Through the Lens of Indicators

The OFFICIAL TRUMP market, a recently launched token, has gained significant traction in recent days, particularly as the presidential inauguration approached. This surge in interest is evident in the early price movements on the chart. However, bullish momentum has since slowed, and price action now appears more subdued. After rallying from the $25 support level, the market is attempting to hold steady around the $30 price mark.

On the 4-hour chart, the current session shows some positive momentum, with the price trading above the 20-day Moving Average (MA), signaling potential short-term stability. However, the Relative Strength Index (RSI) remains below the 50 midpoint, indicating that overall market momentum is still in bearish territory. This crypto signal suggests that, while the price holds above the 20-day MA, the broader trend lacks the strength typically associated with sustained bullish movement.

TRUMP OFFICIAL (TRUMP/USD) Holds Steady at $30 Amid Market Consolidation

TRUMP/USD Price Prediction: 4-Hour Chart Analysis

The token’s current trading range of $25–$30 indicates that much of its earlier gains have been eroded. This pattern is common in the crypto space, particularly for tokens driven more by speculation than by strong fundamentals. However, the initial hype has helped the market establish a higher price floor.

If a new catalyst emerges to drive the market, investors may consider reentering bullish positions at the current price level—provided it holds steady and does not break lower. For now, the market appears likely to continue consolidating within this range, awaiting a trigger for its next significant move.

Trade crypto coins on BYBIT!