IMPT is under bulls’ control
IMPT (IMPTUSDT) Price Analysis – January 28
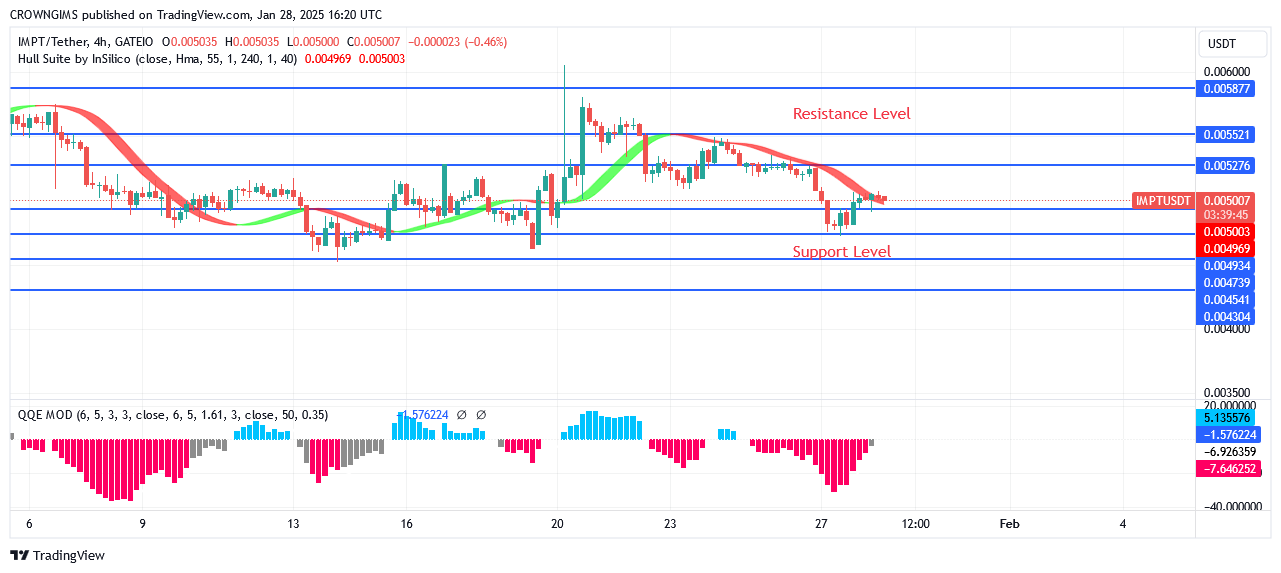
If sellers add additional assets, the key support level of $0.0047 might be broken lower, and the lows of $0.0045 and $0.0043 might be reached. When buyers pick up steam, the $0.0049 resistance level may be broken higher, testing the $0.0052 and $0.0055 levels.
IMPTUSDT Market
Key Levels:
Resistance levels: $0.0049, $0.0052, $0.0055
Support levels: $0.0047, $0.0045, $0.0043
IMPTUSDT Long-term Trend: Bullish
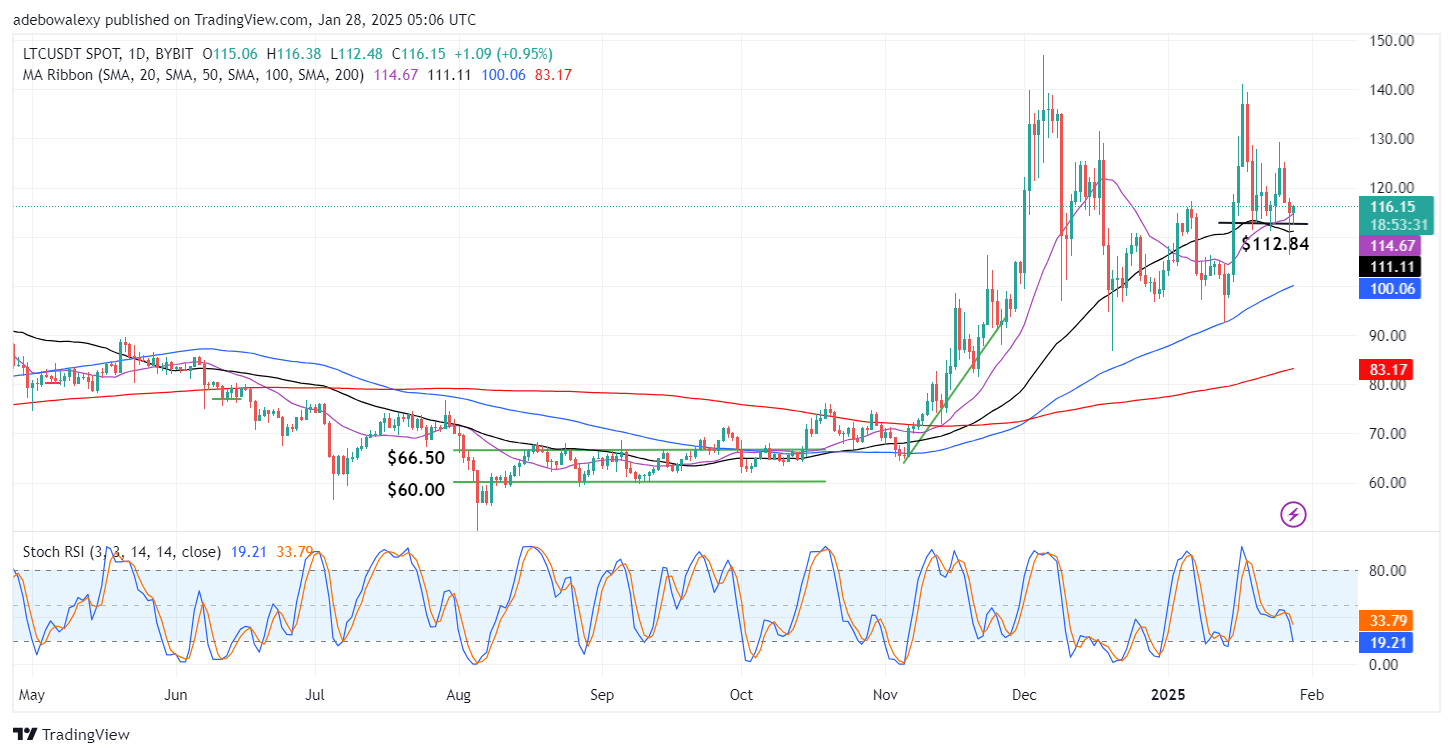
Although buyers have control over IMPT, sellers are resisting the positive trend. The price peaked at the resistance level of $0.0067. The price remains constant at the same level for a few days. As the bears gained strength, the price broke through the $0.0065 and $0.0058 support levels. It pulled back and retested the $0.0055. The price challenged the $0.0049 support level on January 9 after breaking through the $0.0052 support level. It is currently making an effort to break above the predefined level despite the price drop.
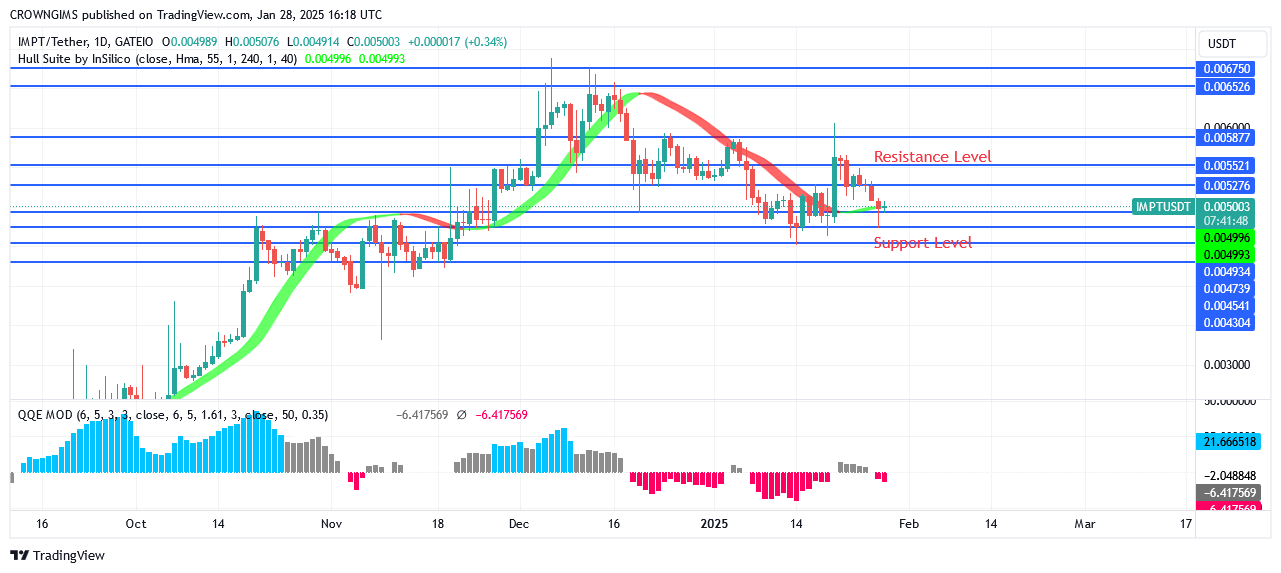
The daily chart indicates that buyers control the market. The price action has produced a double bottom formation on the daily chart. At the moment, the price is increasing. If sellers add additional assets, the key support level of $0.0047 might be broken lower, and the lows of $0.0045 and $0.0043 might be reached. When buyers pick up steam, the $0.0049 resistance level may be broken higher, testing the $0.0052 and $0.0055 levels. When the QQE MOD’s histogram is larger than zero, it indicates a buy signal.
IMPTUSDT Medium-term Trend: Bullish
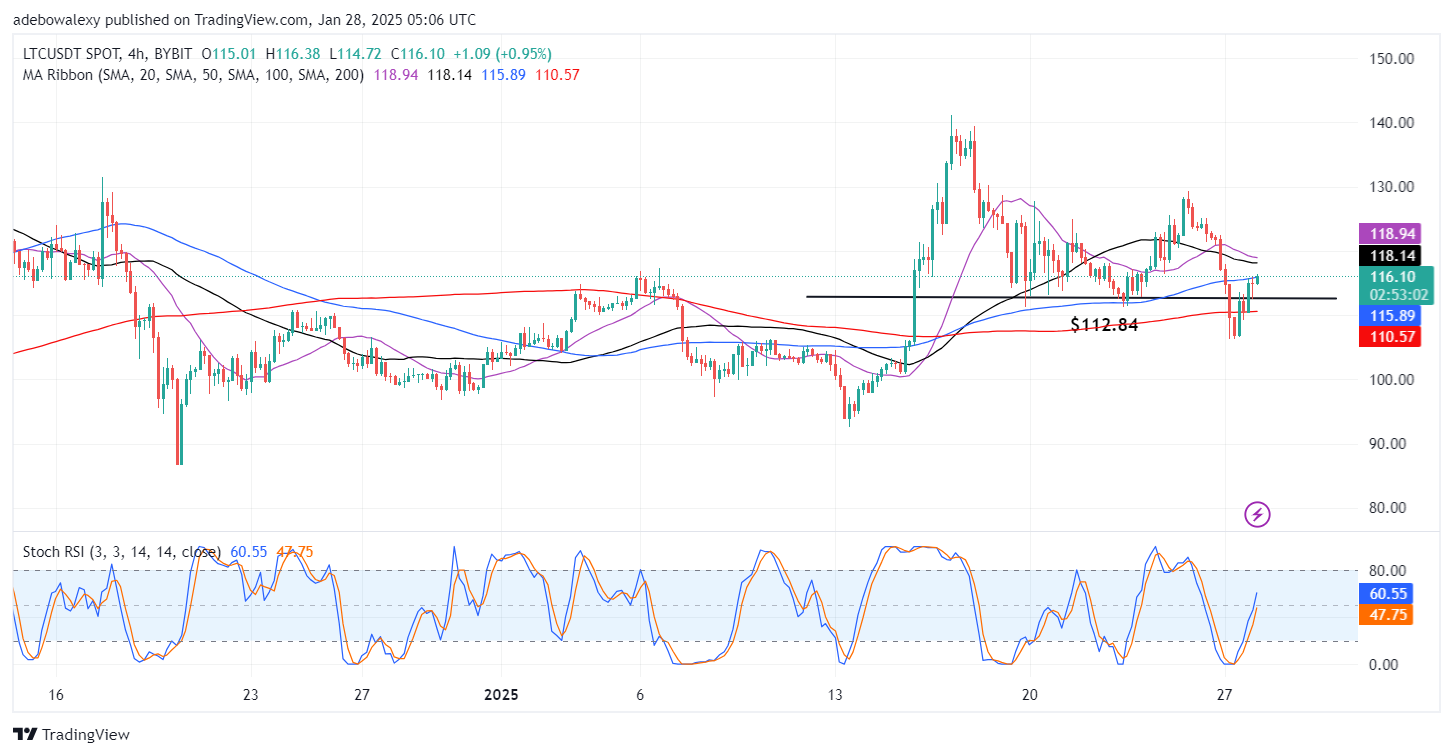
According to the 4-hour chart pattern, IMPTUSDT is doing well. The bears have been putting pressure on the cryptocurrency’s performance on the 4-hour chart. After the breakthrough in long-term consolidation. The price continues to increase. The $0.0065 resistance level was investigated on December 12. The sellers’ drive halted the gain, and it is currently probing the $0.0049 level.
It appears that sellers are in control because the price is trading below the Hull suite crypto signal. When the QQE MOD drops below the zero level, it represents a sell signal.
Buy IMPT token on Exchanges!: IMPT (IMPT)
Book today to receive points for your trip and avoid waiting! #ExploreWithIMPT
Just finished making my favorite dish 🍝✨
Now it’s time to plan my next adventure with the €50 gift waiting for me! 🌍✈️Where will you go next? Any destination is possible! 🗺️
Already part of the journey? Your €50 reward is ready!🎒 Don’t wait—book now and travel with… pic.twitter.com/s20VRd70Ko
— IMPT.io (@IMPT_token) January 28, 2025

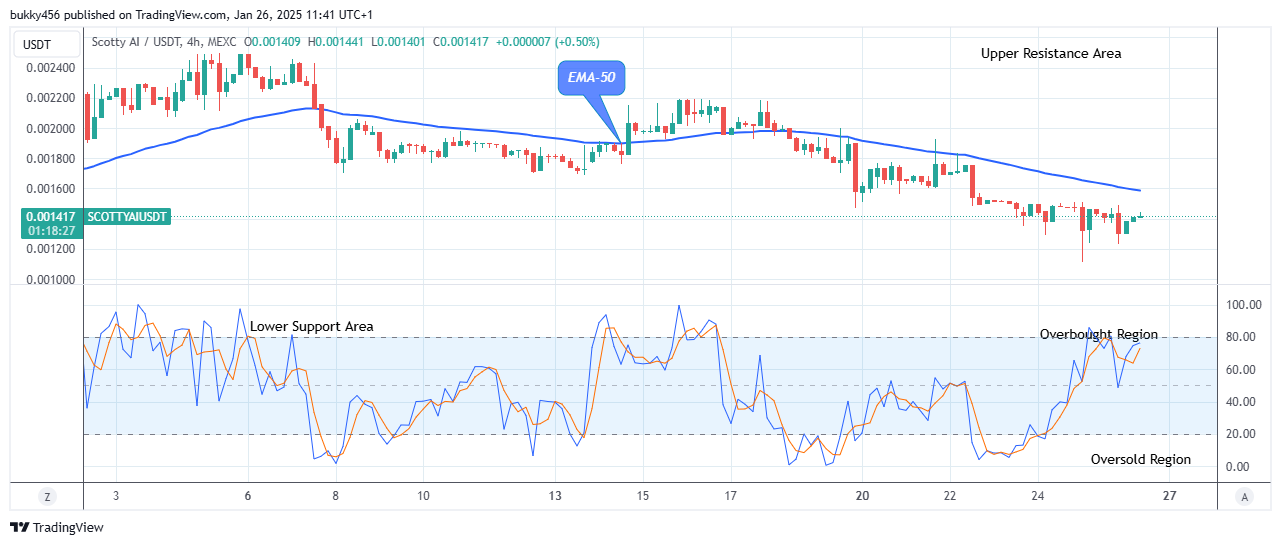 Actions from the short traders at a $0.0012 low value in the last session have dropped SCOTTYAIUSD’s price beneath the supply levels in its recent high.