Internet Computer (ICP/USD) Market Analysis Suggests Bullish Continuation

Internet Computer Price Prediction—December 29

ICPUSD market analysis suggests a bullish continuation as the price approaches a bullish order block. The impending bullish trend is further supported by price reactions at the $10.050 demand zone.

The ICPUSD chart presents a supportive outlook from indicators. The Relative Strength Index (RSI) currently sits at 44.73, indicating that the market is in a neutral zone and not oversold, leaving room for upward momentum. The 9-day Simple Moving Average (SMA) at $10.470 aligns closely with the current price at $10.140, acting as a dynamic resistance. This proximity suggests potential consolidation before a breakout. The RSI’s steady climb from earlier oversold levels supports a bullish scenario.  

ICP/USD Market Key Levels:

Resistance levels: $14.260, $16.280, $17.990
Support levels: $10.050, $6.800, $4.960

ICP/USD – Daily Chart

The ICP/USD daily chart shows that the market is almost oversold.

Analyzing price action, the pair recently tested support within the $10.050 demand zone, around the bullish order block (+OB). This region also aligns with a rising trendline that has consistently supported prices since mid-August.

Additionally, the price has been forming higher lows since September, a sign of strengthening bullish momentum. While the $11.000 level poses immediate resistance, the rejection at $10.800 suggests the price may retest the support zone before a stronger rebound occurs.  

Internet Computer (ICP/USD) Market Analysis Suggests Bullish Continuation

What is the projection for the ICPUSD market?

Projection-wise, a retracement to $9.000 could solidify bullish sentiment before an upward move toward $14.260, the next significant resistance level. Should this level break, ICPUSD could aim for $16.280 in the mid-term. The confluence of the rising trendline and support zone ensures a strong base for future price growth, and a successful hold above $10.000 may accelerate the bullish trajectory.

Internet Computer (ICP/USD) Market Analysis Suggests Bullish Continuation

ICP/BTC Price Analysis

The ICPBTC pair shows bullish potential with the RSI at 42.43, recovering from oversold conditions, signaling a likely upward move. Price recently rebounded from the key support zone at 0.0001000, aligning with a bullish order block.

The breakout above the descending trendline and the close above the 9-day SMA at 0.0001080 suggest growing bullish momentum. A successful push above the 0.0001180 resistance could target 0.0001400 and extend to 0.0001630.

Internet Computer (ICP) Current Statistics
The current price: $10.140
Market Capitalisation: $4,960,000,000
Trading Volume: $119,400,000

Place winning ICP trades with us. Get ICP here

Compound (COMP/USD) Undergoes a Bearish Trend

Price Analysis: COMP/USD Resumes a Bearish Trend Following the Rejection From the $123.70 Resistance

The COMP/USD pair has exhibited notable price movements throughout 2024, marked by significant volatility and trend reversals. After a sustained decline in early April, where the price dropped below the $66.00 demand level, the pair entered a consolidation phase, ranging between $66.00 and $38.40.

COMPUSD Key Levels

Demand Levels: $66.00, $38.40
Supply Levels: $92.30, $123.70

Compound (COMPUSD) Undergoes a Bearish Trend

A bullish breakout in early December 2024 signaled a potential recovery, with the price surpassing the $92.30 resistance level. This upward momentum continued briefly, allowing the pair to breach the $123.70 level. However, the breakout lacked strength, and the price faced immediate rejection. The reversal at $123.70 marked the end of the bullish phase, triggering a strong decline that breached the bullish trendline and reignited bearish momentum.

Technical indicators confirm the bearish outlook. The daily Moving Average (MA) reflects a bearish signal, as the price has fallen below the indicator. Additionally, the Relative Strength Index (RSI) on the daily chart shows declining momentum, further underscoring the dominance of sellers. On the 4-hour chart, the price initially regained the $92.30 supply level, but the subsequent bullish momentum was short-lived. The formation of a failed high indicates the growing likelihood of a continued downtrend.

Compound (COMPUSD) Undergoes a Bearish Trend

Market Expectation

Given the prevailing bearish signals, COMP/USD is expected to breach the $66.00 level, with the potential for further declines as bearish momentum intensifies.

You can purchase Lucky Block here.  Buy LBLOCK

Note: Cryptosignals.org is not a financial advisor. Do your research before investing your funds in any financial asset or presented product or event. We are not responsible for your investing results

Chainlink (LINK/USDT) Faces Rejection After Hitting the $25.99

Chainlink Long-term Analysis: Bullish

The market for Chainlink (LINK) against the Tether (USDT) has demonstrated significant volatility in previous weeks. This is evidenced in the retracement after a strong rally towards the $25.99 level.

However, recent price action shows that LINK/USDT has dropped by 3.53% compared to last week’s close. This pullback could be attributed to the broader crypto market sentiment and a cooling-off period before an explosive uptrend.

To this end, further decline may be on the horizon as the Guppy Multiple Moving Averages (GMMAs) and the Stochastic RSI suggest LINK/USDT is on a short-term pullback towards the $20.00 level.

Currently, Chainlink is trading at $21.30 with 38 million traded volumes.

Chainlink (LINK/USDT) Faces Rejection After Hitting the $25.99
LINKUSDT-Weekly Chart

Technical Indicators

Major Resistance Levels: $22.07, $22.54, and $23.00

Major Support Levels: $20.61, $19.71, and $18.08

Chainlink Technical Analysis

The analysis of Chainlink on a weekly timeframe shows that the coin is retracing after hitting $25.99, reflecting increasing seller’s dominance and suggesting a short-term correction. However, as the price tends towards the $20.00 level, the short-period EMAs seem to converge towards the long EMAs, indicating the bullish momentum may be waning. A breakdown toward $19.71 could signal a deeper correction, while a rebound above $22.07 would confirm a renewed bullish interest.

Furthermore, the Stochastic RSI at the bottom of the chart suggests LINK/USDT oscillates in the overbought region but is beginning to cool off. This is seen in the placement of the orange and blue lines.

However, a sustained movement to the south would indicate a further downtrend.This will reshape the overall sentiment and signal a correction towards $19.71 and $18.08. Conversely, a pause at the 50-mark level with strong bullish pressure would lead to an upside reversal.

LINK/USDT Analysis: What to Expect

During the daily timeframe, the analysis of LINK/USDT shows that the pair is oscillating around the $21.31 and $21.56 levels after a recent rally. This suggests a potential shift in the near term.

The chart shows that the GMMAs are intertwined, suggesting a potential reduction in the bullish strength. However, a break below $20.36 would indicate increased bearish pressure; otherwise, a rebound may be expected if the price holds above the current level.

To this end, the Stochastic oscillator shows the pair is currently oversold with extremely low values. This may be an indication of a potential bounce point; otherwise, if the lines remain in the oversold region, it could imply a continued downtrend.

Chainlink (LINK/USDT) Faces Rejection After Hitting the $25.99
LINKUSDT-Daily Chart


You can purchase crypto coins here. Buy LBlock

Top Trending Coins for Today, December 29: HBAR, ATA, XVG, BNB and STEEM

In this week’s top trending markets, most cryptocurrencies have shown credible bullish recoveries over the past 24 hours. These movements suggest that many markets may be gearing up for a significant bounce or breakout in the coming week.

Insights from CoinMarketCap reveal that the overall cryptocurrency market is demonstrating a notable recovery, signaling a potential bullish outlook for the week ahead.

Without further ado, let’s dive into the analysis of each market.

Hedera (HBAR)

Major Bias: Bullish

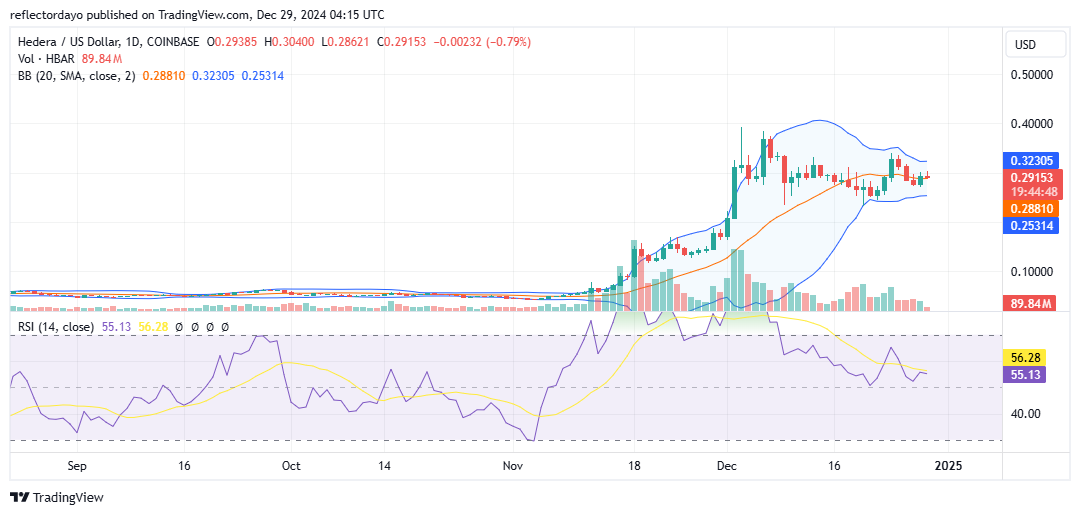
In the Hedera market, the price briefly fell as bearish momentum gained traction. However, buyers resisted a full surrender, preventing the sellers from driving the market further downward. The bulls identified a pivotal support level at $0.24, initiating a significant rebound that momentarily pushed the price above the critical resistance level of $0.30.

This bullish momentum was short-lived, as the market formed a lower high and subsequently dropped below the $0.30 mark. In response, the bulls regained strength, creating a bounce at a higher support level of $0.27.

These price movements have led to the formation of a symmetrical triangle pattern, highlighting the convergence of support and resistance levels. This pattern often indicates a potential breakout in either direction. Currently, the price action suggests possible consolidation around the $0.30 level, as trading volume histograms show declining activity.

Additionally, the convergence of the Bollinger Bands indicates that the market may soon establish a clearer price direction following this period of consolidation.

Current Price: $0.29

Market Capitalization: $11 billion

Trading Volume: $796 million

Top Trending Coins for Today, December 29: HBAR, ATA, XVG, BNB and STEEM

Automata Network (ATA)

Major Bias: Bullish

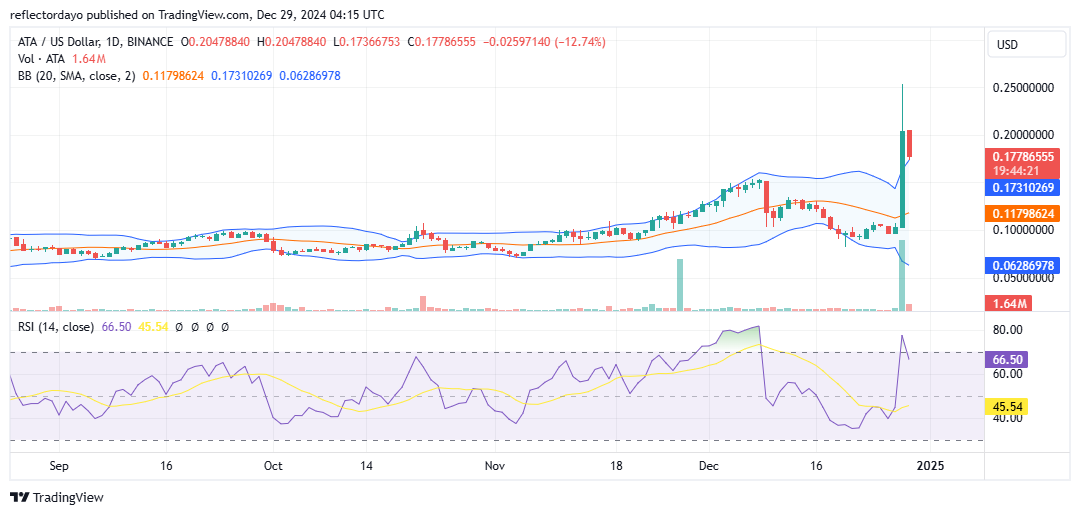
Over the past 24 hours, the Automata Network experienced a sharp surge, with its price skyrocketing from $0.10 to a peak of $0.25. This sudden and strong price movement triggered explosive volatility, strengthening bearish activity and leading to a significant correction. Currently, the price stands at $0.17.

Notably, the bearish candlesticks display prominent lower shadows, indicating that bulls are beginning to push back at this level. This suggests the potential formation of a higher support level around $0.17. If this support holds, the market may be poised for a renewed upward trajectory.

Current Price: $0.179

Market Capitalization: $96 million

Trading Volume: $604.7 million

Top Trending Coins for Today, December 29: HBAR, ATA, XVG, BNB and STEEM

Verge (XVG)

Major Bias: Bullish

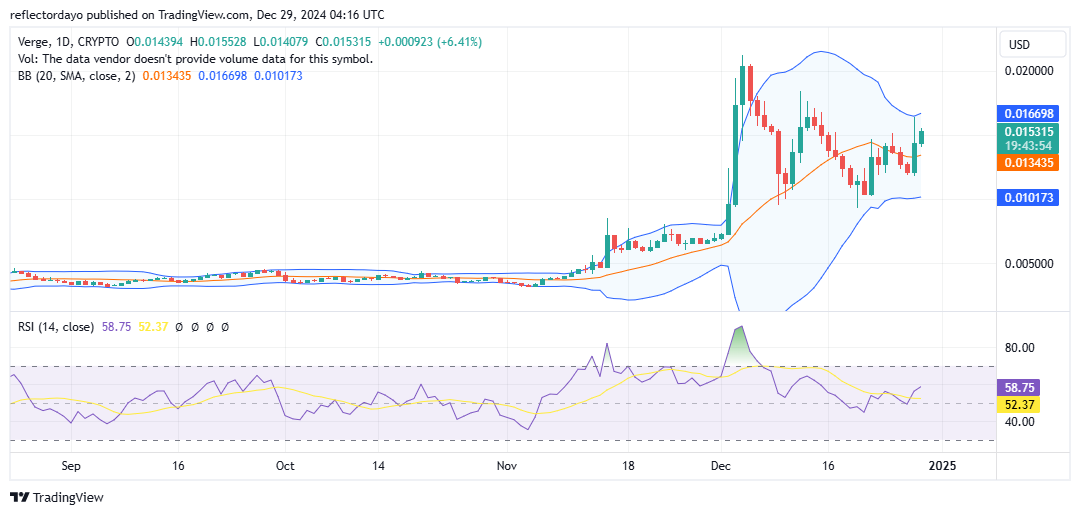
The Verge market recently experienced a surge of bullish momentum, with prices peaking at $0.02, triggering heightened volatility. Following this explosive rally, bulls established a new higher support level at $0.0100, demonstrating their resilience and determination to maintain upward momentum.

A more recent support level has emerged at $0.012, further affirming the bulls’ strength. However, it is essential to note the presence of descending peaks, suggesting a potential convergence of the market around the $0.015 price level.

This market development points to the formation of a symmetrical triangle pattern, which typically precedes a period of consolidation. This likelihood is supported by the declining trading volume, indicating reduced market activity.

Current Price: $0.0148

Market Capitalization: $246 million

Trading Volume: $201 million

Top Trending Coins for Today, December 29: HBAR, ATA, XVG, BNB and STEEM

BNB (BNB)

Major Bias: Indecision

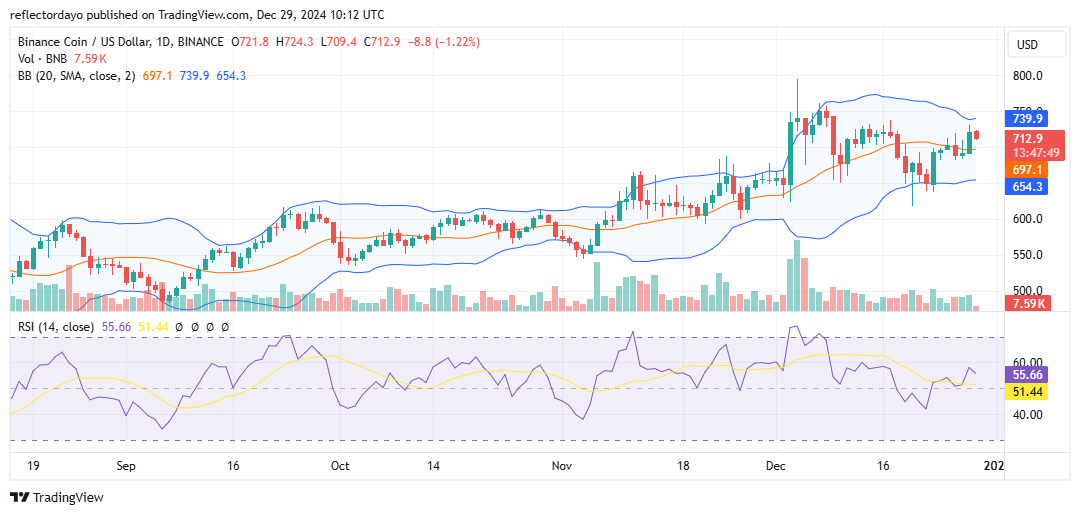
Since September, the BNB market has exhibited a prevailing bullish trend. Although there has been substantial profit-taking during this period, the bulls have continued to maintain dominance. A closer analysis of the market through indicators and chart patterns reveals a consistent formation of higher lows since September, underpinning the market’s upward trajectory.

In early December, the market experienced a significant bullish surge, with prices climbing sharply and peaking near $800. This rapid rally, occurring within just two daily sessions, led to a notable correction driven by profit-taking. Despite this, bulls established a strong support level around $650, preventing the bears from pushing the market further downward.

Currently, the market has stabilized within the $650 to $750 channel, where demand and supply are balanced, leaving bulls and bears evenly matched. This consolidation has caused the price action to converge around $712. The Bollinger Bands indicator further illustrates this stabilization, as the bandwidth continues to narrow, signaling reduced market volatility and a potential equilibrium.

Current Price: $713

Market Capitalization: $102.5 billion

Trading Volume: $1.93 billion

Top Trending Coins for Today, December 29: HBAR, ATA, XVG, BNB and STEEM

Steem (STEEM)

Major Bias: Bullish

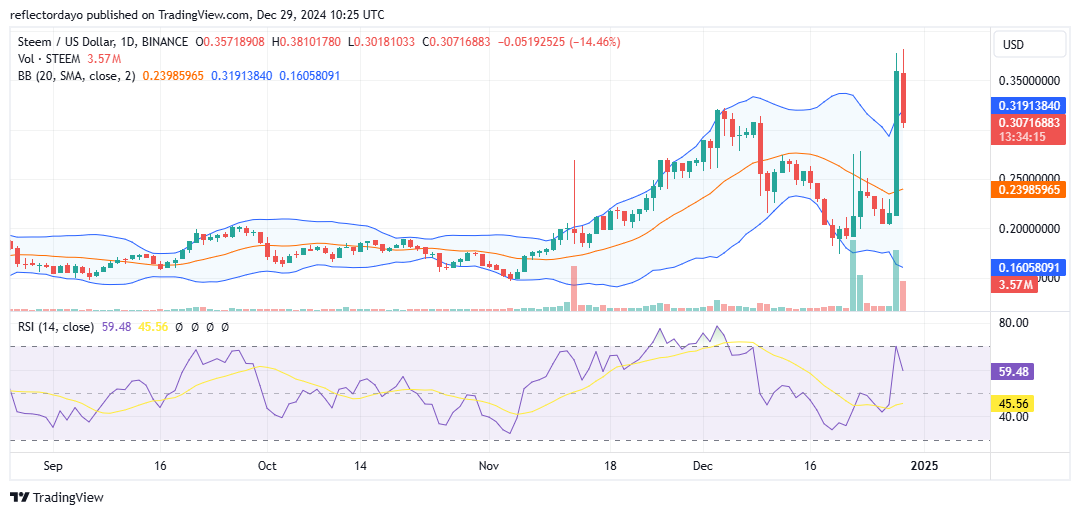
Over the past 24 hours, the Steem market experienced an explosive surge in price action, decisively breaking above the critical $0.30 resistance level. Previously, this level served as a formidable barrier during the last bullish run and marked the peak of that rally before triggering a bear market.

During the subsequent bearish phase, bulls managed to establish support at the $0.20 level. While this low is not significantly higher than the previous one, it nonetheless reflects a slight upper hand for buyers in the market.

In the latest 24-hour session, the market’s significant surge not only breached the $0.30 resistance level but also established it as a new higher support. This development signals continued bullish progression. The bounce at $0.30 indicates strong buyer confidence, making it unlikely for bears to push the market below this level in the short term.

However, traders should remain cautious due to heightened market volatility. It may be safer to invest after the volatility subsides, as prices could consolidate around $0.30. Should this consolidation occur, the market’s next move is likely to be upward.

Current Price: $1.50

Market Capitalization: $258 million

Trading Volume: $2.6 billion

Top Trending Coins for Today, December 29: HBAR, ATA, XVG, BNB and STEEM

Trade crypto coins on BYBIT!

Blockchain Associations Files Lawsuit Against IRS New Crypto Brokers’ Rules

New regulations aimed at digital asset transactions have been introduced by the Internal Revenue Service (IRS) of the United States. This is done to maintain tax compliance, as these rules are scheduled to go into force in 2027. It mandates that brokers disclose sales of digital assets, including user information.

However, crypto supporters view this action as a danger to privacy and innovation, despite the IRS’s assertion that it will increase transparency.

In response, groups like the Blockchain Association and Texas Blockchain Council have taken to their X (formerly Twitter) on the 28th of December, expressing their feelings. To this end, the blockchain associations are suing the IRS, arguing that the rules overstep legal boundaries.

IRS Rules for Brokers in the Crypto World

As of the 27th of December, the IRS has broadened the definition of “broker” to encompass platforms such as decentralized finance (DeFi) platforms and decentralized exchanges (DEXs).

In light of this, DeFi platforms may need to notify the IRS of a user’s activities if they enable transactions or exercise control over them. However, critics counter that this treats software engineers like financial middlemen, unfairly burdening them.

Blockchain Associations Files Lawsuit Against IRS New Crypto Brokers' Rules

As a result, these new regulations may deter blockchain technology innovation and cause developers to be reluctant to create platforms if their job entails onerous compliance obligations. Additionally, the IRS’s expansive definition of “broker” may deter blockchain and DeFi initiatives from the US, pushing innovation abroad.

Concerns About Privacy and Legal Challenges

The Blockchain Association and other crypto-related organizations are retaliating against these new guidelines. They contend that these regulations violate current legislation and may harm the country’s position in the cryptocurrency industry.

To this end, crypto proponents caution that penalizing developers based on how users use their tools is risky and may impede innovation, citing instances such as the imprisonment of Tornado Cash developer Alex Pertsev.

Privacy advocates argue that these laws violate users’ rights by requiring platforms to share sensitive data, emphasizing that decentralized systems should prioritize user control and privacy. However, the IRS’s decision violates this concept. Legal professionals are concerned that these rules would harm the growing decentralized finance industry and deter users from using these platforms.

The IRS’s new crypto regulations have triggered a contentious discussion about privacy, innovation, and regulation. To this end, critics contend that these laws, intended to assure tax compliance, may affect innovation in the United States, violating user privacy. Finally, the future of blockchain innovation and decentralized finance (DeFi) in the U.S. is up in the air as legal disputes continue.


In order to place winning trades with us via Bybit, you can open an account here.

Near Protocol (NEAR/USD) Market Signals Bullish Reversal After Reaching Critical Support Levels

Near Protocol Price Forecast – December 27

NEAR/USD market signals bullish reversal after reaching critical support levels. The impending bullish move is likely to continue beyond the $6.490 resistance.

The Relative Strength Index (RSI) at 40.42 indicates that NEARUSD is recovering from oversold conditions, suggesting the potential for bullish momentum. The 9-day Simple Moving Average (SMA) at $5.240 is turning flat, indicating that the bearish trend may be losing strength. These signals support a reversal in sentiment, with buyers likely stepping in near current price levels.

NEAR/USD Market Key Levels:

Resistance levels: $6.490, $8.000, $8.520
Support levels: $4.300, $3.070, $2.450

NEAR/USD – Daily Chart

The daily chart for NEARUSD shows an impending reversal to the upside.

NEARUSD has rebounded from the Fibonacci 0.786 level at $4.560, confirming it as a strong support zone. The price has started to form higher lows, and a push above $5.310 (the 0.618 Fibonacci level) will strengthen the bullish case. Key resistance lies at $6.490, a previous swing high.

Near Protocol (NEAR/USD) Market Signals Bullish Reversal After Reaching Critical Support Levels

What is the outlook of NEARUSD?

Given the technical setup, NEARUSD is projected to continue its bullish movement toward $6.490 in the near term. A breakout above this level could extend the rally to $8.520, with $10.000 as a long-term target. However, any failure to hold above $5.240 could see a retest of $4.560 low, making it crucial for the bulls to maintain current momentum.

Near Protocol (NEAR/USD) Market Signals Bullish Reversal After Reaching Critical Support Levels

NEAR/BTC Price Analysis

NEARBTC is rebounding from a significant support level near 0.00005230, suggesting a potential bullish momentum. The pair targets the short-term order block (OB) around 0.00007000, which acts as a resistance zone.

The RSI is recovering from the oversold region, indicating buyers’ strength. A break above 0.00007000 could signal a continuation of the upward trend.

Near Protocol (NEAR) Current Statistics
Current price: $5.090
Market Capitalization: $6,330,000,000
Trading Volume: $298,340,000

Place winning NEAR/USD trades with us. Get NEAR here

Bitcoin (BTC/USD) Market Indicates Bearish Pressure Across Key Technical Levels

Bitcoin Price Prediction – December 26

BTCUSD market indicates bearish pressure across key technical levels. The market seems to be heading downward in a bid to fill the liquidity void.

The 9-day Simple Moving Average (SMA) at $96,590 is currently acting as a resistance level, indicating that short-term momentum is aligned with the downward direction. Additionally, the Relative Strength Index (RSI) is at 42.69, which reflects a weakening buying pressure and supports the bearish sentiment as it approaches the oversold region. These technical indicators collectively suggest a continuation of bearish momentum in the short term.

BTC/USD Market Key Levels:

Resistance Levels: $100,000, $108,390, $115,000
Support Levels: $90,000, $85,010, $73,840

BTC/USD – Daily Chart

The BTCUSD daily chart shows that the market is now in a bearish trend.

BTCUSD has broken below the psychological $100,000 level and is now trading near $93,440. This move confirms the breach of the ascending support trendline, leaving a significant liquidity void below.

The price is approaching the next key support zone around $90,000, with further downside potential toward $85,010 if bearish momentum persists. The recent rejection from the $100,000 resistance underscores the selling pressure in the market.

Bitcoin (BTC/USD) Market Indicates Bearish Pressure Across Key Technical Levels

What is the likely projection of BTCUSD?

Given the prevailing bearish indicators and broken support levels, BTCUSD is projected to test $90,000 in the coming sessions. A sustained breach below this level could accelerate the drop toward the $85,010 liquidity void, with $73,840 and $66,780 emerging as deeper targets. However, any short-term pullback would likely face strong resistance at $96,590, keeping the overall trend bearish unless a clear breakout occurs above $100,000.

Bitcoin (BTC/USD) Market Indicates Bearish Pressure Across Key Technical Levels

BTC/USD – Four-Hour Chart

BTCUSD on the four-hour chart exhibits a bearish structure, with the price trading below the 9-period Simple Moving Average (SMA) at $95,470. The recent Change of Character (CHoCH) and Buy Side Liquidity grab indicate strong selling pressure. The Relative Strength Index (RSI) at 38.36 reflects weak momentum and suggests room for further downside movement.

Bitcoin (BTC) Current Statistics
The current price: $93,440
Market Capitalization: $1,870,000,000,000
Trading Volume: $52,380,000,000

You can purchase Bitcoin here. Buy BTC

Shiba Inu Bearish Momentum Builds as Price Faces a Potential Breakdown

Price Analysis: SHIBUSD Bearish Momentum Strengthens Amid Consolidation and Trend Reversal Patterns

Shiba Inu (SHIBUSD) has experienced significant market shifts, characterized by a pronounced bearish decline from the $0.00002930 supply level in late May 2024. This marked the initiation of the latest bearish phase as the price transitioned into a consolidation period. However, bullish momentum resurfaced, driving the price above the $0.00001870 support level and scaling up to $0.00002930, breaching the prior resistance.

Shiba Inu Key Levels

Demand Levels: $0.00001870, $0.00001130
Supply Levels: $0.00002930, $0.00003700

COINBASE:SHIBUSD Chart Image by jereminze312

Despite this upward movement, the bullish momentum was short-lived. The price reversed below the $0.00002930 supply level, retreating towards the $0.00001870 support. Along this trajectory, the market formed a head and shoulders pattern—a classic bearish trend indicator—signaling a shift in sentiment. This pattern further emphasized the weakening bullish momentum and the increasing dominance of sellers.

On the 4-hour timeframe, bearish price action has been reinforced as the market continues to print lower lows. Following a brief resurgence of bullish activity triggered by a rejection at the $0.00001870 support level, the momentum failed to sustain. A double-top pattern emerged, underscoring a strong bearish reversal and resumption of the downward trend.

The prevailing bearish momentum indicates the likelihood of further declines. The $0.00001870 support level, which has been tested multiple times, is anticipated to be breached as sellers maintain control. A breakdown below this critical level could open the path for SHIBUSD to target new lows, potentially intensifying the bearish sentiment.

COINBASE:SHIBUSD Chart Image by jereminze312

Market Expectation

The SHIBUSD market is poised for further declines as bearish momentum intensifies. It is advised to monitor the $0.00001870 support level closely, as its breach could signal the continuation of the downtrend. Key resistance levels, including $0.00002930, will likely act as barriers to any bullish recovery attempts in the near term.

You can purchase Lucky Block here. Buy LBLOCK

NoteCryptosignals.org is not a financial advisor. Do your research before investing your funds in any financial asset or presented product or event. We are not responsible for your investing results.

Enjin Coin Buyers Struggle Amid Persistent Selling Pressure

ENJUSD Analysis – Enjin Buyers Fight to Regain Stance

Enjin Coin buyers struggle amid persistent selling pressure. ENJUSD buyers are trying to hold their ground against selling pressure, currently trading near the $0.20630 significant level. Despite recent attempts at recovery, bearish momentum remains dominant.

Enjin Coin Key Levels

Resistance Levels: $0.25000, $0.40000
Support Levels: $0.20000, $0.18000

Enjin Buyers Struggle Amid Persistent Selling Pressure
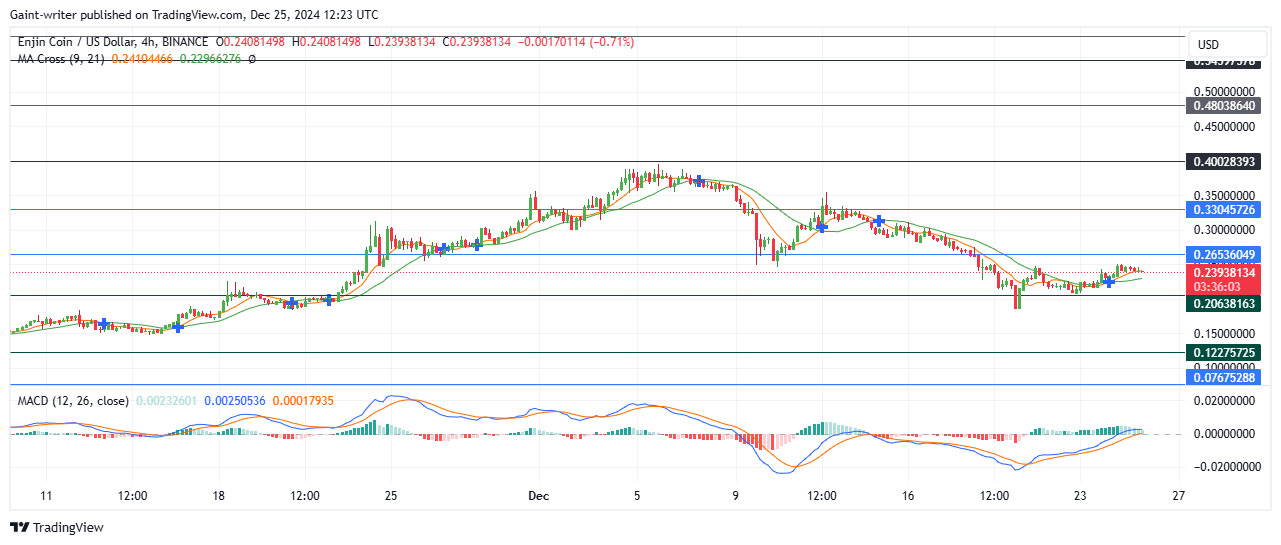
Enjin Coin buyers had a strong rally earlier this year, breaking out of a 4-month consolidation to reach the $0.40000 market zone. However, bearish momentum took control last month, driving the price down to the $0.20000 key level. This week, buyers have attempted to correct the decline but are facing significant resistance from sellers.

The Moving Average Crossing indicator favors the sellers, showing a downward direction. Additionally, the MACD (Moving Average Convergence and Divergence) continues to reflect bearish momentum, signaling that sellers still hold the upper hand. If bearish momentum persists, ENJUSD could retest the $0.20000 support level. A breakdown below this zone may lead to further declines toward $0.18000.

On the other hand, if buyers manage to regain control, the price could rebound toward the $0.25000 resistance level, with a potential extension to $0.30000 if bullish strength builds. Traders should watch for confirmation from the MACD and Moving Average indicators, as a bullish crossover would be required to signal a potential reversal.

Enjin Buyers Struggle Amid Persistent Selling Pressure

Market Expectation

In the shorter time frame, the market remains under selling pressure, with the MACD still signaling a bearish atmosphere. Buyers are making efforts to regain strength, but bearish momentum continues to dominate. If buyers can sustain their push, ENJUSD might rise toward $0.22000 in the medium term. However, failure to overcome the current resistance could result in further consolidation or a dip back to $0.20000.

You can purchase Lucky Block here.  Buy LBLOCK

Note: Cryptosignals.org is not a financial advisor. Do your research before investing your funds in any financial asset or presented product or event. We are not responsible for your investing results