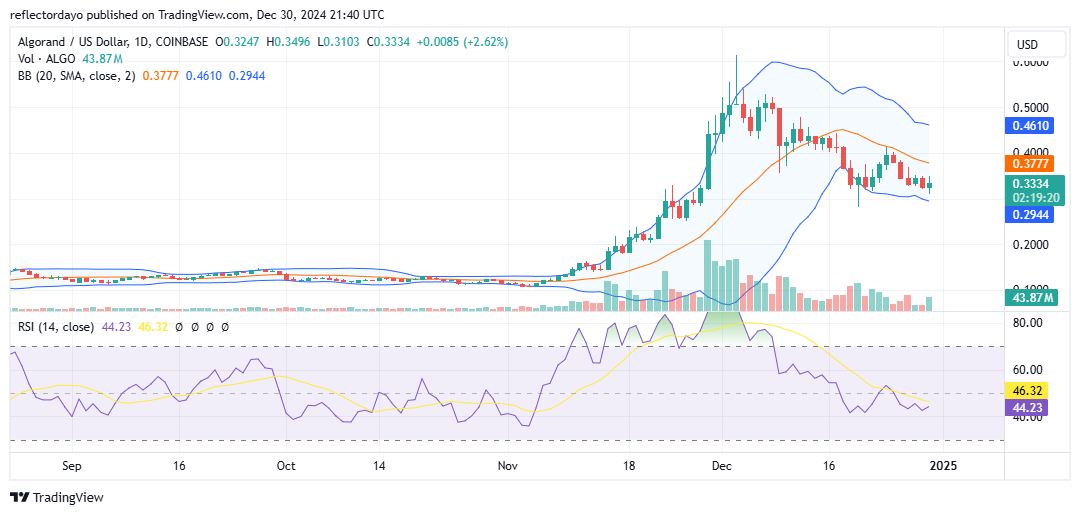
Algorand’s bullish run began in early November, gaining significant momentum toward the end of the month. The bull market peaked at $0.60 on December 3. At this high, profit-taking was triggered, leading to a market downturn characterized by lower lows, signaling the onset of a bearish trend.
During the previous bullish run, the $0.30 price level emerged as a critical resistance point. However, with the price having bounced off this level twice, it is now establishing itself as a strong support level. This shift indicates that bullish momentum is consolidating around this key level. Consequently, a bounce or rally from this support level may be imminent.
Algorand Market Data
- ALGO/USD Price Now: $0.338
- ALGO/USD Market Cap: $1,463,246,288
- ALGO/USD Circulating Supply: 8,006,635,788 ALGO
- ALGO/USD Total Supply: 8,006,635,788 ALGO
- ALGO/USD CoinMarketCap Ranking: #48
Key Levels
- Resistance: $0.400, $0.450, and $0.500.
- Support: $0.300, $0.25, and $0.200.
Algorand Market Forecast: Analyzing the Indicators
The historical significance of the $0.30 price level, combined with the fact that price action has bounced off this level twice, indicates that bulls are consolidating their position around it. The repeated rejection of the Algorand bearish pressure at this level reinforces the strength of the support, suggesting that bears may be losing confidence in driving the market further downward.
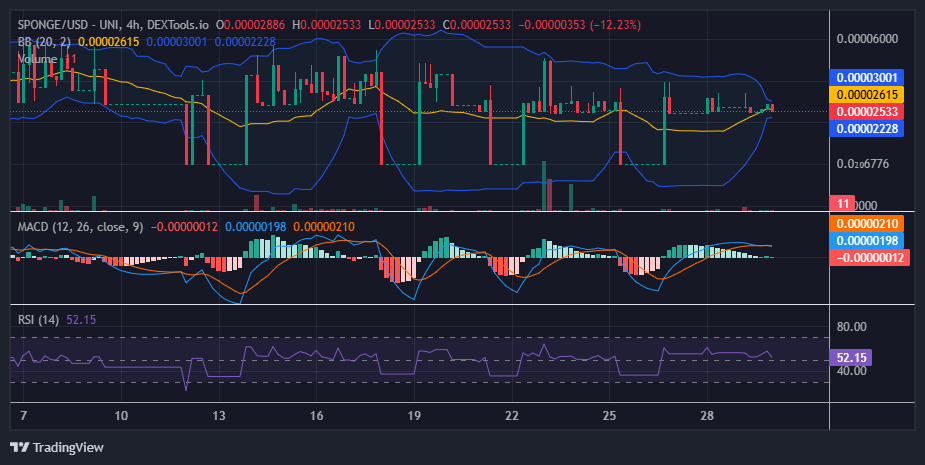
The current price chart reveals the emergence of a consolidation phase. If this phase persists, the Bollinger Bands are likely to narrow, signaling reduced crypto market volatility. This contraction often precedes a significant price movement in a clear direction.
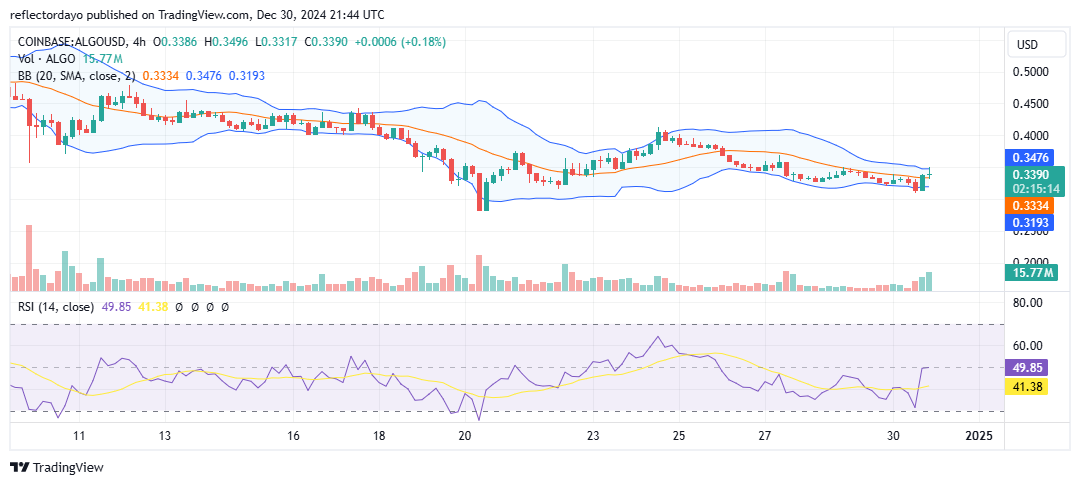
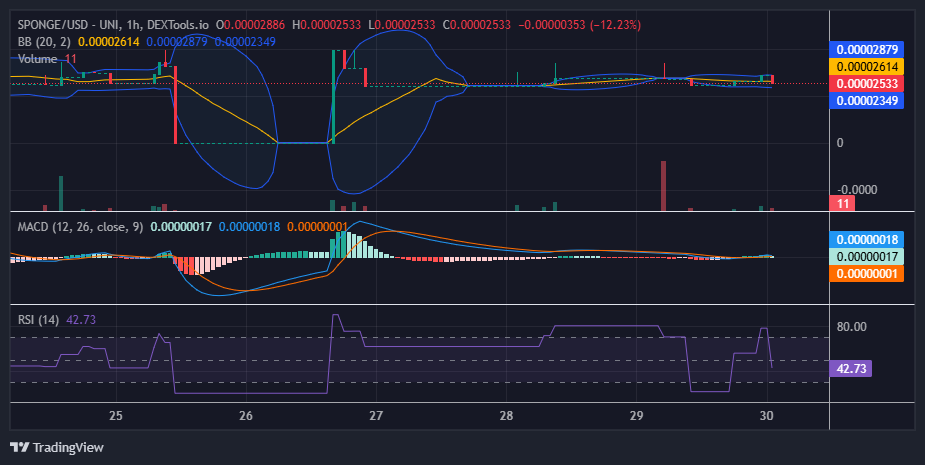
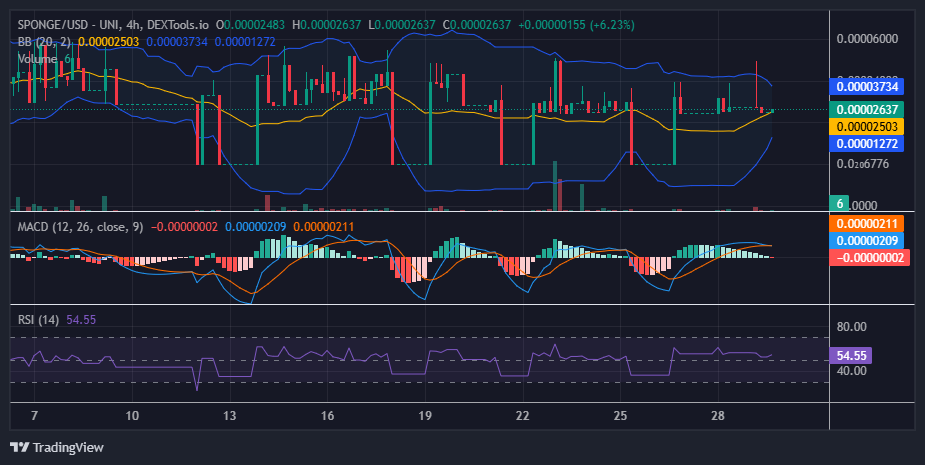
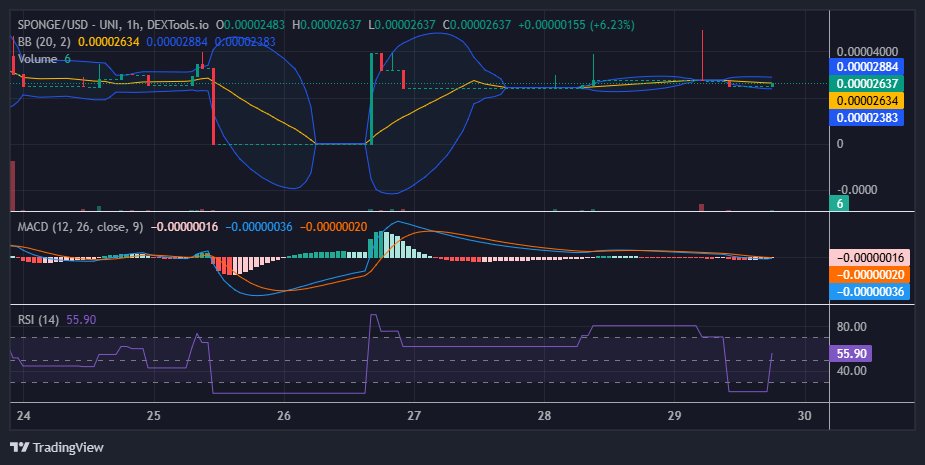
ALGO/USD 4-Hour Chart Outlook
From a smaller timeframe perspective, the Bollinger Bands have converged into a narrow price channel, indicating a balance between supply and demand. As observed in the chart, the RSI is positioned near the midpoint of the indicator, reflecting market indecision.
While the price remains stagnant at the current level, trade volume indicators display strong histograms, highlighting the ongoing struggle between bulls and bears to gain control. However, this stalemate near a key support level suggests a higher probability that the next significant market move could be to the upside.