Zksync (ZK/USDT) Eyes Potential Breakout in the Near Term

In recent months, the market for Zksync against the Tether has experienced a consolidation phase characterized by interwoven Guppy Multiple Moving Averages (GMMAs). This shows that the pair has been oscillating within a close range before a previous rally towards the $0.2000 level.

Recent price movement shows that the pair is poised for a potential price breakout as suggested by both indicators on the chart below. However, as the ZK/USDT market remains directionless, it presents an opportunity for traders to capitalize on a potential breakout.

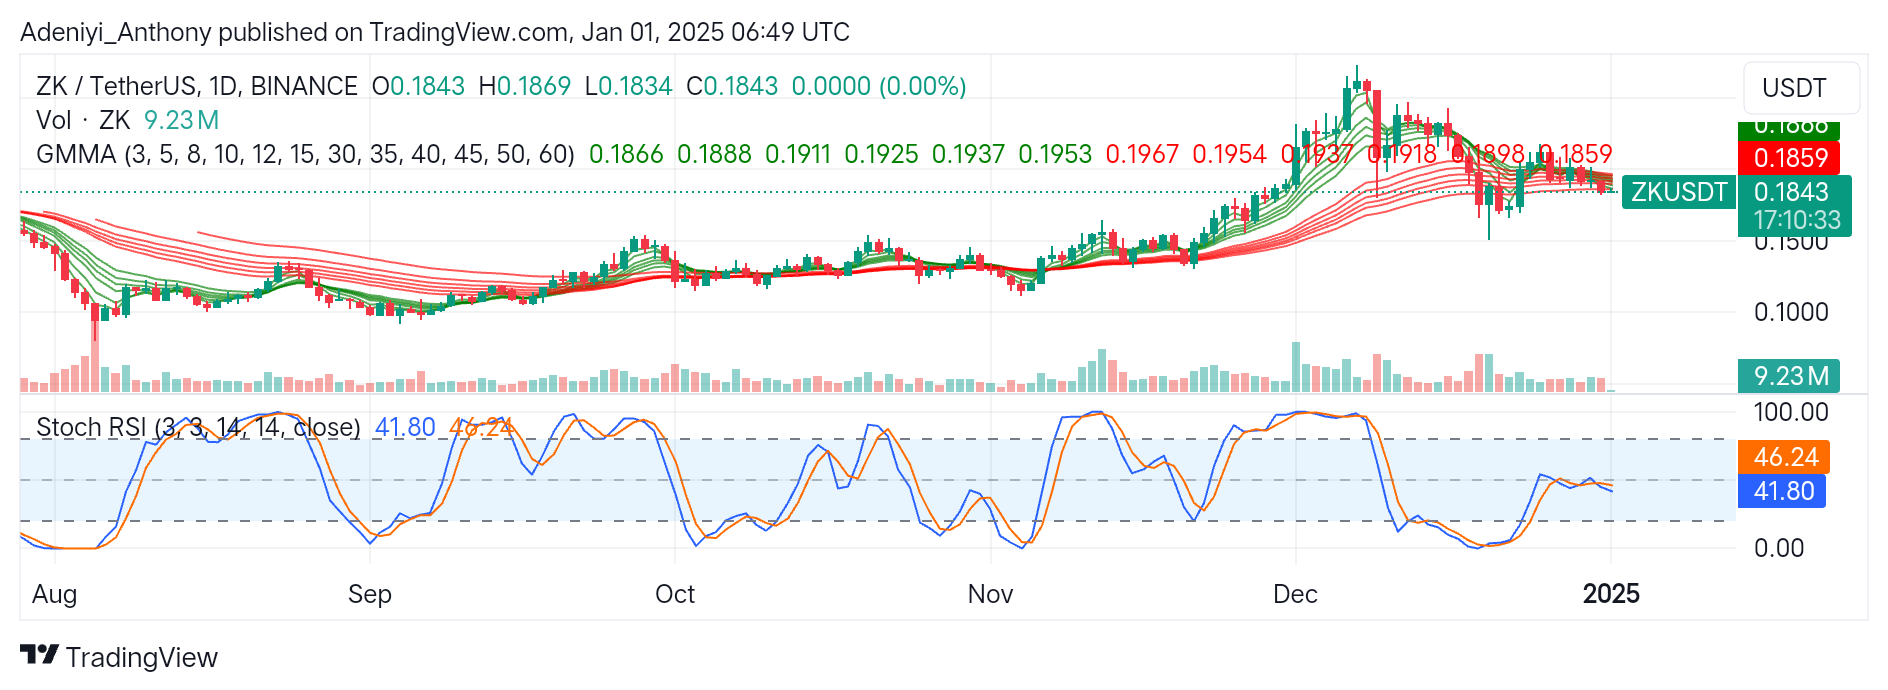
Currently, ZKsync is trading at $0.1843 with over 9 million traded volumes for the day.

Zksync (ZK/USDT) Eyes Potential Breakout in the Near Term
ZKUSDT-Daily Chart

Technical Indicators

Major Resistance Levels: $0.1918, $0.1967, and $0.2050

Major Support Levels: $0.1800, $1730, and $0.1650

Zksync Technical Analysis

The analysis of Zksync against the Tether on a daily timeframe shows that the pair currently lacks direction as seen in the interlocked GMMAs, suggesting potential for a breakout to either side. To this end, a break above $0.1967 could materialize with increased trading volumes; otherwise, a break below the immediate support level would signal momentum loss and an extended bearish move.

Additionally, the parallel Stochastic RSI near the midline further shows the ZK/USDT lacks direction. However, with the lines reading figures lower than 50, a bearish position is signaled if the oscillator reads lower figures. Conversely, an improved figure above the 50-mark level would suggest a reversal towards previous highs.

ZK/USDT Analysis: What’s Next?

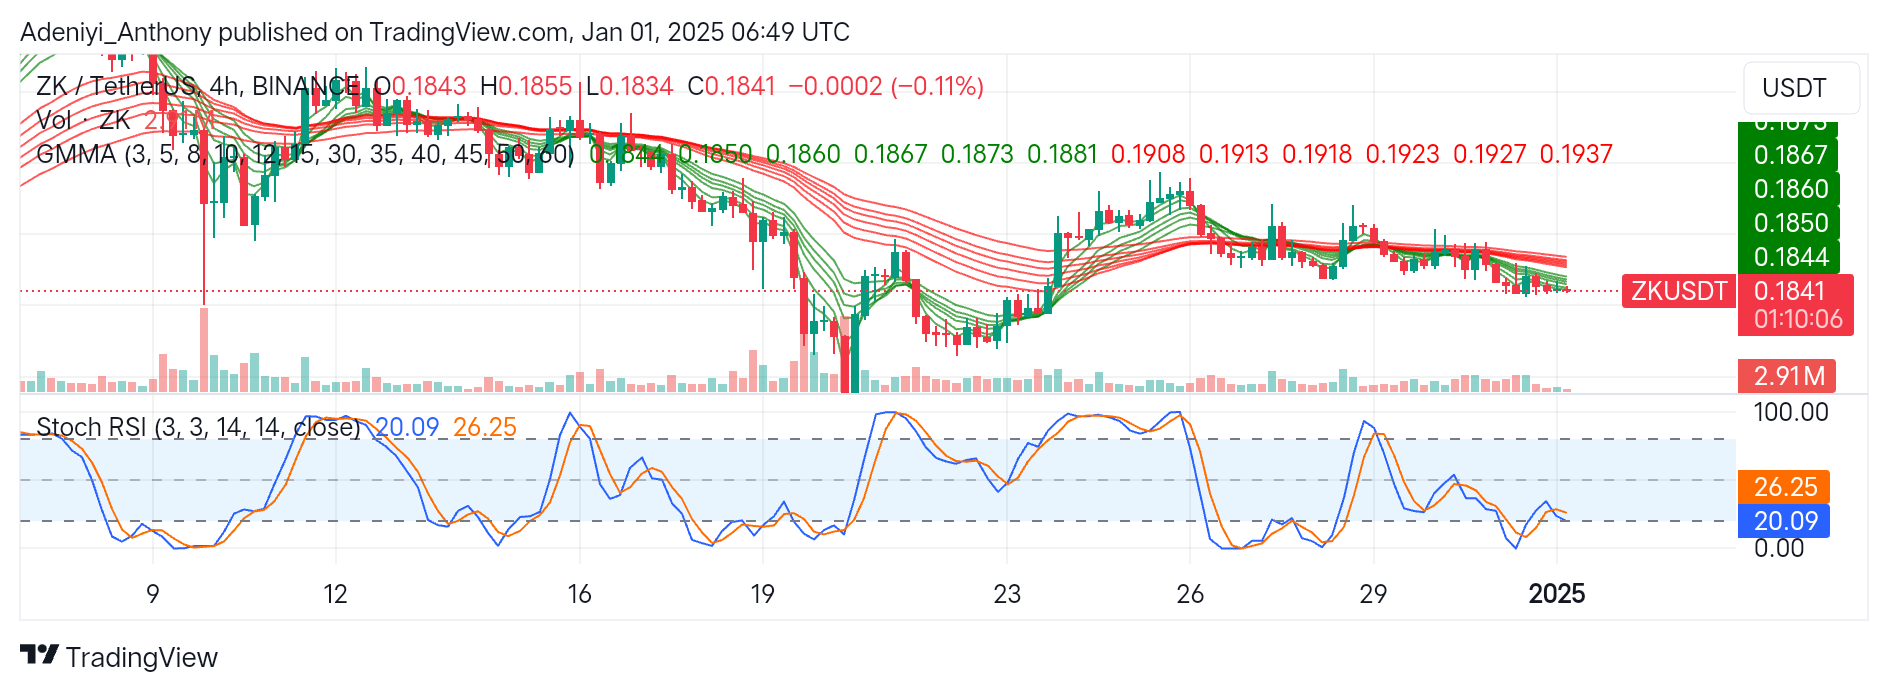
On the 4-H timeframe, ZK/USDT shows a bearish bias. The recent price deepening below the sets of EMAs shows that the market lacks bullish momentum to sustain an upside movement. Additionally, the Stochastic RSI indicates the pair operates deep in the oversold region.

To this end, for a bullish reversal, the price needs to break above $0.1830 with a bullish crossover of the oscillator’s line; a sustained move below $0.1830 with an increase in selling volume would signal further downside towards $0.1800.

Zksync (ZK/USDT) Eyes Potential Breakout in the Near Term
ZKUSDT-4H Chart


You can purchase crypto coins here. Buy LBlock

Bitcoin (BTC) Price Prediction: BTC/USDT Seems Trapped Between $95,000 and $92,200

Bitcoin (BTC) Price Prediction (January 1):

After the Bitcoin market reached its all-time high around the $109,000 price level, we can see that the market has been spiraling downwards. The market has been falling to lower lows. However, recent price movement suggests that price activity may have hit a strong baseline at the $92,200 price level.

BTC/USDT Long-Term Trend: Bearish (Daily Chart)

Key Price Levels:

Resistance: $95,000, $100,000, $104,000

Support: $90,000, $85,000, $80,000

Bitcoin (BTC) Price Prediction: BTC/USDT Seems Trapped Between $95,000 and $92,200

Price activity in the Bitcoin daily market has rebounded off the support level at the $92,200 price level. The corresponding price candle to the previous session has contracted downward but retains some of the recorded gains till the end. However, the ongoing session has appeared as a heavily compressed green price candle. Nevertheless, the Stochastic Relative Strength Index (RSI) continues to rise slightly upwards from the oversold region.

Bitcoin (BTC) Price Prediction: BTC/USDT Minimal Gains May Be Erased

The Bitcoin market has an upward trajectory, but a slight one, ever since its price action rebounded off the $92,200 price level. Also, the convergence of the 20- and 50-day Moving Average (MA) lines can be seen to be converging steadily above price action.

As a result, the last price candle appears heavily compressed. Be that as it may, the lines of the Stochastic RSI are rising upward from the depth of the oversold region. At this point, price movement still calls for more critical examinations, perhaps on a smaller price time frame for the purpose of spotting short-term opportunities.

Bitcoin (BTC) Price Prediction: BTC/USDT Downward Forces Seek Dominance (4-Hour Chart)

Coming to the Bitcoin 4-hour price chart, it is revealed that price action remains largely under the influence of downward forces. This opinion is derived from the fact that price action has fallen below all the MA lines. In addition, the last price candle has appeared bearish, although it continues to lurk around the 20-day MA curve.

Bitcoin (BTC) Price Prediction: BTC/USDT Seems Trapped Between $95,000 and $92,200

The Stochastic RSI lines also have a downward trajectory and have fallen through the 80 mark of the indicator. The lead line of the indicator seems a bit deflected towards a crossover, but there lies some distance between the two lines of the indicator. Therefore, market participants can assume that this market has a short-term bearish outlook towards the $92,000 support price level.

Get Bitcoin (BTC) here. Buy BTC

Dash 2 Trade Price Predictions for Today, January 1: D2TUSD Price Remains Pressured above the $0.00135 High Value

Dash 2 Trade Price Forecast: D2TUSD Price Remains Pressured above the $0.00135 High Value (January 1)

With the New Year kicking off today, Dash 2 Trade is back in the green again as the price remains pressured above the $0.00135 high value. The coin is currently attempting to avoid falling by resisting sellers; however, if the bulls’ pressure breaks through the resistance level of $0.00430, the coin price may rise further to a $0.01000 high trend line, representing a significant turnaround for coin holders.

Key Levels:
Resistance levels: $0.00138, $0.00139, $0.00140
Support levels: $0.000900, $0.000800, $0.000700

D2T (USD) Long-term Trend: Bullish (Daily Chart)

As the New Year begins today, the long-term market value of Dash 2 Trade is moving in a bullish direction. This is clear as we can see the prices trading above the EMA-50 approaching the overhead resistance, indicating an uptrend.
Dash 2 Trade Price Predictions for Today, January 1: D2TUSD Price Remains Pressured above the $0.00135 High Value
The pressure from long-term traders to a $0.00144 high value in the last session adds to the bullish impact on the market in its recent high.

The daily bullish candle today at the $0.00150 supply value remains pressured above the EMA-50, confirming the bulls’ dominance in the market. This breakup may accelerate the bullish momentum and extend the current correction to a higher level.

Furthermore, an increase in the buying pressure might lead the price of Dash 2 Trade to retest the previous high of $0.00430 level, obtaining a higher footing to rise higher.

In addition, the D2TUSD pair indicates bullish sentiment by pointing up on the daily stochastic while the coin price remains pressured above the $0.00140 high value.

As a result, the downside risk remained uncertain. Thus, the next bulls’ target might be the $0.01000 high level in the days ahead in its long-term outlook.

D2T (USD) Medium-term Trend: Bullish (4H Chart)

The momentum on the medium-term outlook (4H) is undeniably bullish. The lack of a bearish continuation is also distinctly seen from the chart.
Dash 2 Trade Price Predictions for Today, January 1: D2TUSD Price Remains Pressured above the $0.00135 High Value
As an outcome of low bearish momentum, buyers are hindering the market from smashing through the support zones.

The coin price at a $0.00138 high value is undeniably bullish as the 4-hour session opens today. Thus, buyers must redouble their efforts to forecast a bullish increase in the market above the $0.00265 supply mark.

Notably, the Dash 2 Trade price may likely continue in the same bullish trend as the market is pointing up, indicating an uptrend on the daily stochastic.

So, the crypto price could be ready very soon for a bullish pattern continuation. In this case, a significant level above the $0.01000 supply trend line might be the target soon in its medium-term time frame.

Better things are on the horizon for Dash 2 Trade! Signal Notifications will ensure that you never miss a beat:


🎉 Coming Soon: Signal Notifications! 🎉


Dash 2 Trade is about to get even better! With Signal Notifications, you’ll never miss a beat:

✅ Pick the coins you care about
✅ Let Dash 2 Trade track the market
✅ Get notified when your conditions are met

📩 Smarter trading is just… pic.twitter.com/xVmKRm3pzz

— Dash 2 Trade (@dash2_trade) December 30, 2024

Want a coin that has a huge potential for massive returns? That coin is Dash 2 Trade. Buy D2T now.

Tamadoge (TAMA/USD): Bulls Attempt Recovery at Critical $0.001 Level

As the Tamadoge (TAMA/USD) bear market continues to progress, the price recently declined to approximately $0.001—a critical support level. In fact, relentless bearish pressure forced the price action to break below this level. Currently, after finding support near $0.00098, the bulls are attempting a recovery, driving the market back toward the $0.001 level in an effort to reclaim it. Reclaiming and holding this level is crucial, as it could signal the potential for consolidation or even a bullish reversal.

Key Levels

  • Resistance: $0.0018, $0.0019, and $0.0020
  • Support: $0.001, $0.0009 and $0.0008

Tamadoge (TAMA/USD): Bulls Attempt Recovery at Critical $0.001 Level

TAMA/USD Price Analysis: The Indicators’ Point of View

Although the TAMA/USD market appears to have broken below the critical support level, it is essential to recognize the high volatility at play. This breach does not necessarily indicate that the bears have fully taken control or will continue driving the market further downward. Given the market’s volatility, the bulls may seize this opportunity to stage a rally and push the market back upward. Notably, in recent trading sessions, the price action established a pivotal level at $0.00094, signaling the emergence of higher lows. This suggests that bullish momentum is still present at this level. While the bears currently seem to have the upper hand, a potential upward market reversal could be on the horizon.

Tamadoge (TAMA/USD): Bulls Attempt Recovery at Critical $0.001 Level

Tamadoge Short-Term Outlook: 1-Hour Chart

The strength of the Tamadoge (TAMA/USD) bears is evident across both the 4-hour and 1-hour charts, with bearish pressure particularly pronounced on the 1-hour timeframe. However, as the market approaches the psychological level of $0.001, a potential bounce is anticipated. The market is already showing signs of consolidation around this critical price level, which could pave the way for a bullish rally. If the recovery gains momentum, the price may climb toward the $0.0011 level.

Buy Tamadoge!

Buy TAMA today!

Stacks (STX/USD) Primed for a Potential Bullish Rally

The Stacks (STX) market appears poised for another bullish run as the recent bearish correction from the $3.00 price level has halted upon reaching the critical psychological support at $1.50. This level has proven to be a significant support zone due to its historical relevance. Notably, in early November, the previous bullish rally originated from this same $1.50 level and steadily gained momentum, culminating at the $3.00 peak. Consequently, this support level is likely to evoke strong bullish sentiment, potentially driving a market reversal.

The Stacks Market Data

  • STX/USD Price Now: $1.57
  • STX/USD Market Cap: $2.37 billion
  • STX/USD Circulating Supply: 1.5 billion STX
  • STX/USD Total Supply: 1.5 billion STX
  • STX/USD CoinMarketCap Ranking: #53

Stacks (STX/USD) Primed for a Potential Bullish Rally

Key Levels

  • Resistance: $2.00, $2.50, and $3.00
  • Support: $1.20, $1.00, and $0.90.

The Stacks Market Through the Lens of Indicators

Following the bearish reversal at the $3.00 level, the price declined significantly faster than it had risen during the preceding bullish surge to the same level. This highlights an increase in market volatility, which facilitated the rapid drop to the key support zone. The heightened volatility is evident in the Bollinger Bands, which display a wide bandwidth. Given this, the Stacks price may rebound sharply as bullish participants capitalize on the volatility to trigger a strong rally.

However, if the bullish and bearish forces achieve equilibrium at this level, the market could enter a consolidation phase. During this period, volatility would decrease, signaling a pause in the activity of the crypto market. This consolidation phase is likely to precede the market’s next decisive move.

Stacks (STX/USD) Primed for a Potential Bullish Rally

STX/USD Price Prediction: 4-Hour Chart Analysis

On a smaller timeframe, the market is consolidating along the $1.50 price level, with the Bollinger Bands reflecting reduced volatility. In the most recent session, a tall histogram indicated significant market activity, but the presence of a gravestone doji candlestick suggests that, despite pressure from both sides, the price action remains stagnant. This pattern highlights a state of strong indecision, further corroborated by the RSI, which is positioned precisely at 50. Given that this consolidation is occurring near a critical support level, a potential outcome could be a bullish rebound.

Trade crypto coins on BYBIT!

EigenLayer (EIGEN/USDT) Eyes Potential Upside Movement

The market for Eigenlayer against the Tether indicates a market moving a defined range after a volatile price swings in previous moves. Recent price actions show the pair were operating at the upper Bollinger band before breaking below the dynamic 20-SMA for the lower band.

However, the indicators on the chart below suggest an impending move toward the mid-line at $4.171, as the Stochastic RSI signals a weakened selling pressure.

Currently, EIGEN/USDT trades at $3.678 after recording a 0.16 marginal move to the North, with over 4 million daily traded volumes.

EigenLayer (EIGEN/USDT) Eyes Potential Upside Movement
EIGENUSDT-Daily Chart

Technical Indicators

Major Resistance Levels: $4.000, $4.171, and $5.000

Major Support Levels: $3.500, $3.000, and $2.842

EigenLayer Technical Analysis

The analysis of Eigenlayer against the USDT on the daily timeframe shows the pair has been on a prolonged downtrend after hitting the $5.500 resistance level. However, recent price action near the mid-band signals a reduced selling pressure, with the potential of breaking above $4.171 in the near term. On the contrary, a reduction in the current momentum and a break below the $3.500 indicate a downtrend.

On the other hand, the Stochastic RSI shows that the pair is operating in the oversold region. This depicts a heightened selling condition. However, with the lines pointing to the North, the indicator signal the potential end of a bearish session and impending uptrend if the momentum keeps building.

EIGEN/USDT Analysis: Positioned for a Short-term Recovery

On the 4-hour timeframe, the chart of EIGEN/USDT shows the pair is attempting a short-term recovery as the price tends towards the upper Bollinger band with an increase of 1.13% above the previous trading session.

On the other hand, the Stochastic oscillator shows that the pair operates in the overbought region. Though this indicates strong buying pressure, it also suggests the current uptrend may be nearing exhaustion, further picturing a market with cautious optimism.

To this end, with the mild bullishness, a move above $4.000 is possible if the momentum is increased; otherwise, as the Stochastic warns of overbought conditions, a retracement towards the lower support levels is possible if momentum drops.

EigenLayer (EIGEN/USDT) Eyes Potential Upside Movement
EIGENUSDT-4H Chart


You can purchase crypto coins here. Buy LBlock

Dash 2 Trade Price Predictions for Today, December 31: D2TUSD Price to Proceed Higher

Dash 2 Trade Price Forecast: D2TUSD Price to Proceed Higher (December 31)

D2TUSD price anticipates proceeding higher as the coin buyers emerge with the bullish sentiment to move the token price higher. Thus, if the current support at $0.000911 holds, and the daily candle closes above the $0.00460 supply level, then there is a high probability of the price going up to the $0.01000 upper resistance value, setting the potential for more gains.

Key Levels:
Resistance levels: $0.00120, $0.00125, $0.00130
Support levels: $0.000950, $0.000900, $0.000850

D2T (USD) Long-term Trend: Bearish (Daily Chart)

Dash 2 Trade is in a bearish market zone in its higher time frame. The price is currently recovering and trades below the EMA line due to the inflow from the short traders.
Dash 2 Trade Price Predictions for Today, December 31: D2TUSD Price to Proceed Higher
The interference with the sell traders in the previous action has dropped the price below the supply trend levels in its recent high.

The Dash 2 Trade responded to a shift in the trend and pushed the coin price up to the $0.00120 supply value below the supply trend lines as the daily session opened today, indicating that buyers are returning to stage a play in the market.

Meanwhile, more gains are possible if the bulls can put extra effort into the price action. Now, if the price on the daily chart closes above the $0.00460 value, then the token price may proceed higher to the upper resistance channel.

Further, the D2TUSD price may precede higher shown by the daily stochastic pointing up. So, the crypto price could be ready very soon for a bullish pattern continuation and may reach the $0.01000 resistance level in the coming days in its higher time frame.

D2T (USD) Medium-term Trend: Bullish (4H Chart)

Despite the interference from the sell traders on the medium-term outlook, the D2TUSD pair may proceed higher. The coin price is slightly above the moving average lines, suggesting a bullish trend.
Dash 2 Trade Price Predictions for Today, December 31: D2TUSD Price to Proceed Higher
The bulls’ intervention in the coin market in the previous action has made it easier for the price to stay above the trend line in its recent high.

The momentum continues today as the bulls proceed higher and drive the crypto price to the $0.00120 supply level above the EMA-50 as the 4-hourly chart opens today.

Furthermore, buyers are struggling to sustain above the $0.00265 supply level in the previous action, if buyers continue to hold this momentum, the price may break the previous swing high at the $0.00265 resistance value, offering a potential buy signal for interested traders.

Hence, the market price is pointing upwards on the daily stochastic, implying that the price action of D2TUSD is in an uptrend. In this case, the coin may proceed higher to the $0.01000 supply level in the coming days in its medium-term perspective as we watch the market remain bullish.

Better things are on the horizon for Dash 2 Trade! Signal Notifications will ensure that you never miss a beat:

Want a coin that has a huge potential for massive returns? That coin is Dash 2 Trade. Buy D2T now.

XRP (XRP/USDT) Sees a Sharp Pullback After Recent Rally

XRP Long-term Analysis: Bearish

The market for XRP against the Tether has seen a significant pullback after peaking over the $2.1000 level. This retracement signals a mix of take-profit and consolidation phases. However, the general market sentiment reflects a cautious optimism, as the pair operates at the $2.000 level.

For a month, XRP against the Tether has seen a sharp drop after reaching a new height. Despite the decline, the pair has shown resilience above the $2.000 level. However, traders are closely watching key resistance and support, as reversal hinges on the potentiality to break above the $2.1237 level.

Currently, XRP is trading at $2.0745, with over 403 million weekly traded volumes.

XRP (XRP/USDT) Sees a Sharp Pullback After Recent Rally
XRPUSDT-Weekly Chart

Technical Indicators

Major Resistance Levels: $2.0808, $2.1237, and $2.1526

Major Support Levels: $1.9954, $1.9160, and $1.8010

XRP Technical Analysis

The analysis of XRP on the weekly timeframe shows that the price is facing short-term down pressure, as seen in the price’s position around the short-period EMAs. Though XRP/USDT faces the south, the divergence and the upside alignment of the long-period EMAs show renewed hope. To this end, a sustained move above $2.1237 would indicate a short-term recovery toward the previous high; otherwise, a break below the $2.000 level would suggest a further downtrend.

On the other hand, the Stochastic RSI suggests the pair still operates slightly in the overbought region, as the lines read 71.82 for orange and 60.78 for blue. However, this position suggests a price correction in the short term if a blue crossover occurs above the 50-mark level. Conversely, a dip below the 50-mark level may lead to a retest of lower support levels.

XRP/USDT Analysis: A Renewed Optimism

On the daily timeframe, XRP/USDT is currently consolidating, as the pair oscillates within a close range. The appearance of the price at $2.0853 above the short-term EMAs indicates renewed hope. However, the narrowing gap between the sets of EMAs suggests weakened momentum.

The oscillator at the bottom of the chart shows the pair operating in the oversold region, with a potential bounce on the horizon if momentum shifts bullish. To this end, increased trading volume with a currently bullish uptick would indicate an uptrend. However, failure to hold above the current level would signal a move towards $1.9589.

XRP (XRP/USDT) Sees a Sharp Pullback After Recent Rally
XRPUSDT-Daily Chart


You can purchase crypto coins here. Buy LBlock

Litecoin (LTC) Price Prediction: LTC/USDT Slides Below the $100.00 Price Level

Litecoin (LTC) Price Prediction (December 31):

The Litecoin market has been highly correlated to the Bitcoin market. Price action in the market has been under significant bearish pressure ever since the BTC market crashed below the $100,000 mark. As of the time of writing, LTC trades below the $100 price level.

LTC/USDT Long-Term Trend: Bearish (Daily Chart)

Key Price Levels:

Resistance: $100.00, $105.00, $110.00

Support: $95.00, $90.00, $85.00

Litecoin (LTC) Price Prediction: LTC/USDT Slides Below the $100.00 Price Level

The last price candle on the Litecoin market is red, indicating some downward retracement in the market. Moreover, price activity is currently appearing below the converging 20- and 50-day Moving Averages (MA). Additionally, the Stochastic Relative Strength Index (RSI) lines are falling into the oversold region and are now below the 20 level of the indicator.

Litecoin (LTC) Price Prediction: LTC/USDT Bears Are Leading

It is clear from Litecoin’s price activity that headwinds are prevailing. The appearance of the last price candle on the chart suggests that downward forces are dominant in the session, although the downward retracement could be considered minimal. Meanwhile, the convergence of the 20- and 50-day MA lines suggests that bearish momentum may intensify subsequently.

The Stochastic RSI lines have fallen deeply into the oversold region. The endpoints of the lines are converging as they approach the lower boundary of the oversold region of the indicator. A possible bearish crossover may be anticipated, and the convergence of the MA lines above price action reinforces this bearish sentiment.

Litecoin (LTC) Price Prediction: LTC/USDT Remains Under Bearish Pressure (4-Hour Chart)

Contrary to what is observed on the Litecoin daily chart, price action here has fallen below all the MAs. The last price candle here is green but has a negligible body size. Furthermore, the Stochastic RSI lines have moved towards the oversold region of the indicator following an aborted bullish crossover.

Litecoin (LTC) Price Prediction: LTC/USDT Slides Below the $100.00 Price Level

The negligible size of the last price candle on this chart reinforces the impression that price action is under a strong bearish influence. As a result, this has caused the market to contract in the session. Likewise, the downward trajectory of the RSI lines also indicates that bearish forces are likely to maintain dominance. Therefore, traders can target the $95.00 price level as a potential support level.

Get Litecoin (LTC) here. Buy LTC