One Solana Metric Just Jumped 16% — Here’s Why It Matters
Estimated Reading Time: 3 minutes
Don’t invest unless you’re prepared to lose all the money you invest. This is a high-risk investment and you are unlikely to be protected if something goes wrong. Take 2 minutes to learn more
KEY TAKEAWAYS:
- Solana app revenue rose 16% in May, showing stronger network activity despite market weakness.
- SOL fell over 20% in a week, creating a gap between price action and fundamentals.
- Growing usage could support a recovery if network adoption continues to outpace the token’s decline.
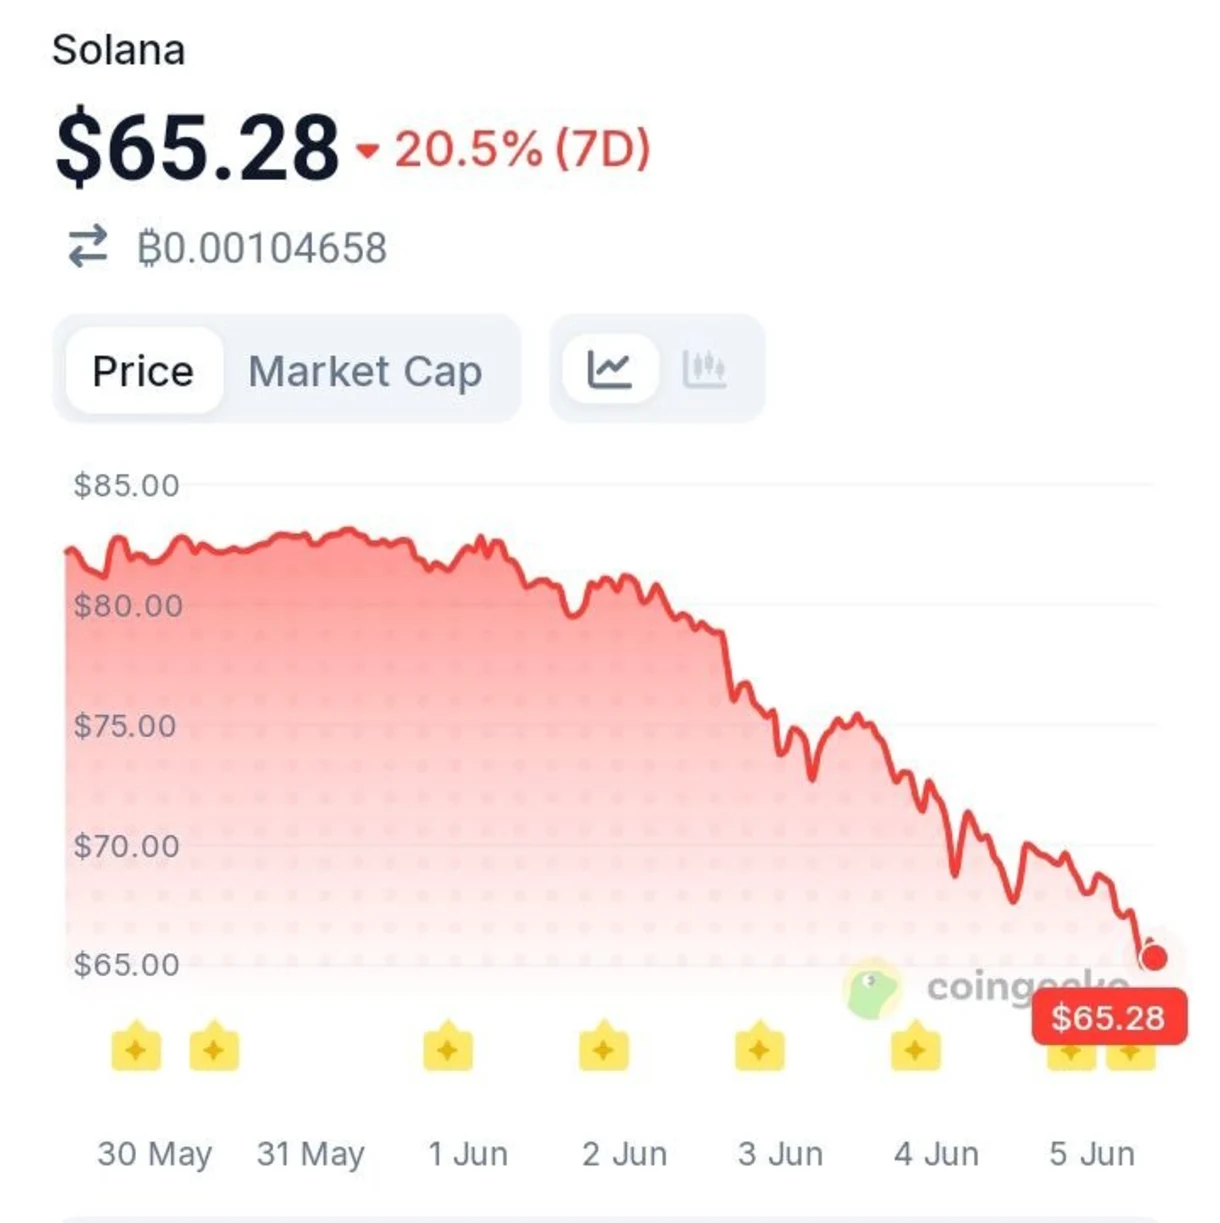
Solana’s price is doing one thing. Its application revenue is doing another. While SOL has shed 20.5% in seven days and trades at $65.28 — its lowest level in months — Blockworks Research data as of May 31, 2026 shows that application revenue across a tracked subset of Solana protocols jumped approximately 16% month-over-month from April to May. In a market that is pricing Solana for continued pain, the network’s most important fundamental metric just quietly moved in the opposite direction.
What the Revenue Chart Is Actually Showing
The Blockworks Research application revenue chart covering July 2025 through May 2026 is a study in cyclical resilience. Peak revenue occurred in the July–August 2025 window at approximately $150–$160 million monthly, driven primarily by Pump.fun and Axiom dominating the stack. The subsequent months saw a contraction through the October–December trough — a period that bottomed near $75–80 million — before a sharp January 2026 recovery back above $130 million.
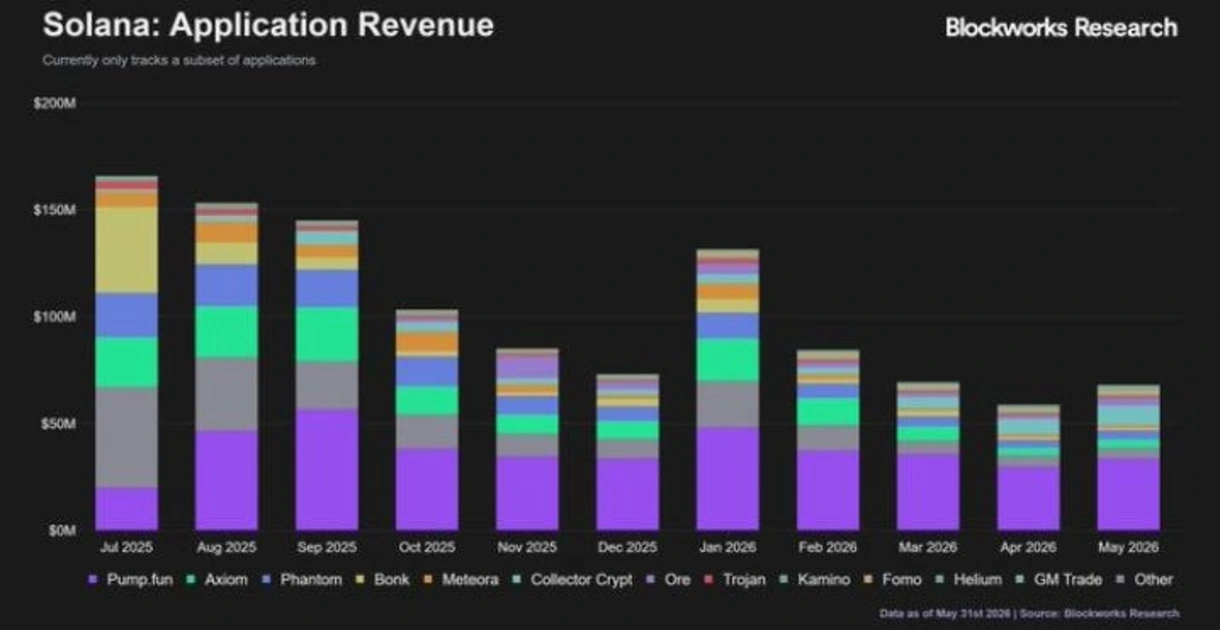
The February through April period compressed again toward $50–55 million, which makes May’s recovery to approximately $65 million the first consecutive uptick after that trough. Pump.fun remains the single largest revenue contributor, but the breadth of the stack — Phantom, Meteora, Kamino, Bonk, and others — is visibly widening month-over-month, suggesting the recovery is distributed rather than dependent on a single application’s activity spike.
“A network whose application revenue rises while its token price falls is not a network in distress. It is a network being mispriced.”
The Divergence That Demands Attention
The CoinGecko 7-day chart captured at approximately 11:00 UTC on June 5, 2026 shows SOL opening near $82 on May 30 and declining in an unbroken sequence through every support level — $80, $75, $70, $68 — before accelerating lower to $65.28 by June 5. At ₿0.00104658, SOL is also losing ground against Bitcoin, compounding the weekly loss with BTC-relative deterioration. The price structure is unambiguously weak.
Against that backdrop, a 16% month-over-month jump in application revenue is the kind of divergence that precedes re-ratings rather than continued decline. BlackRock, Visa, and SoFi are building on Solana’s rails. SIMD-547’s proposed burn mechanism could multiply daily SOL destruction by 100 times. And the applications generating revenue on the network are quietly recovering while the token price has not yet noticed.
The metric that jumped 16% is not a price chart. It is the measure of whether people are actually using the network — and right now, they are.