Bitcoin (BTC) Price Prediction: BTC/USDT Recovers Above $75,000
Estimated Reading Time: 3 minutes
Don’t invest unless you’re prepared to lose all the money you invest. This is a high-risk investment and you are unlikely to be protected if something goes wrong. Take 2 minutes to learn more

Bitcoin (BTC) Price Prediction (April 9, 2025)
The Bitcoin market has been bearish and quite volatile in recent times. As a result, price action has quickly moved through several technical support levels. The market dropped below the $80,000 and $75,000 price levels. It remains subdued and still appears quite vulnerable.
BTC/USDT Long-Term Trend: Bearish (Daily Chart)
Key Price Levels:
Resistance: $80,000, $85,000, $90,000
Support: $75,000, $70,000, $65,000
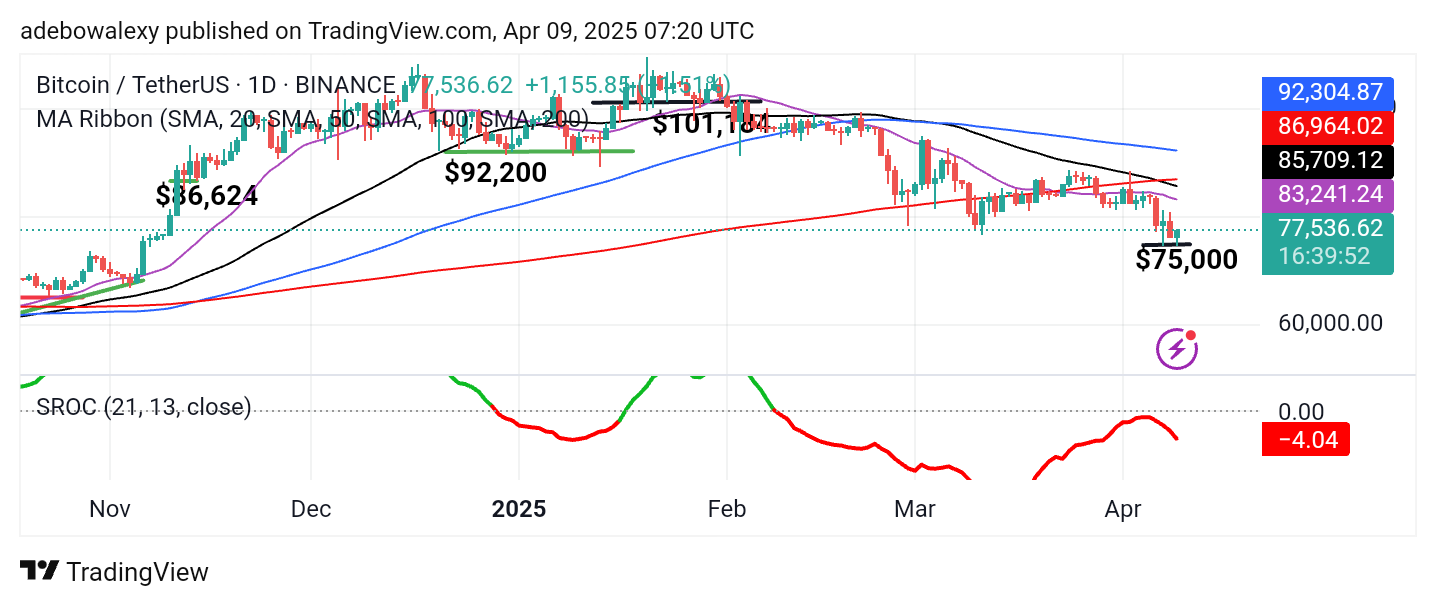
The latest price candle on the Bitcoin daily chart is green and shows a small upward contraction. However, it still appears below all the Moving Average (MA) lines on the chart. Likewise, the Stochastic Rate of Change (ROC) indicator is trending downward and remains below the equilibrium level.
Bitcoin (BTC) Price Prediction: BTC/USDT Is Still Vulnerable to a Continued Downward Retracement
The Bitcoin daily chart reveals that price activity maintains a subdued outlook. For nearly two weeks, price action has stayed below all MA lines. Previous attempts to break through the resistance formed by the MA lines have failed.
Over the past three sessions, bearish momentum has strengthened, causing the market to decline more sharply. As a result, the market briefly dipped below the $75,000 level before rebounding above it. The stance of the Stochastic ROC indicator continues to suggest further downside pressure. This indicates that the market has not yet exited troubled territory.
Bitcoin (BTC) Price Prediction: BTC/USDT May Have Hit a Strong Support
On the 4-hour chart, price action suggests Bitcoin may have found strong support around the $75,000 level. A rebound from this level is evident; however, price activity remains below all MA lines, which continues to dampen bullish sentiment. Similarly, the Stochastic ROC indicator remains below the equilibrium level.
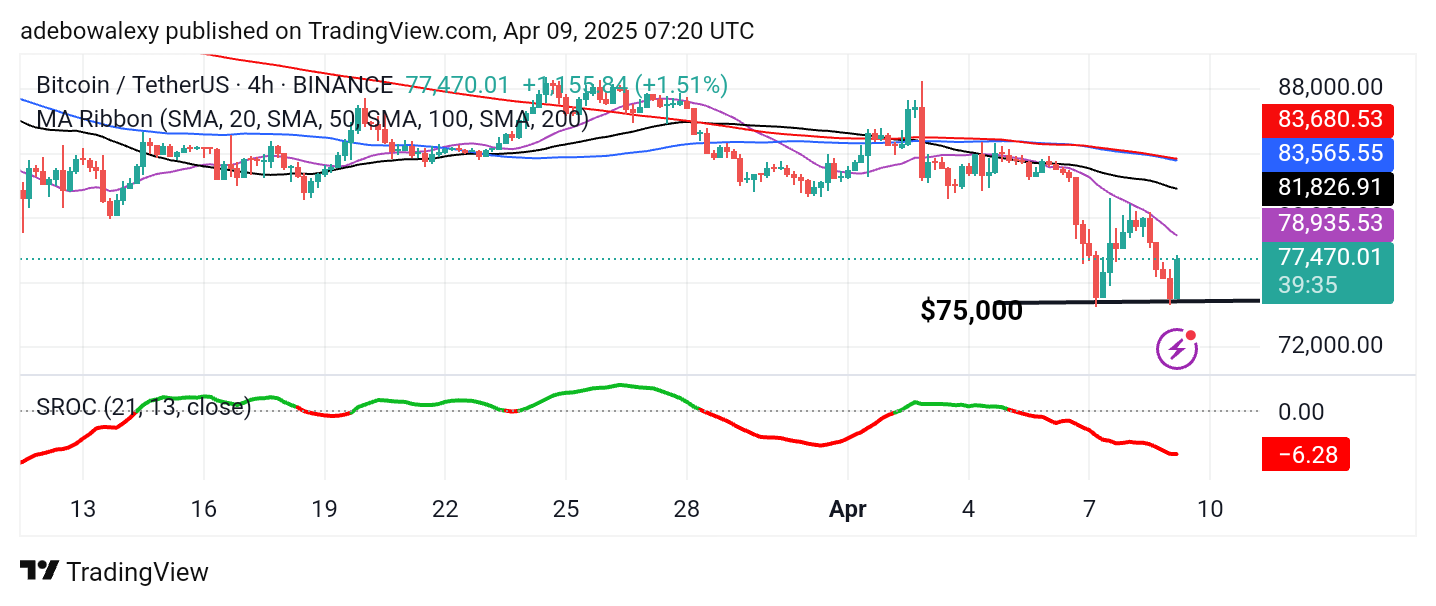
While the market shows short-term recovery potential, traders should proceed with caution. Price action has yet to break above any of the MA lines. Nevertheless, the Stochastic ROC lines are beginning to move sideways, hinting at a possible strengthening of upward momentum. Therefore, traders should remain modest in their expectations and consider targeting $80,000 for short-term gains.