XRP (XRP/USDT) Defending $2.71: Can Bulls Hold Above Support for the Next Breakout?
Estimated Reading Time: 3 minutes
Don’t invest unless you’re prepared to lose all the money you invest. This is a high-risk investment and you are unlikely to be protected if something goes wrong. Take 2 minutes to learn more
XRP Daily Analysis: Consolidating
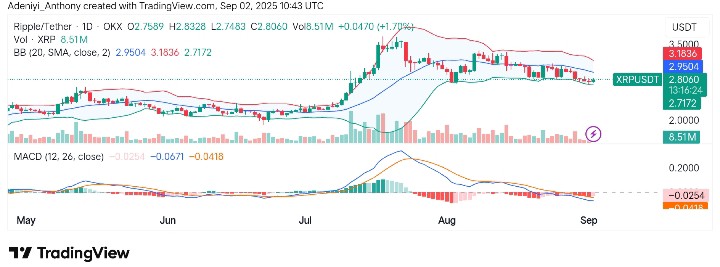
XRP against Tether has been trading sideways after a sharp rally in July, showing signs of indecision and a continued struggle between the buyers and sellers. As it stands, the market is neutral and slightly bearish, with price extending towards the middle line of the Bollinger Bands while the momentum indicators show weakness.
However, recent price action from the July $3.40 high suggests the pair is correcting, and current upside movement may lack strong backing. Right now, XRP trades at $2.8060 with over 8.5 million traded volumes for the day.
Technical Indicators
Major Resistance Levels: $2.950, $3.180, and $3.500
Major Support Levels: $2.710, $2.500, and $2.200
XRP Technical Analysis
Technically, on the XRP against Tether chart, the bulls appear to be preventing more corrections, as the price oscillates towards $2.950. At the moment, the Bollinger Bands are tending towards the southwest, indicating no direction.
Moreover, the MACD beneath the chart displays a bearish signal, but with a narrowing gap, it shows XRP may be setting up for another bullish push, but failure to hold these levels could open the door to deeper declines.
To this end, if the pair close above $2.70, a move to the north could be initiated; otherwise, a fall below this level might send the price further south.
What’s Next?
After the downside correction of XRP from the July top, the coin is once again at the August low, oscillating around a key level with a fragile setup as the $3.40 remains strong. At the moment, XRP stands a chance to the upside in the meantime with a break above $3.10; otherwise, more corrections could follow.
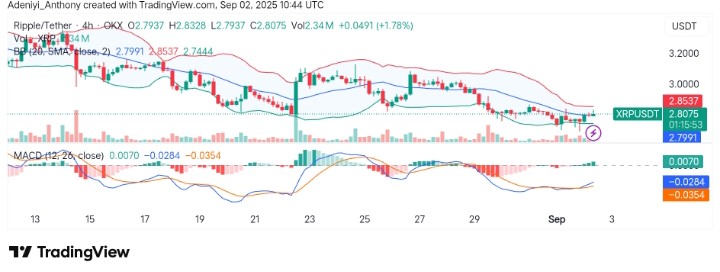
XRP/USDT 4H Analysis: Expectations
On the 4H timeframe, XRP/USDT is attempting to rebound after recent downside pressure. The price seems to be testing the middle Bollinger Band (20-SMA) at $2.7991, suggesting a possible momentum shift.
Also, the MACD histogram has flipped positive, with the MACD line (blue) crossing above the signal line (orange); this suggests buyers are temporarily in control as the volume remains modest.
The way it is, a sustained close above $2.85 could open the path toward $2.90–$3.00 resistance. Also, a break below $2.74 would lead to a deeper correction. Conversely, failure to hold $2.80 risks a retest of the $2.74 zone or even deeper downside pressure.
You can purchase crypto coins here. Buy Crypto