The Theta Market (THETA/USD) Rallys to June 25’s High

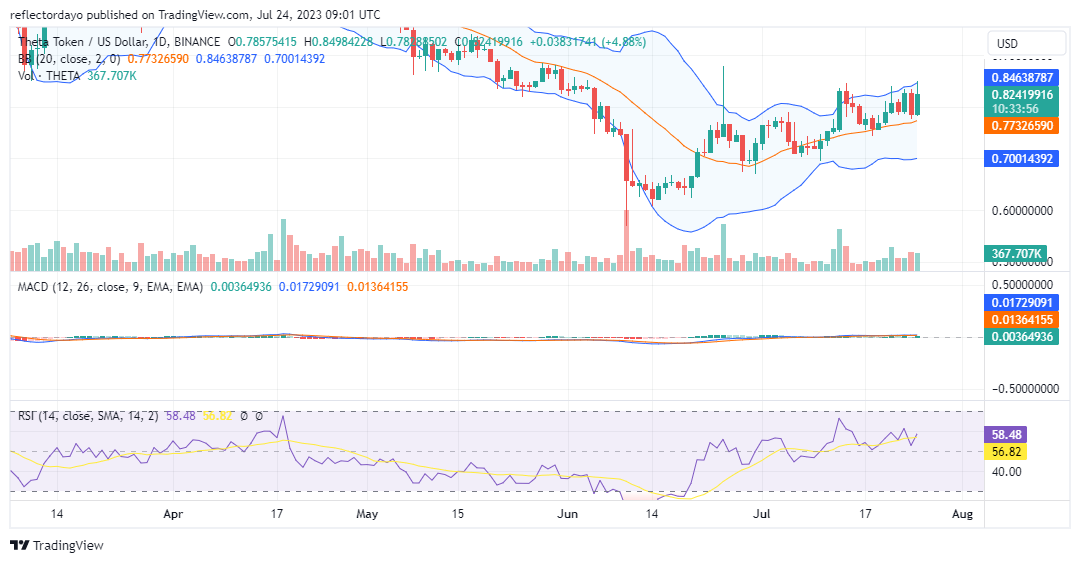
After finding a robust support level at $0.6174, the Theta market successfully reversed its direction to the upside. Subsequently, it has maintained an uptrend. On June 25, a significant price surge occurred, attributed to an influx of traders in the bull market. As the price reached a high of $0.8821, some traders began to take profits, but overall, the prevailing bullish sentiment continued to drive the market upward.

The Theta Market Data

  • THETA/USD Price Now: $0.847
  • THETA/USD Market Cap: $834,586,836
  • THETA/USD Circulating Supply: 1,000,000,000 THETA
  • THETA/USD Total Supply: 1,000,000,000
  • THETA/USD CoinMarketCap Ranking: #47
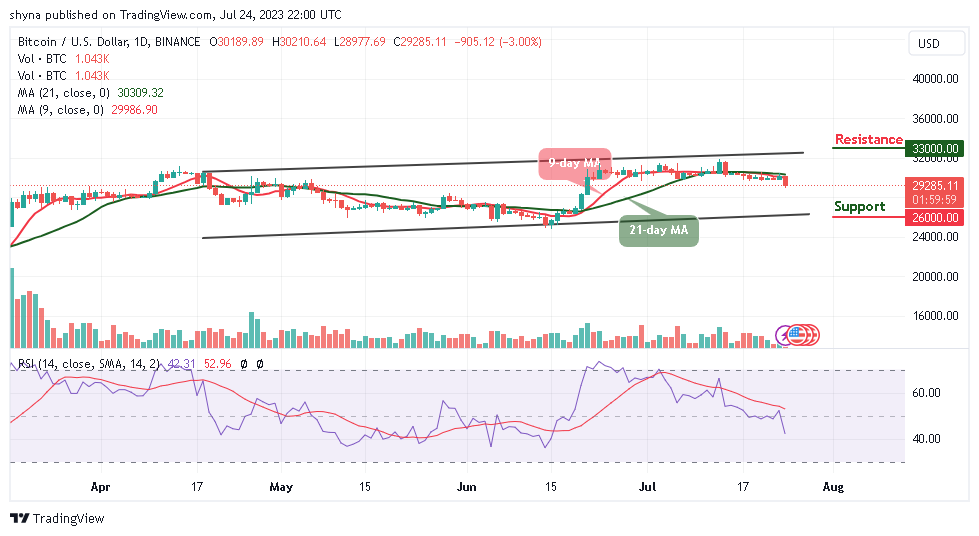
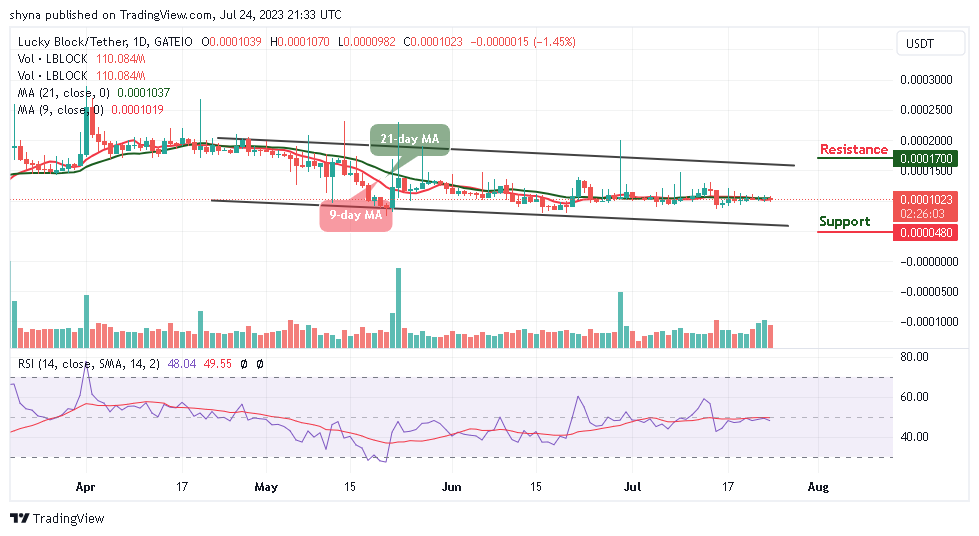
The Theta Market (THETA/USD) Rallys to June 25’s High

Key Levels

  • Resistance: $0.900, $1.000, and $1.100.
  • Support: $0.700, $0.600, and $0.500.

Price Prediction for the Theta Market: The Indicators’ Point of View

The Theta Market continues to demonstrate higher lows, providing reassurance of its bullish potential. Despite the presence of bears in the market, it is steadily retracing from the June 25 resistance level. Additionally, the Relative Strength Index shows market momentum measured at level 58.

The RSI’s highly erratic behavior may signal heightened market volatility, which can offer trading opportunities but also entail increased risks. Traders should consider implementing wider stop-loss levels to accommodate larger price swings.

The Theta Market (THETA/USD) Rallys to June 25’s High

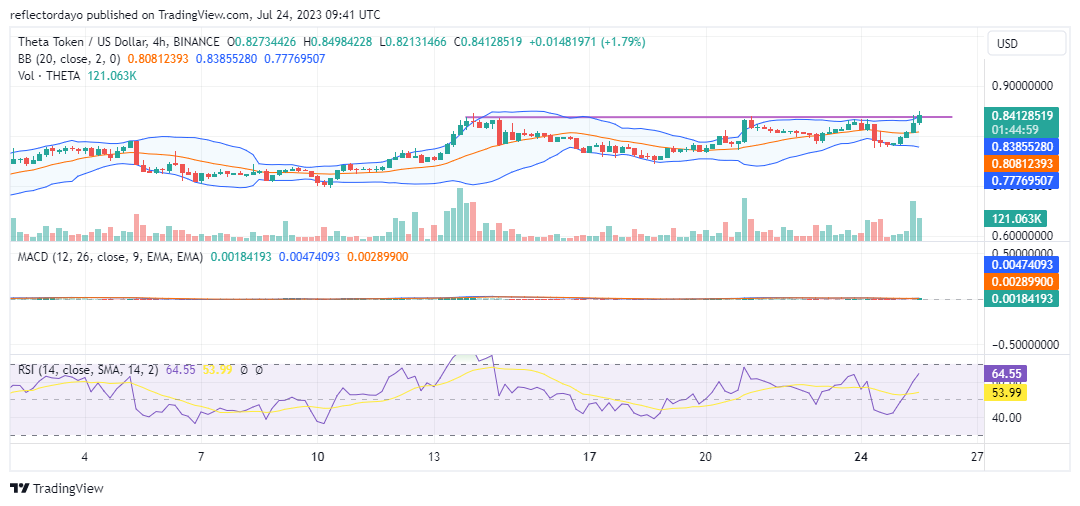
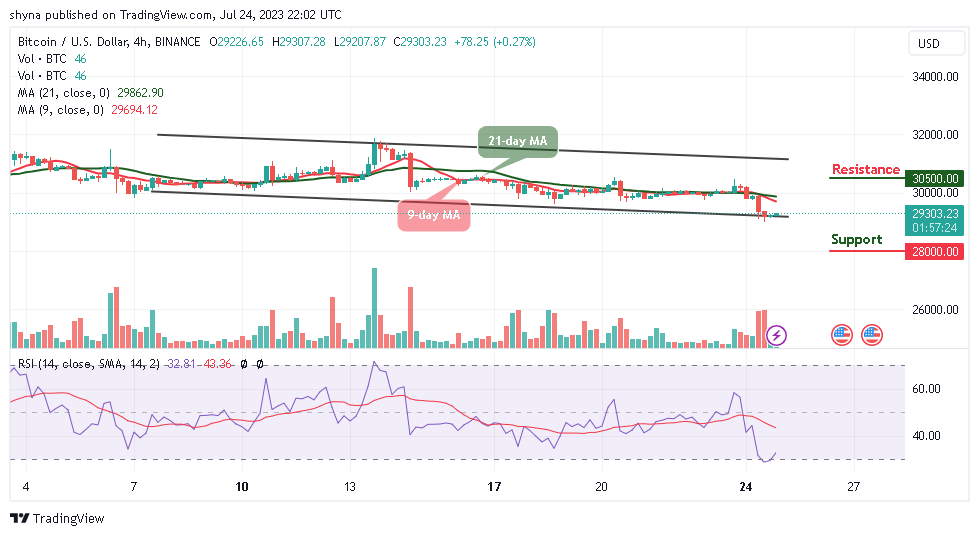
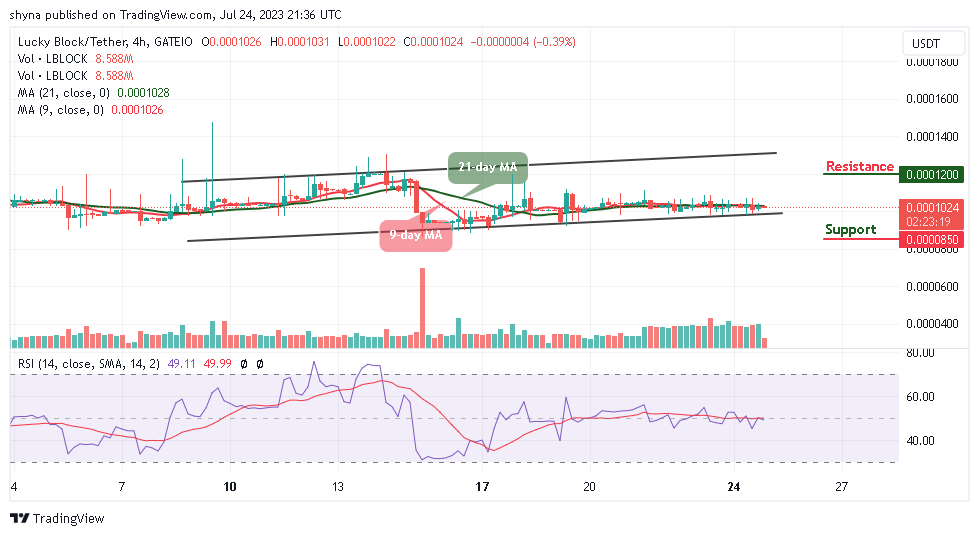
THETA/USD 4-Hour Chart Outlook

The market’s erratic nature is observable in the 4-hour chart outlook. Even within this standard timeframe, the market appears to be influenced by considerable noise, random fluctuations, and conflicting forces affecting the price action. Traders are advised to exercise caution due to the potential for unpredictable price movements. It’s prudent to wait for a decisive break above the $0.832 resistance level before determining a market position.

Buy Theta on eToro.

Polygon (MATIC/USD) Price Runs a Retracement, Finding a Foothold

Polygon Price Prediction – July 25
In the MATIC/USD market operations, a closure technical perspective has emerged, indicating the cryptocurrency economic price runs a retracement motion ahead of gaining traction towards the psychological trade spot above the $0.60 support line.

As the current trading trend behind the current pace of the market is considered to obtain support that will soon transform into trustworthy surging moments, the gravitational attraction to the downside does not appear to be surrendering to more wild fall-offs. The percentage rate of trade is currently 0.966%, which is minutely negative to negotiate between $0.729 and $0.720 values as of the writing of this article. There have been some indications that buyers may make a comeback and halt the current trend of migrating to the south.

MATIC/USD Market
Key Levels:
Resistance levels: $0.80, $0.90, $1
Support levels: $0.60, $0.55, $0.50

MATIC/USD – Daily Chart
The MATIC/USD daily showcases that the crypto-economic price runs a retracement movement, finding a foothold around the trending path of the smaller indicator.

The 14-day SMA indicator is the tool to give an ascertained signal moment to showcase if the price will hold back against more declines around $0.65, as it is underneath the 50-day SMA indicator. The Stochastic Oscillators have dipped into the oversold region, keeping the points between 7.77 and 3.22. These numbers highlight the necessity of exercising caution while establishing a new shorting order position.
Polygon (MATIC/USD) Price Runs a Retracement, Finding a Foothold
Should the MATIC/USD market’s bears go with a maximal breakdown motion against the $0.65 support level before?
All hope has been put on the rise regarding the fact that the MATIC/USD market bears’ capacity won’t be able to push optimally further through supports from $0.65 down to the lower point of $0.60 as the crypto-economic trade runs a retracement, finding a foothold.

Going by the furtherance settings of declines, today’s trading bearish candlestick has to maintain its selling wall from the top to the lower end, leading to another following path that has to be lower than the one of today in the subsequent days’ sessions. Nevertheless, it is not recommended to play along with that assumption without executing a stop-loss order instantly.

In light of the likelihood that this market will move upward, we believe that trade values between $0.65 and $0.60 will act as crucial supports for enabling bulls to reclaim their righteous attitudes. They merely need to keep an eye out for a concrete rallying signal that can develop into a bullish trading candlestick before properly resuming long bets.
Polygon (MATIC/USD) Price Runs a Retracement, Finding a Foothold
MATIC/BTC Price Analysis
In comparison, there has been a running retracement motion on the Polygon market, finding a foothold against the valuation of Bitcoin.

Compared to the 14-day SMA indicator, the 50-day SMA indication is higher. The Stochastic Oscillators have crossed over from the overbought region into the oversold region. And they haven’t turned from pointing southward from 15.74 to 2.67 yet. It appears that the fundamental cryptocurrency is coming to an end. Longing-position orders will therefore soon be visible.

Note: Cryptosignals.org is not a financial advisor. Do your research before investing your funds in any financial asset or presented product or event. We are not responsible for your investing results.

You can purchase Lucky Block here. Buy LBLOCK

Dash 2 Trade Price Predictions for Today, July 25: D2TUSD Bullish pattern Threatens the $0.1000 Upper Resistance

Dash 2 Trade Price Forecast: D2TUSD Bullish Pattern Threatens the $0.1000 Upper Resistance (July 25)
Amid the increasing uncertainty in the crypto market, the Dash 2 Trade price struggled to build up enough bullish momentum for a bounce back. The crypto is now set for the next bull cycle and a swift increase is expected to follow soon. Therefore, a bullish crossover above the $0.00753 previous high mark will encourage the buy investors for a longer correction and this might reach a high at the $0.1000 upper supply trend line.

Key Levels:
Resistance levels: $0.01000, $0.01100, $0.01200
Support levels: $0.00800, $0.00700, $0.00600

D2T (USD) Long-term Trend: Bearish (4H)
The D2TUSD pair is trading in the bearish trend market in its long-term outlook. The price bar can be seen slightly below the moving average lines and has confirmed its bearishness.
Dash 2 Trade Price Predictions for Today, July 25: D2TUSD Bullish pattern Threatens the $0.1000 Upper Resistance
The interference of short-term traders to the $0.005254 low level in the previous action has contributed to its bearish momentum in its recent price level.

A breakout and the start of a bullish pattern to the upside at the $0.00544 supply value below the supply trend levels has been spotted as a pullback by the bulls as the 4-hourly session begins today.

The chart setup indicates active accumulation from buyers at significant support leading to a potential bullish upswing.

Thus, the pattern threatens a longer recovery and might retest the $0.00747 previous swing high neckline, resulting in an intraday gain for the coin buyers.

Adding to that, the stochastic oscillator pointing upwards means that the price action of Dash 2 Trade is in an uptrend. Hence, the post-breakout rally may surge the D2TUSD price by 17.5% to hit the $0.1000 upper resistance mark in the coming days in its higher time frame.

D2T (USD) Medium-term Trend: Bullish (1H)
Despite the interference of short-term traders in the price flow, the 1-hourly chart market of Dash 2 Trade shows a bullish race. The price bars can be seen slightly above the EMA-9 threatening a solid upward rally.

The bullish pressure on the coin at the $0.00527 supply level in the previous action has sustained its price above the supply trend levels in its recent high.

When writing this article, the D2TUSD price trades at the $0.00544 supply level and hovers above the supply trend line as the 1-hourly chart opens today. In response to the current indecisive sentiment in the market, the cryptocurrency could continue its lateral walk for a few trading days.

Hence, additional efforts by the bulls and a breakout above the $0.00667 previous high with a 1-hourly candle closing could signify a shift in the market dynamics.

Having said that, if the bullish momentum persists, a breakout above this combined resistance with candle closing, the resulting rally may surpass the $0.00667 price level and hit the $0.1000 psychological level at the upside which will signal a strong buy signal for interested traders in the days ahead in its medium-term outlook.

We have only begun to scratch the surface of what is imaginable. What you can achieve is limited by your aspirations and objectives.


Want a coin that has a huge potential for massive returns? That coin is Dash 2 Trade. Buy D2T now.

Decentraland (MANAUSD) Falls As The Price Hits $0.43330 Resistance

MANAUSD Analysis: The Market Falls As The Price Hits $0.43330 Resistance

MANAUSD falls as the price hits $0.43330 resistance. The market has been algorithmically declining on the daily chart for months now. As indicated by the MACD (Moving Average Convergence Divergence), the bears have more control over the market than the bulls. Currently, the price seems to be heading towards the diagonal resistance, which is still valid in the market.

MANAUSD Significant Zones
Demand Zones: $0.2850, $0.2000
Supply Zones: $0.4330, $0.7000

Decentraland (MANAUSD) Falls As The Price Hits $0.43330 Resistance

The market has been declining between diagonal support and diagonal resistance for quite a while. The last bounce off the diagonal support caused an expansive move last month. As it appears, MANAUSD might continue upward until the diagonal resistance is reached. Before the expansion, a bullish order block formed in June 2023. The bullish order block will likely cause further price expansion against the diagonal resistance. In March 2023, after the price returned from the $0.7000 level, MANAUSD headed downward to hit diagonal support.

After the hit, MANAUSD rallied to sweep the buy-side liquidity above the $0.6800 high. Following the liquidity grab, prices crashed massively, breaking the market’s structure. The algorithmic decline continues until the diagonal resistance is hit. The bulls were absent from the market, as revealed by the MACD indicator. Throughout May and June 2023, the MACD was below the zero line. However, owing to the recent surge in price, the zero line has now been crossed to the upside.

Decentraland (MANAUSD) Falls As The Price Hits $0.43330 Resistance

Market Expectation

MANAUSD is currently rallying along a diagonal support line. The market’s direction is bullish on the four-hour chart. However, the selling pressure from $0.4330 seems to push the price to the downside. Invalidation of the diagonal support and the $0.3520 low will likely occur first before the rally continues.


You can purchase Lucky Block here. Buy LBLOCK

Note: Cryptosignals.org is not a financial advisor. Do your research before investing your funds in any financial asset or presented product or event. We are not responsible for your investing results.

Bitcoin Price Prediction: BTC/USD Retraces Below $30k

Bitcoin Price Prediction – July 24

The Bitcoin price indicates bearish momentum as further upside has been rejected since yesterday, and bullish momentum has been lost.

BTC/USD Long-term Trend: Ranging (Daily Chart)

Key levels:

Resistance Levels: $33,000, $34,000, $35,000

Support Levels: $26,000, $25,000, $24,000

Bitcoin Price Prediction: BTC/USD Retraces Below $30k
BTCUSD – Daily Chart

BTC/USD is currently hovering at $29,285 as the king coin retreats below the 9-day and 21-day moving averages. At the time of writing, the path of least resistance is downwards, and the daily chart shows that the formation of a bearish may come to play.

Bitcoin Price Prediction: BTC Price May Retreat to Regain the Upside

At the time of writing, the technical indicator Relative Strength Index (14) is heading toward the south. As Bitcoin price faces the south, the Relative Strength Index (14) is likely to cross below the 40 level to confirm the bearish movement. However, if the coin spikes above the moving averages, this could mean that there may still be room that could be explored by the bulls.

Meanwhile, the daily chart reveals that the recovery may not come easy as the support will have to be sorted for above the moving averages. Therefore, a sustainable move toward the upper boundary of the channel could be located at $32,000, which may allow for an extended recovery toward the resistance levels at $33,000, $34,000, and $35,000. However, an increase in selling pressure could force the Bitcoin price toward the supports at $26,000, $25,000, and $24,000.

BTC/USD Medium-term Trend: Ranging (4H Chart)

On the 4-hour chart, the Bitcoin price is seen trading below the 9-day and 21-day moving averages. BTC/USD could survive the $29,000 support if the bulls return to the market and a break above the moving averages may create more gains for the coin.

BTCUSD – 4-Hour Chart

On that note, higher resistance could be located at $30,500 and above, and as the technical indicator, Relative Strength Index (14) could move to cross above the 40-level. On the other hand, if the bearish movement continues, the support level of $28,000 and below could be reached and the king coin may cross below the lower boundary of the channel.

You can purchase Bitcoin here. Buy BTC

Lucky Block Price Prediction: LBLOCK/USD Moves to Break Above $0.000110 Level

Lucky Block Price Prediction – July 24

The Lucky Block price prediction shows the LBLOCK is preparing to gain pace if it clears the $0.000110 resistance zone.

LBLOCK/USD Medium-term Trend: Ranging (1D Chart)

Key Levels:

Resistance levels: $0.000170, $0.000180, $0.000190

Support levels: $0.000048, $0.000038, $0.000028

Lucky Block Price Prediction: LBLOCK/USD Moves to Break Above $0.000110 Level
LBLOCKUSD – Daily Chart

LBLOCK/USD is getting ready to break above the 9-day and 21-day moving averages as the market price hovers at $0.000102. However, the signal line of the technical indicator Relative Strength Index (14) will confirm the bullish movement as soon as it breaks above the 50-level.

Lucky Block Price Prediction: LBLOCK Bulls Will Spike to the Upside

The Lucky Block price is preparing for the bullish movement as the buyers regroup to increase the buying pressure. However, if the coin spikes to the upside, it will head toward the upper boundary of the channel where it could hit the resistance levels of $0.000170, $0.000180, and $0.000190. On the downside, if the Lucky Block price drops below the lower boundary of the channel, it could reach the support levels at $0.0000048, $0.0000385, and $0.000028.

LBLOCK/USD Medium-term Trend: Ranging (4H Chart)

LBLOCK/USD is also exchanging hands around the 9-day and 21-day moving averages as the technical indicator Relative Strength Index (14) moves within the 50-level. However, a possible bearish drop could surface and any further bearish movement below the lower boundary of the channel could bring the coin to the support level of $0.000085 and below.

LBLOCKUSD – 4 Hour Chart

Nevertheless, if the bulls push the coin higher, the LBLOCK price can head toward the upper boundary of the channel. On its way to the upside, the market price would hit the resistance level of $0.000120 and above. Meanwhile, the trading volume is coming up slowly and will begin to climb higher if the technical indicator spikes to the north.

You can purchase Lucky Block here. Buy LBLOCK

Solana (SOL/USD) Price Retraces, Pushing Through Supports

Solana Price Prediction – July 21
Sensations of booming market operations have surfaced in the SOL/USD business up to the point of peaking, which has now started taking some other directions that signifies that the crypto-economic price is retracing, pushing through supports after hitting a resistance of $32.

Price would reset its stands instantly in accordance with standard technical procedure so that it could definitively finish a particular cycle of pushes. As of the time of this technical report, activity showing both buyer and bear presences has been concentrated between $25.61 and $25.09, maintaining a minute percentage rate of 0.20. It appears that some higher lows, in varying degrees, are starting to manifest in the sessions to follow.

SOL/USD Market
Key Levels:.
Resistance levels: $30, $32, $34
Support levels: $20, $18, $16

SOL/USD – Daily Chart
The SOL/USD daily chart showcases the crypto-economic retracements, pushing through supports from a higher-trading resistance spot of $32.

The indicators are staged below variant candlesticks to demonstrate that buyers will be facing bears’ efforts to make a comeback. To further buttress that reading, the 14-day SMA indicator is at $22.71 above the $20.75 point of the 50-day SMA indicator. The Stochastic Oscillators have well curved southbound from the overbought region to 32.69 and 14.79. The situation portends that there is a need to join the trade at this moment, irrespective of any direction.
Solana (SOL/USD) Price Retraces, Pushing Through Supports
Which direction is more risky given the SOL/USD trade’s present trading force?
The present pace velocity in the SOL/USD trade will potentially put to a shift procedure from being hiking as the crypto price retraces, pushing through supports below the resistance point of $32.

In order to see further pushes through the lower support lines of the current trading arena, the trend line of the smaller Moving Average has to breach southward with a degree of intensity toward the support trade zone of $20. A continuation breaking at that point to the south may make the price vulnerable to whipsawed trading conditions.

In the interim, as per the present reading of this technical analytics chart, buyers are to hold off on their decision for a while. It would as well be of greater value to allow the Stochastic Oscillators to reposition toward suggesting a northbound direction before making back paths to the upside.
Solana (SOL/USD) Price Retraces, Pushing Through Supports
SOL/BTC Price Analysis
In contrast, there have been traces that Solana has been trying to establish some degree of formidable force against the market strength of the counter-trading currency, Bitcoin.

The pairing crypto price retraces, pushing through supports after the price hit significant resistance above the trend lines of the sMAs. The 14-day SMA indicator has briefly passed through the 50-day SMA indicator to the north. The Stochastic Oscillators have crossed southbound from the overbought region, positioning from 45.55 to 27.74 values. With the current rate of decline, lengthy, steady lines won’t be possible. However, there might be a requirement to keep the price in limbo in order to conceivably torture fraudulent sessions southward.

Note: Cryptosignals.org is not a financial advisor. Do your research before investing your funds in any financial asset or presented product or event. We are not responsible for your investing results.

You can purchase Lucky Block here. Buy LBLOCK

SPONGE/USD ($SPONGE) Bulls Begin to Turn the Market in Their Favor

Continuous bearish pressure has caused the $SPONGE bulls to shift their baseline below the $0.00013 price level. The bulls seem to have firmly secured their position at $0.0001267, and from here, we have noticed the market gaining upward momentum, now crossing above the 9-day moving average.

Key Levels

  • Resistance: $0.0004, $0.0045, and $0.0005.
  • Support: $0.00012, $0.00011, and $0.00009

SPONGE/USD ($SPONGE) Bulls Begin to Turn the Market in Their Favor

SPONGE/USD ($SPONGE) Price Analysis: The Indicators’ Point of View

The Moving Average Convergence and Divergence (MACD) Indicator indicates a bullish crossover below level zero in the $SPONGE market, signaling a shift in favor of the bulls. However, there is a cause for concern as the two MACD lines suggest low bullish momentum, with the upward movement of the line not being particularly strong. This could be attributed to the market facing resistance below the 20-day moving average line.

SPONGE/USD ($SPONGE) Bulls Begin to Turn the Market in Their Favor

SPONGE/USD Short-Term Outlook: 1-Hour Chart

In a smaller timeframe, the Bollinger Bands indicator shows an upward-moving price channel. However, the price action performing above the upper standard deviation line may indicate that the $SPONGE market is in the overbought territory, leading to a price correction back within the bands of the indicator. Nonetheless, the price continues its upward trajectory, and SPONGE seems to have the potential for further bullish actions.

Before the $SPONGE airdrop is over, sign up! Enter right away to receive wonderful incentives!


Invest in the hottest and best meme coin. Buy Sponge ($SPONGE) today!

Dogecoin (DOGE/USD) Bull Market Enters the $0.0750 Price Zone

The Dogecoin market found a strong bullish trend in the second half of June, and this trend has been supporting the bull market ever since as it reaches new price levels. The bull market encountered the $0.0750 resistance level on July 15 and tested it again on July 21. In today’s market, the price is now above this resistance level. The Dogecoin bulls need to continue this momentum to sustain the upward trend.

Dogecoin Market Data

  • DOGE/USD Price Now: $0.0754
  • DOGE/USD Market Cap: $10,663,145,651
  • DOGE/USD Circulating Supply: 140,304,086,384 DOGE
  • DOGE/USD Total Supply: 140,304,086,384
  • DOGE/USD CoinMarketCap Ranking: #8

Dogecoin (DOGE/USD) Bull Market Enters the $0.0750 Price Zone

Key Levels

  • Resistance: $0.078, $0.080, and $0.082.
  • Support: $0.0660, $0.0630, and $0.0589

Price Prediction for Dogecoin: The Indicators’ Point of View

The Dogecoin Bulls have been able to conserve the bullish price by securing a higher support level at each of the price retracements. This has kept the price channel moving upward. The Bollinger Bands indicator portrays a market that is trending upward. As the market approaches the $0.075 resistance level, the outlook of the candlesticks reveals that the market has become more volatile. Today’s market is represented by a spinning top candle, and the volume indicator shows a stronger bar, indicating an influx of traders within the trading session.

Dogecoin (DOGE/USD) Bull Market Enters the $0.0750 Price Zone

DOGE/USD 4-Hour Chart Outlook

In the shorter time frame, the bulls seek support above the $0.0750 price level. With the appearance of a long-legged doji above this crucial price level, the bulls might eventually convert this resistance into their new higher support level. Going by these indications, the Dogecoin market has room for more bullish price performance.

Buy Dogecoin on eToro.