SPONGE/USD ($SPONGE) Bulls Regroup at $0.0001189, Ready to Take the Market Above $0.00012

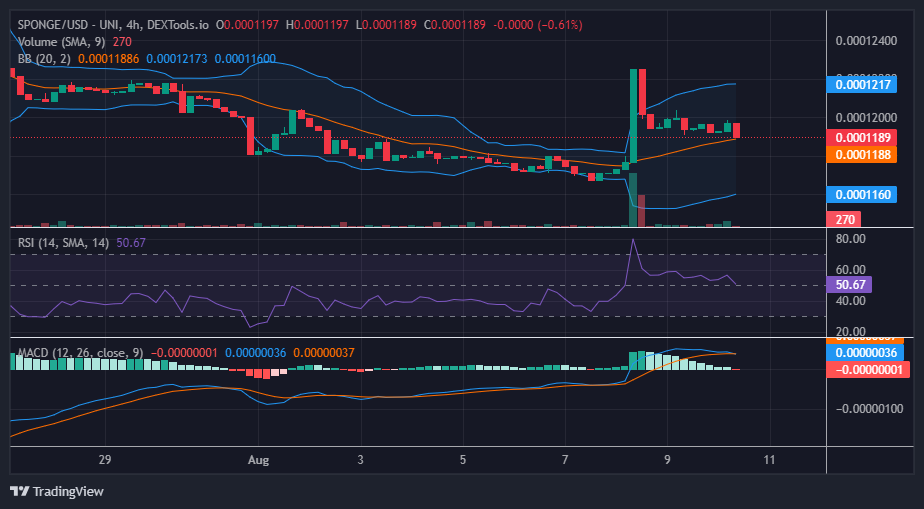
The recent bullish surge has established an elevated demand level for the SPONGE/USD market, precisely at $0.0001189. Initially, it was positioned at $0.00012; however, the bullish momentum faltered in the face of bearish pressure at this level. Consequently, the bulls were compelled to regroup just beneath the critical $0.00012 price threshold. In the current scenario, there’s a sense of anticipation for a more robust bullish advance.

Key Levels

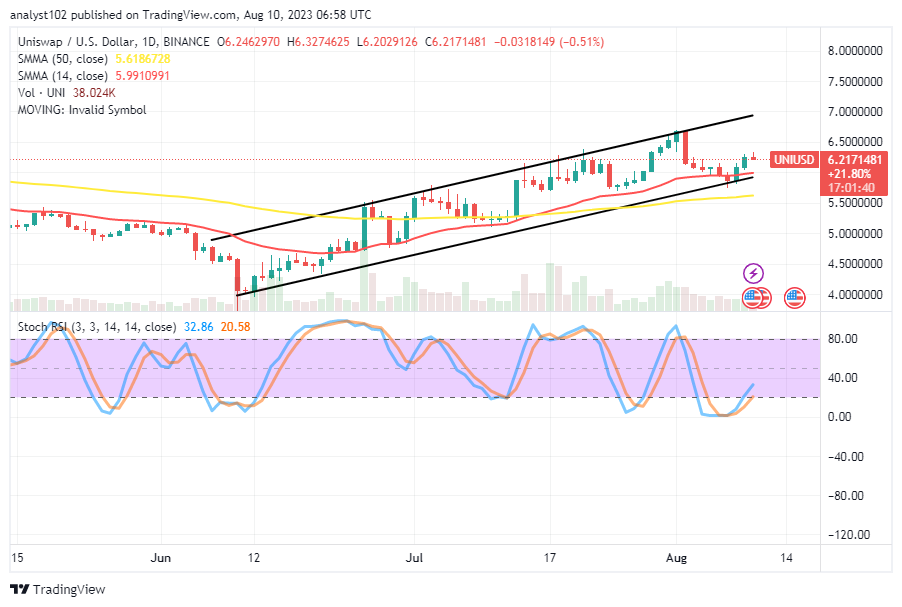
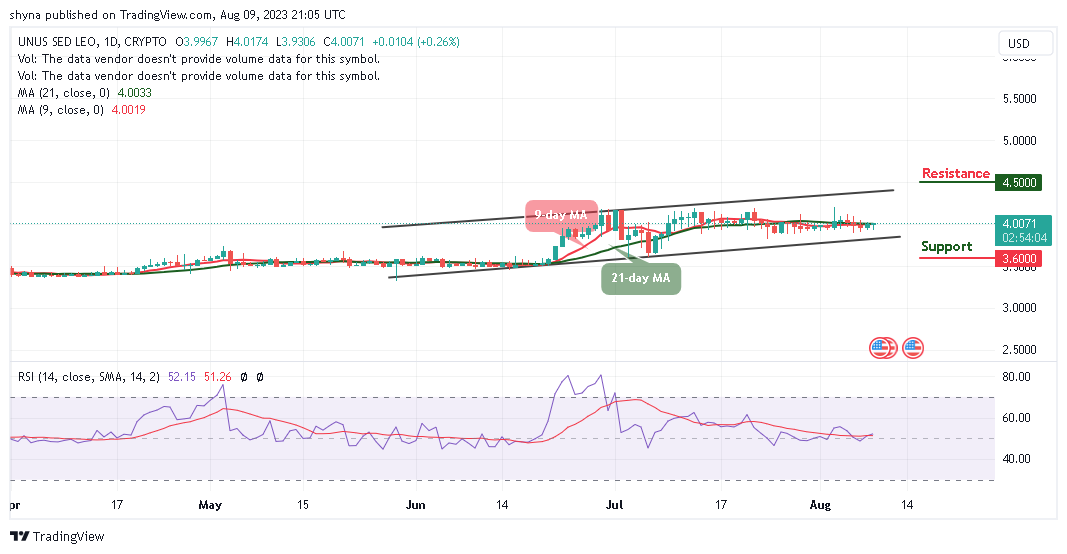
  • Resistance: $0.0004, $0.0045, and $0.0005.
  • Support: $0.00011, $0.00010, and $0.00009.

SPONGE/USD ($SPONGE) Bulls Regroup at $0.0001189, Ready to Take the Market Above $0.00012

Sponge (SPONGE/USD) Price Analysis: The Indicators’ Point of View

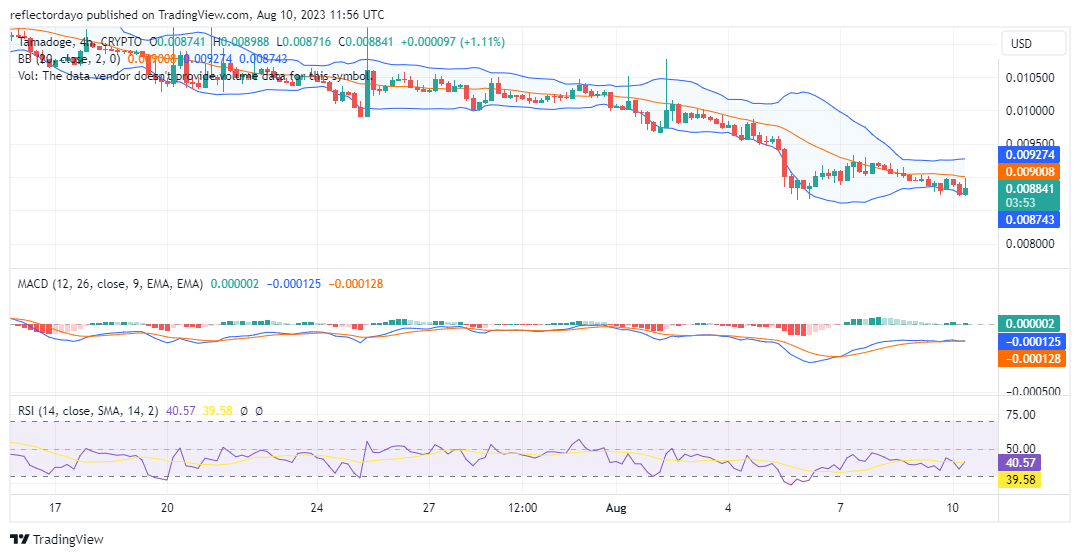
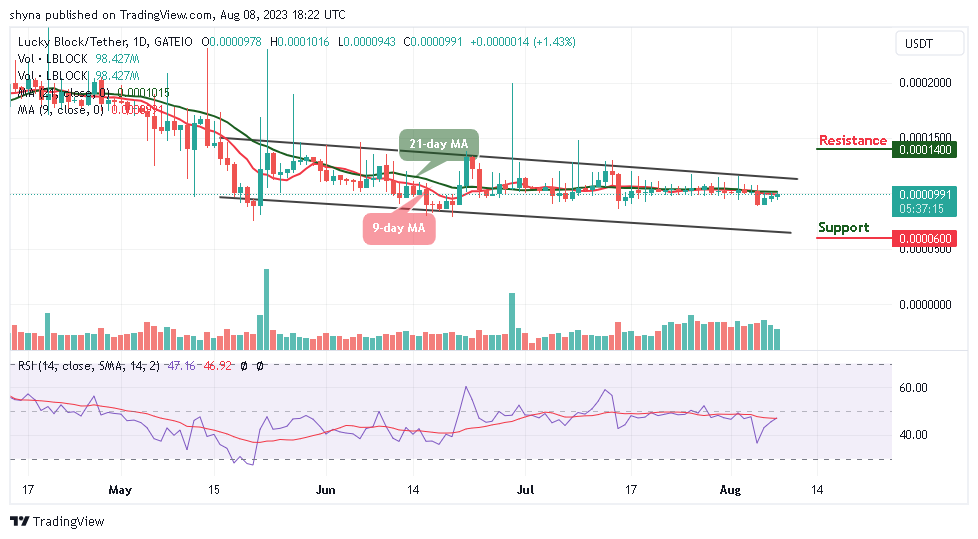
 The Bollinger Bands indicator and the Relative Strength Index both depicted the SPONGE/USD market retracing towards the equilibrium level. This equilibrium point aligns with the emerging new demand level. Consequently, we expect a rebound around this level, notwithstanding the impression that bearish pressure has nudged the bullish market toward the brink of the sell zone.

Examining the Moving Average Convergence and Divergence (MACD) indicator, the market is currently situated in the bullish zone, positioned above the zero level. However, the histograms display a subdued green shade, accompanied by diminishing heights. Simultaneously, the two MACD lines have recently intersected.

SPONGE/USD ($SPONGE) Bulls Regroup at $0.0001189, Ready to Take the Market Above $0.00012

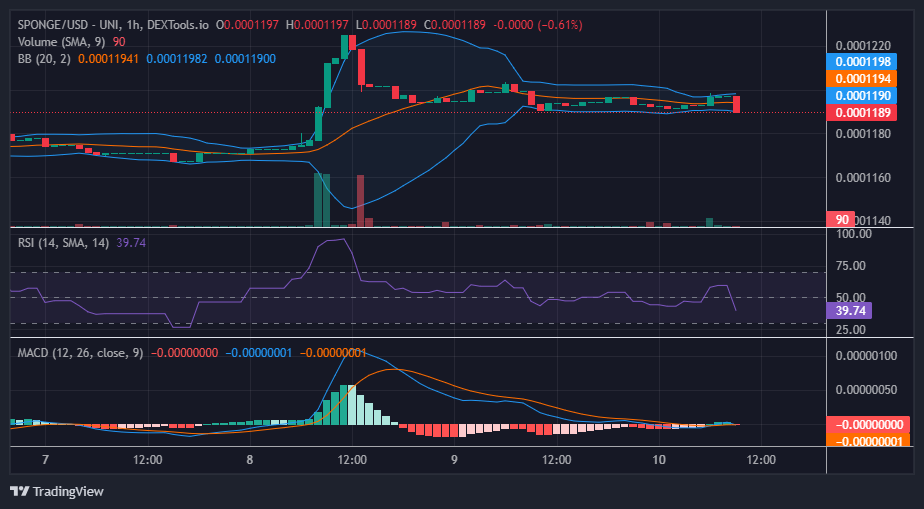
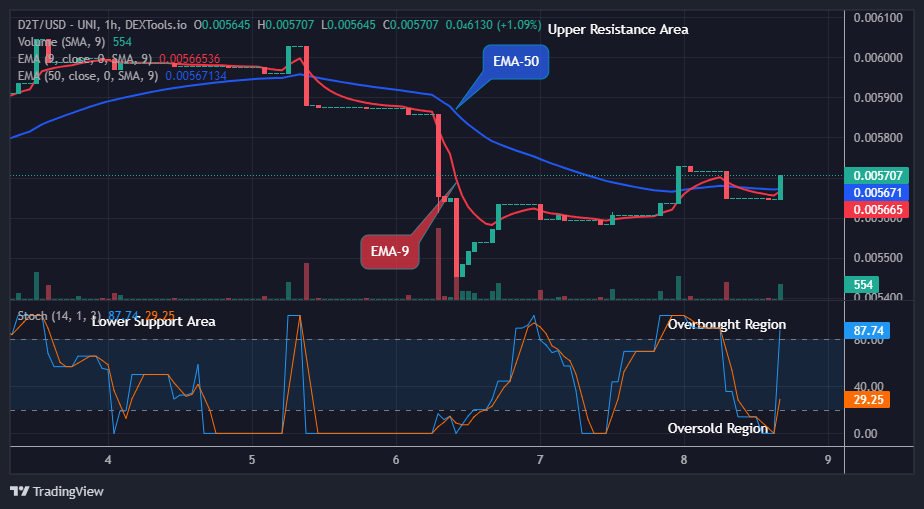
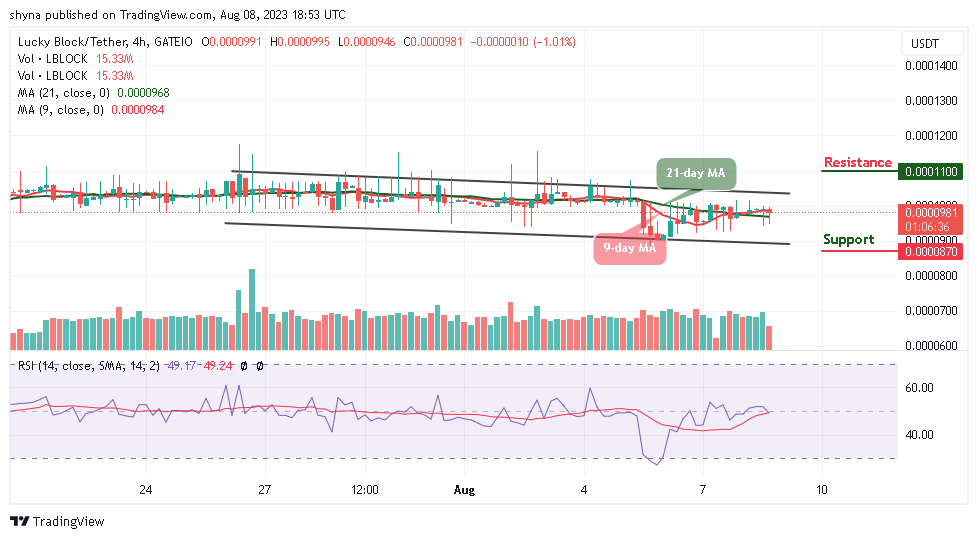
$SPONGE Short-Term Outlook: 1-Hour Chart

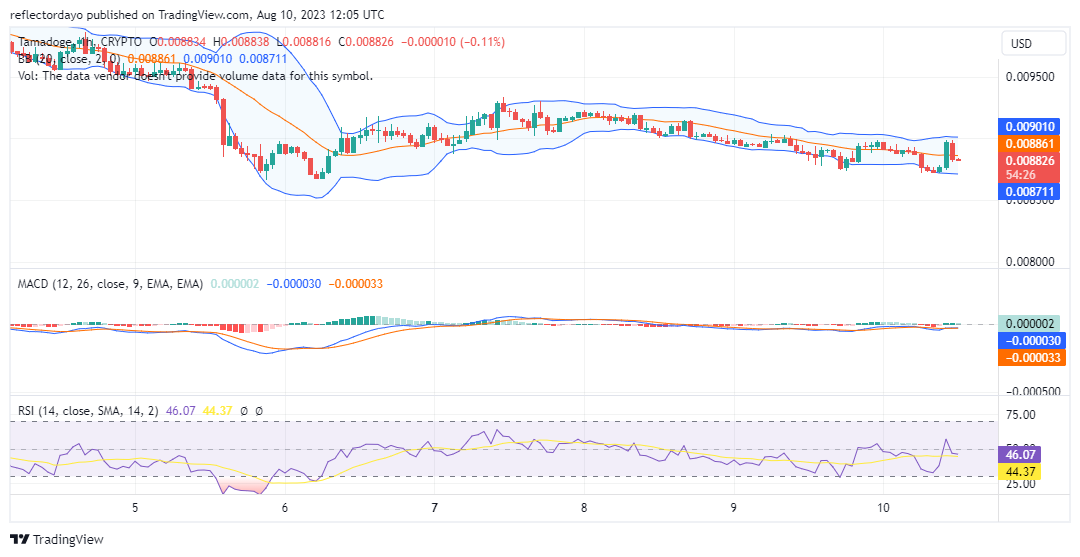
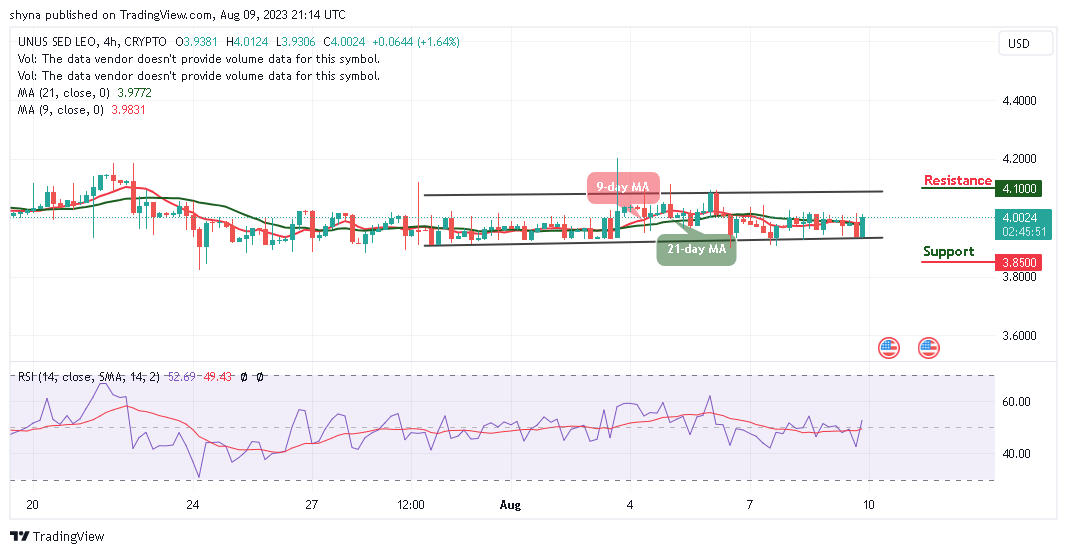
Although the most recent bearish candlestick from the 1-hour chart’s perspective implies a robust movement, the indicators appear to diverge from this market development. While the bearish candle seems to reflect dominant bearish sentiment during the last 1-hour trading session, the narrower standard deviation of the Bollinger Bands indicator contradicts this notion. Additionally, the volume of trade indicator lacks a corresponding histogram to validate this trend.

Consequently, there is a possibility that this bearish momentum is poised to diminish, potentially paving the way for bullish control to establish itself at this juncture.

The SPONGE/USD airdrop is still ongoing; don’t let this opportunity slip by.

Invest in the hottest and best meme coin. Buy Sponge ($SPONGE) today!

Gemini Adds XRP to Its Crypto Listing for the First Time

Gemini, a renowned and trailblazing cryptocurrency exchange, has set the stage for an exciting development by announcing its resolute support for Ripple’s XRP token. This strategic move not only underscores the robust progress of both Gemini and XRP but also signals a noteworthy advancement within the ever-dynamic realm of digital currencies.

XRP, the very heartbeat of Ripple’s blockchain-based network, has garnered resounding acclaim for its unparalleled capacity to facilitate swift and cost-effective cross-border payments. With a steadfast adoption trajectory among prominent financial institutions, banks, and remittance services worldwide, XRP has undoubtedly solidified its position as a powerhouse in the crypto landscape.

Impressively, it claims the fifth spot in the cryptocurrency market hierarchy per CoinMarketCap data, a testament to its significance.

XRP to Be Traded Against Six Currencies on Gemini

The curtains have risen on Gemini’s latest act, revealing the commencement of XRP deposits onto its esteemed platform, with the grand act of trading poised to unfold in the imminent future. This forthcoming trading spree will encompass an array of fiat trading pairs, encompassing an expansive spectrum of currencies, including USD, GBP, CAD, AUD, HKD, and SGD.

Gemini’s meticulously designed rollout strategy casts XRP onto center stage, first via the API/FIX and ActiveTrader applications for the USD trading pair, subsequently extending its reach to embrace the Gemini website and the user-friendly mobile application across a wider range of fiat pairs.

Within the vibrant XRP community, an air of jubilance and optimism prevails, reverberating across the social media landscape. The community’s enthusiasm is notably rooted in Gemini’s unwavering adherence to exacting listing standards, a resounding validation of XRP’s credibility and robustness.

Observers also posit that this strategic partnership could potentially trigger a ripple effect (no pun intended), compelling other exchanges to contemplate the reintegration of XRP. This sentiment gains further traction against the backdrop of XRP’s ongoing legal entanglement with the US Securities and Exchange Commission (SEC).


You can purchase Lucky Block here. Buy LBLOCK

Tamadoge (TAMAUSD): A Positive Outlook Awaits Traders in Tamadoge Market

The ongoing struggle between demand and supply within the TAMAUSD market is evident. It seems that the bullish side is on the verge of establishing a sturdy support foundation just under the $0.009 price mark. While the market had maintained a position above this threshold in the preceding daily session, the influence of robust bearish pressure has compelled the price to dip below this crucial level. As a result, the bulls are compelled to reorganize around $0.0087, aiming to establish a robust base for launching a vigorous upward counteroffensive.

Tamadoge (TAMAUSD): A Positive Outlook Awaits Traders in Tamadoge Market

Key Levels     

  • Resistance: $0.035, $0.040, and $0.045
  • Support: $0.0090, $0.0087, and $0.0070.

TAMAUSD Price Analysis: The Indicators’ Point of View

Examining the market through the lens of the three indicators employed in this analysis reveals that the TAMAUSD market remains under significant bearish pressure. Nevertheless, the bulls have successfully established a robust support level, a foundation from which they intend to reshape the market’s trajectory. The price consolidation signifies the discovery of a solid footing, potentially serving as a launching pad for future market movement.

However, the bulls must contend with immediate resistance residing within the bearish zone. Viewing the scenario from the perspective of the Bollinger Bands indicator, the upcoming resistance point lies below the 20-day moving average. Consequently, this indicates that the bears are still exerting their influence.

Tamadoge (TAMAUSD): A Positive Outlook Awaits Traders in Tamadoge Market

Tamadoge Short-Term Outlook: 1-Hour Chart

It’s worth noting that notable bullish candlesticks have made their presence apparent within this time frame, showcasing a clear bullish bias. This observation suggests the potential for favorable momentum to arise, given the evident strengthening of buying pressure. At present, the market is situated around its midpoint. As indicated by the available indicators, the market seems poised for a pivotal shift.

Get your hands on the Tamadoge games.

Do you want a coin that will be 100 times more valuable in the next few months? That is Tamadoge. Buy TAMA today!

Bancor (BNT/USD): The Bulls Are Aggressive, and the Price of the Market Is on the Rise

Since July 1, the Bancor market has been exhibiting a confined horizontal trading range. However, during the span from July 1 to 5, trading volume witnessed an uptick, signifying heightened interest. Despite this, discernible price movement remained absent. Subsequently, the market continued to conform to a consolidating trend for the remainder of the month.

A notable shift in market dynamics emerged on August 4. At this juncture, the market identified a support level at $0.357, indicating a potential shift in trader sentiment. This particular support level seemingly drew in buyers, potentially denoting a pivotal moment. Augmenting this shift, there was a notable surge in trading volume on the same day, underscoring escalated market activity.

 Bancor Market Data

  • BNT/USD Price Now: $0.5738
  • BNT/USD Market Cap: $84,048,198
  • BNT/USD Circulating Supply: 146,477,940 BNT
  • BNT/USD Total Supply: 161,196,921 BNT
  • BNT/USD CoinMarketCap Ranking: #268

Bancor (BNT/USD): The Bulls are Aggressive, and the Price of the Market Is on the Rise

Key Levels

  • Resistance: $0.65, $0.70, and $0.80.
  • Support: $0.35, $0.30, and $0.25.

Price Prediction for Bancor: The Indicators’ Point of View

The Bancor market’s response to the support level at $0.357 was explosive, with a surge in trading volume propelling the BNT/USD pair into a higher price channel. This channel is defined by the $0.500 and $0.600 price levels. The breach of the $0.500 price level marked a significant bullish development, potentially attracting further buying interest.

The heightened volatility since August 4 is reflected in the behavior of the Bollinger Bands. The divergence of the Bollinger Bands suggests that the market is experiencing increased price fluctuations. This is consistent with the explosive move and subsequent oscillations within the newly established price channel. Heightened volatility often indicates uncertainty and can result in sharp price swings in either direction.

Bancor (BNT/USD): The Bulls are Aggressive, and the Price of the Market Is on the Rise

BNT/USD 4-Hour Chart Outlook

On a more compact timeframe, the range encompassed by the swing is transitioning towards the $0.700 price range. Given the current market conditions, traders and investors could be seeking potential resistance zones rooted in historical price patterns and psychological thresholds, such as the $0.80 or $1.00 levels. Notably, yesterday’s peak represents the highest point the market has reached this year, suggesting the possibility of resistance emerging around this particular level.

 Buy Bancor on eToro.

Uniswap (UNI/USD) Price Springs Up, Faces $6.50 Resistance

Uniswap Price Prediction – August 10
The Uniswap operation price springs up and faces the $6.50 resistance line after finding support between $6 and $5.50.

At the conclusion of the majority of the corrections attempted in the pattern over a lengthy session up until the present, the crypto business economic movers have come to affirm their presence over the infirmities of bears in light of the settings of the bush channels. As it is, the price is fluctuating about $6.2171481 at a minutely negative percentage rate of 0.51.

UNI/USD Market
Key Levels:
Resistance levels:$7, $7.50, $8
Support levels: $5.50, $5, $4.50

UNI/USD – Daily Chart
The UNI/USD daily chart showcases that the crypto-economic price springs up and faces the $6.50 resistance line within well-defined bullish channels.

The 14-day SMA trend line is at $5.9910991, supported by the drawing of the lower bullish channel line. The Stochastic Oscillators About four days ago, a bearish candlestick formed to signify an end to a falling drive that averaged $5.
Uniswap (UNI/USD) Price Springs Up, Faces $6.50 Resistance
Where is the strong resistance area where the bears of the UNI/USD market plan to retaliate?
A lot of patience will have to play out ahead of letting the UNI/USD market push through some higher points to around $7 to let there be other potential spots to allow sellers to make a re-launch, given that the crypto-economic price springs up and faces $6.50 resistance.

Decent buying activities will remain invalid once a retracement process or processes are allowed to surface to the point of the path of the 14-day Moving Average before getting a bouncing moment to produce a bullish candlestick to signify a stop to free fall-offs.

Bears may need to immediately execute a short sale below the point of $6.50 and use that price as the basis for their stop-loss order, according to the current force in the price. The point of resistance around $7 remains the best place to see a halt to upsurges, nevertheless, if that doesn’t happen positively.
Uniswap (UNI/USD) Price Springs Up, Faces $6.50 Resistance
UNI/BTC Price Analysis
In contrast, the Uniswap market springs up and faces overhead variant resistances within well-defined bullish channel trend lines drawn across the Moving Averages.

The stochastic oscillators are now positioned between 14.86 and 25.62 after crossing northward from the oversold area. With that value arrangement, the base cryptocurrency is attempting to defend itself more effectively against whatever imminent force the counter cryptocurrency may be currently developing. Over the 50-day SMA is the 14-day SMA. Additionally, they highlight the crucial bottom from which the market must continue rising.

Note: Cryptosignals.org is not a financial advisor. Do your research before investing your funds in any financial asset or presented product or event. We are not responsible for your investing results.

You can purchase Lucky Block here. Buy LBLOCK

ApeCoin (APEUSD) Declines Further as Price Returns From the Daily Bearish Order Block

APEUSD Analysis: Market Declines Further As Price Returns From Daily Bearish Order Block

APEUSD declines further as the price returns from the daily bearish order block. The market has typically been under selling pressure for a long time. The market decline occurred in response to the RSI (Relative Strength Index) signal in late January 2023 which indicated the market was overbought. APEUSD has since been declining in fractals as more bears enter the market.

APEUSD Significant Zones
Demand Zones: $1.810, $1.200
Supply Zones: $2.610, 3.820

ApeCoin (APEUSD) Declines Further as Price Returns From the Daily Bearish Order Block

APEUSD began to decline algorithmically under pressure after the last overbought indication of the RSI in late January 2023. Following the indication, the price headed downward to breach the previous support at $3.820. After breaching the previous $3.820 support, the price expanded upward until a rejection block formed at the lower low. After the formation of the rejection block, the price retraced to hit the $3.820 previous support to return into the rejection block. As a result of the bearish pressure at the rejection block, APEUSD crashed massively.

The massive crash eventually caused an invalidation of the previous $3.820 support as the price sank rapidly into the discount zone. Algorithmically, prices reacted at premium arrays to continue declining. After the bounce off the diagonal support in mid-June, APEUSD surged into an FVG (Fair Value Gap). The buying pressure at the $1.810 support seems to be strongly opposing a further decline. However, the reaction of the price toward the daily bearish order block might end the ongoing consolidation phase. Consequently, coupled with the market’s overall direction, the resumption of the decline is highly probable.

ApeCoin (APEUSD) Declines Further as Price Returns From the Daily Bearish Order Block

Market Expectation

On the four-hour chart, APEUSD is currently bearish. As the price leaves the overbought region, the market has been crashing rapidly to the downside. The decline is expected to continue until the price reaches the psychological level of $1.200.


How To Buy   Lucky Block

NoteCryptosignals.org   is not a financial advisor. Do your research before investing your funds in any financial asset or presented product or event. We are not responsible for your investing results.

Dash 2 Trade Price Predictions for Today, August 10: D2TUSD Price Potential for a Bullish Continuation, Purchase Now!

Dash 2 Trade Price Forecast: D2TUSD Price Potential for a Bullish Continuation, Purchase Now! (August 10)
D2TUSD has the potential for a bullish continuation as the coin trades above the supply trend levels. The nearest resistance of the crypto is between levels $0.00570 to $0.00572, whereas the most immediate resistance is found around the $0.00570 value. There is a higher probability of a price-breaking resistance zone if the buy traders can double their efforts.


Key Levels:
Resistance levels: $0.01000, $0.01100, $0.01200
Support levels: $0.00800, $0.00700, $0.00600

D2T (USD) Long-term Trend: Bullish (4H Chart)
D2TUSD remains bullish on the higher time frames. This is clear as we can see the prices trading above the EMA-9 moving towards the overhead resistance, indicating an uptrend.
Dash 2 Trade Price Predictions for Today, August 10: D2TUSD Price Potential for a Bullish Continuation, Purchase Now!
The sustained bullish pressure at the $0.00560 high value in the previous action has made it capable for the crypto to remain stronger above the supply trend lines in its recent high.

The bulls’ action increases the price up to a $0.00750 high level even as the 4-hourly session opens today. This simply means that the buying traders are actually active at this level. Thus, a break above the $0.00667 price level would intensify the buying pressure on the crypto.

Next, is the fact that the market price of Dash 2 Trade is pointing upwards on the daily stochastic, this will draw more buy traders to the market for a bullish continuation pattern, if that occurs the price could further climb toward a $0.1000 upper high level and this will add to the bullish race in the future in its long-term outlook.

D2T (USD) Medium-term Trend: Bullish (1H Chart)
The cryptocurrency is also trading in a bullish market zone in the lower time frame. The price of D2TUSD can be seen above the moving averages, making higher highs and higher lows.
Dash 2 Trade Price Predictions for Today, August 10: D2TUSD Price Potential for a Bullish Continuation, Purchase Now!
The price of Dash 2 Trade can now be seen progressing upward above the moving averages. This shows that buyers are currently gaining more strength in the market.

The market price of D2TUSD which increases from $0.00564 to a $0.00570 high level above the moving averages suggests an uptrend in the context of the strength of the market. Thus, closing the 4-hourly session above the $0.00602 supply value will put the trade more on the buy side.

In addition, the coin is in an upward direction on the daily stochastic, more buyers’ participation is a prerequisite at the moment. We expect the coin price to reach the $0.1000 upper resistance value amid sustained buying pressure in the coming days in its medium time frame.

Our “End-of-month look-back” is now available! In the realm of cryptocurrency, 5 points are assigned to bulls and bears.


Want a coin that has a huge potential for massive returns? That coin is Dash 2 Trade. Buy D2T

UNUS SED LEO Price Prediction: LEO/USD Price Could Rally to $4.20 Resistance

UNUS SED LEO Price Prediction – August 9

The UNUS SED LEO price prediction shows that LEO is going to face moderate volatility as the coin moves to cross above the 21-day moving average.

LEO/USD Long-term Trend: Ranging (1D Chart)

Key Levels:

Resistance levels: $4.5, $4.7, $4.9

Support levels: $3.6, $3.4, $3.2

UNUS SED LEO Price Prediction: LEO/USD Price Could Rally to $4.20 Resistance
LEOUSD – Daily Chart

LEO/USD is moving to cross above the 9-day and 21-day moving averages as the market price hovers at $4.0 with a daily gain of 0.26%. However, as the coin moves to create additional gains, a potential resistance can be found at the $4.2 level. On the contrary, sliding below the lower boundary of the channel may hit the closest support at $3.8.

UNUS SED LEO Price Prediction: LEO/USD Ready for a Spike to the North

Looking at the daily chart, with the confirmation of the technical indicators, the UNUS SED LEO price is going to create additional bullish trends as the Relative Strength Index (14) is moving above the 50-level, warming up for a positive movement.

Nevertheless, LEO/USD bulls will push the coin to cross above the 9-day and 21-day moving averages, but any bearish movement toward the south could bring the UNUS SED LEO price to a downtrend where the new investors can take advantage of investing in the coin. However, the support levels for LEO/USD can be located at $3.6, $3.4, and $3.2, while the resistance levels lie at $4.5, $4.7, and $4.9.

LEO/USD Medium-term Trend: Ranging (4H Chart)

The UNUS SED LEO is moving above the 9-day and 21-day moving averages as the coin prepares for the upside. However, the nearest resistance could be set near the channel’s upper boundary for the market price to touch the nearest resistance level of $4.05.

LEOUSD – 4-Hour Chart

However, if the UNUS SED LEO price slides below the 9-day moving average, it can create a new low, and crossing below the lower boundary of the channel could hit the support level of $3.85 and below. Meanwhile, as the technical indicator, Relative Strength Index (14) moves above the 50-level, the market will form a new trend and could hit the resistance level at $4.10 and above.

Place winning LEO trades with us. Get LEO here

Lucky Block Price Prediction: LBLOCK/USD Will Retracement Above $0.000100

Lucky Block Price Prediction – August 8

The Lucky Block price rebounds from the early dip at $0.000094 as the buying interest may increase on approach to $0.000100.

LBLOCK/USD Long-term Trend: Ranging (1D Chart)

Key levels:

Resistance Levels: $0.000140, $0.000150, $0.000160

Support Levels: $0.000060, $0.000050, $0.000040

Lucky Block Price Prediction: LBLOCK/USD Will Retracement Above $0.000100
LBLOCKUSD – Daily Chart

LBLOCK/USD is ranging as the market establishes a cross above $0.000100 but currently rebounding to retain the previous resistance at $0.000099. The buyers may begin to look for some resistance levels if the coin crosses above the 9-day and 21-day moving averages.

Lucky Block Price Prediction: LBLOCK Price May Reclaim $0.000100 Resistance

In the past few hours, after the Lucky Block price touches the daily low of $0.000099, the coin could now face the resistance level of $0.00110 and looking forward to the resistance level of $0.000120. However, the daily chart reveals that if the 9-day moving average crosses above the 21-day moving average, it will confirm the next direction of the coin.

At the time of writing, the technical indicator Relative Strength Index (14) may cross above the 40-level to indicate a bullish movement. Therefore, if the Lucky Block price breaks above the 9-day and 21-day moving averages, it could hit the resistance levels of $0.000140, $0.000150, and $0.000160, but any bearish movement below the lower boundary of the channel could hit the supports at $0.000060, $0.000050, and $0.000040.

LBLOCK/USD Medium-Term Trend: Ranging (4H Chart)

According to the 4-hour chart, the Lucky Block price is seen moving sideways within the 9-day and 21-day moving averages as the technical indicator Relative Strength Index moves above the 50-level. From above, if the Lucky Block price heads toward the upper boundary of the channel, the bullish influence could spike, and the accrued gains above the channel.

LBLOCKUSD – 4 Hour Chart

However, the current candle could fail to cross above the moving averages, and the ultimate target remains at $0.000087 and below but the best the bulls can do is to hold above the resistance level of $0.000100 and keep their attention on breaking the potential resistance at $0.000110 and above.

You can purchase Lucky Block here. Buy LBLOCK