Pepe (PEPE/USD) Experiences Strong Trend Reversal

PEPE/USD Price Analysis: PEPE/USD Breaks Above Trend Line With Momentum

PEPE/USD broke above the trend line with a momentum candle at the price level $0.00000480, signaling the entry of institutions. This marks the end of bears’ domination that lasted from August to January and the beginning of an uptrend. The strong candle that broke trendline on January shows that buyers are confident and ready to push price higher. It also shows that sellers are weak and cannot control the market. The trend looks strong and may continue upward for a long time

PEPE/USD Key Levels

Support Levels: $0.00000390, $0.00000380
Resistance Levels: $0.00000930, $0.00000070

Pepe (PEPE/USD) Experiences Strong Trend Reversal

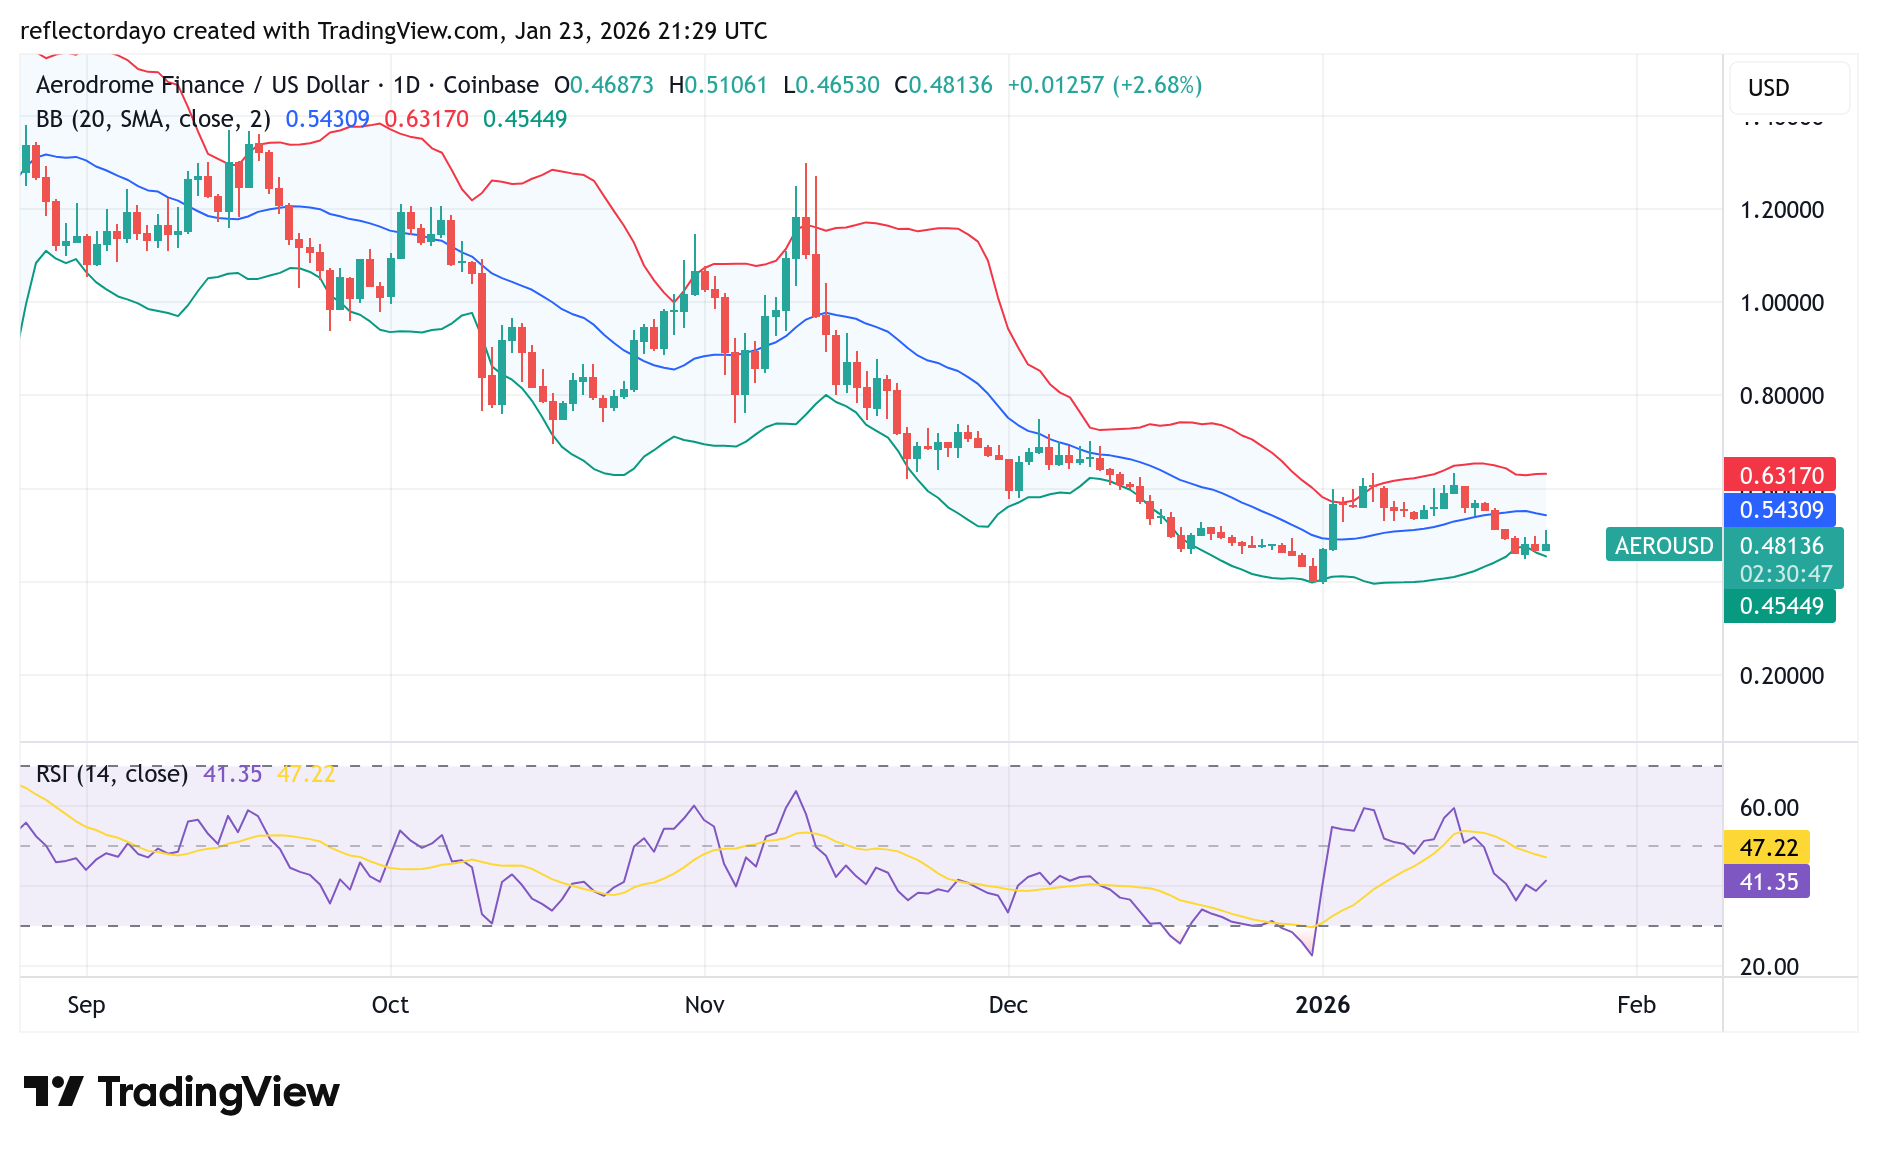
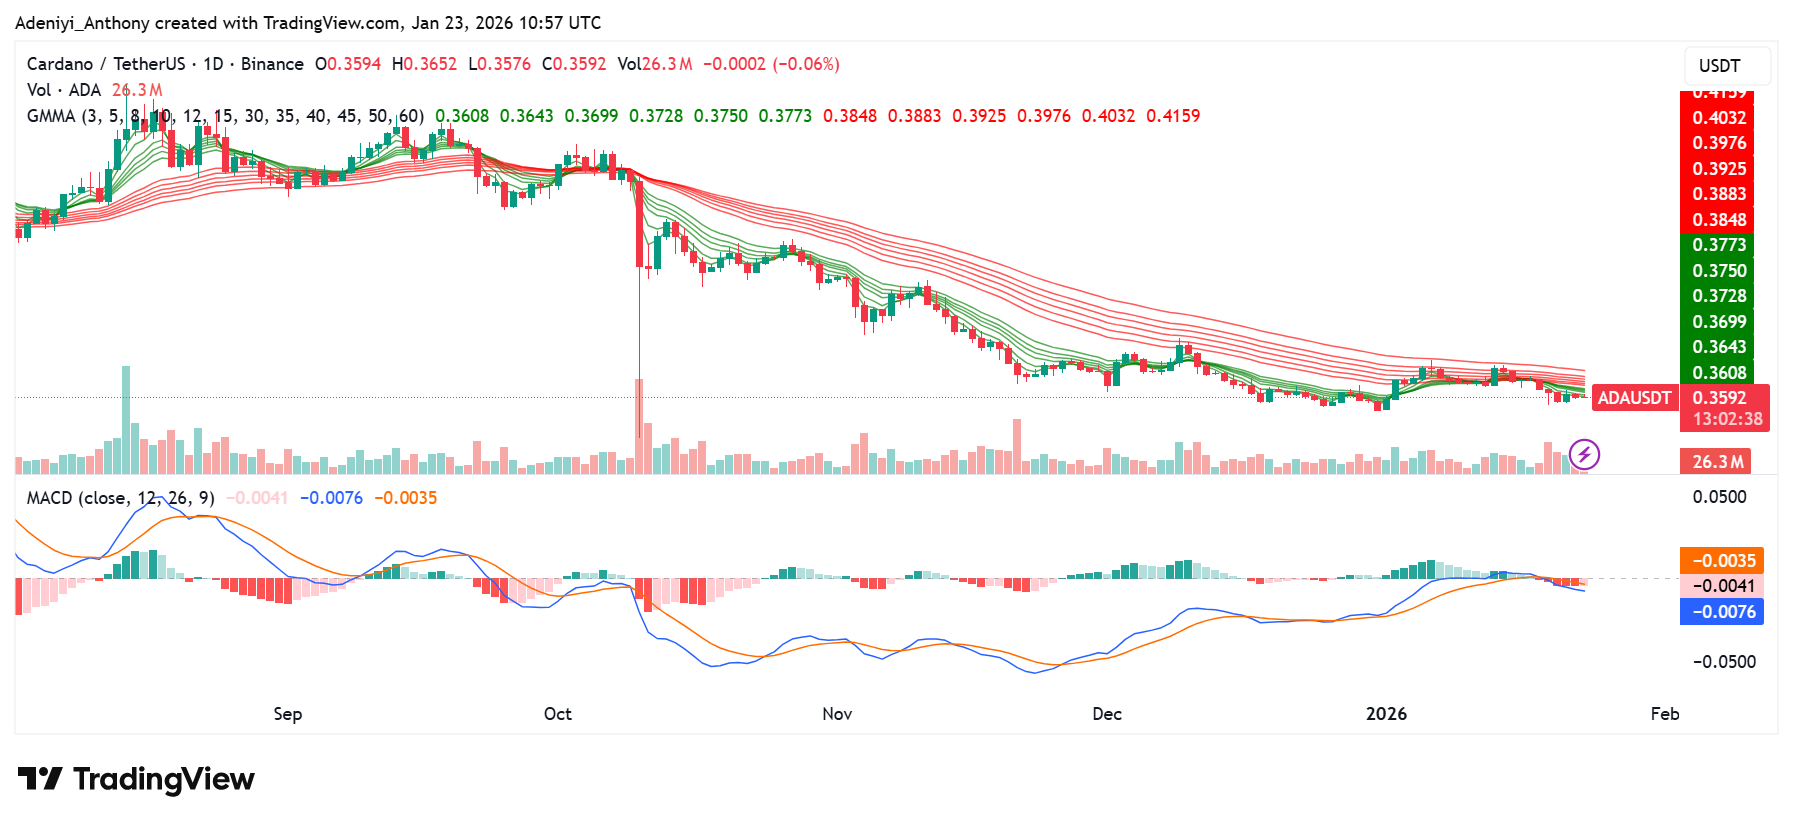
The daily timeframe shows a double bottom followed by a liquidity grab at the price level $0.00000390. This happened at the support of the trend line, making the liquidity sweep more valid. It shows the footprint of institutions willing to push price higher. That liquidity sweep is an early sign that the trend may shift upward because whales just entered the market

On the daily timeframe, the Moving Average Cross (MA Cross) at the price $0.00000420 favors the beginning of an uptrend. The 9 MA crossing above the 21 MA in January adds early bullish trend confirmation

Pepe (PEPE/USD) Experiences Strong Trend Reversal

Market Expectation

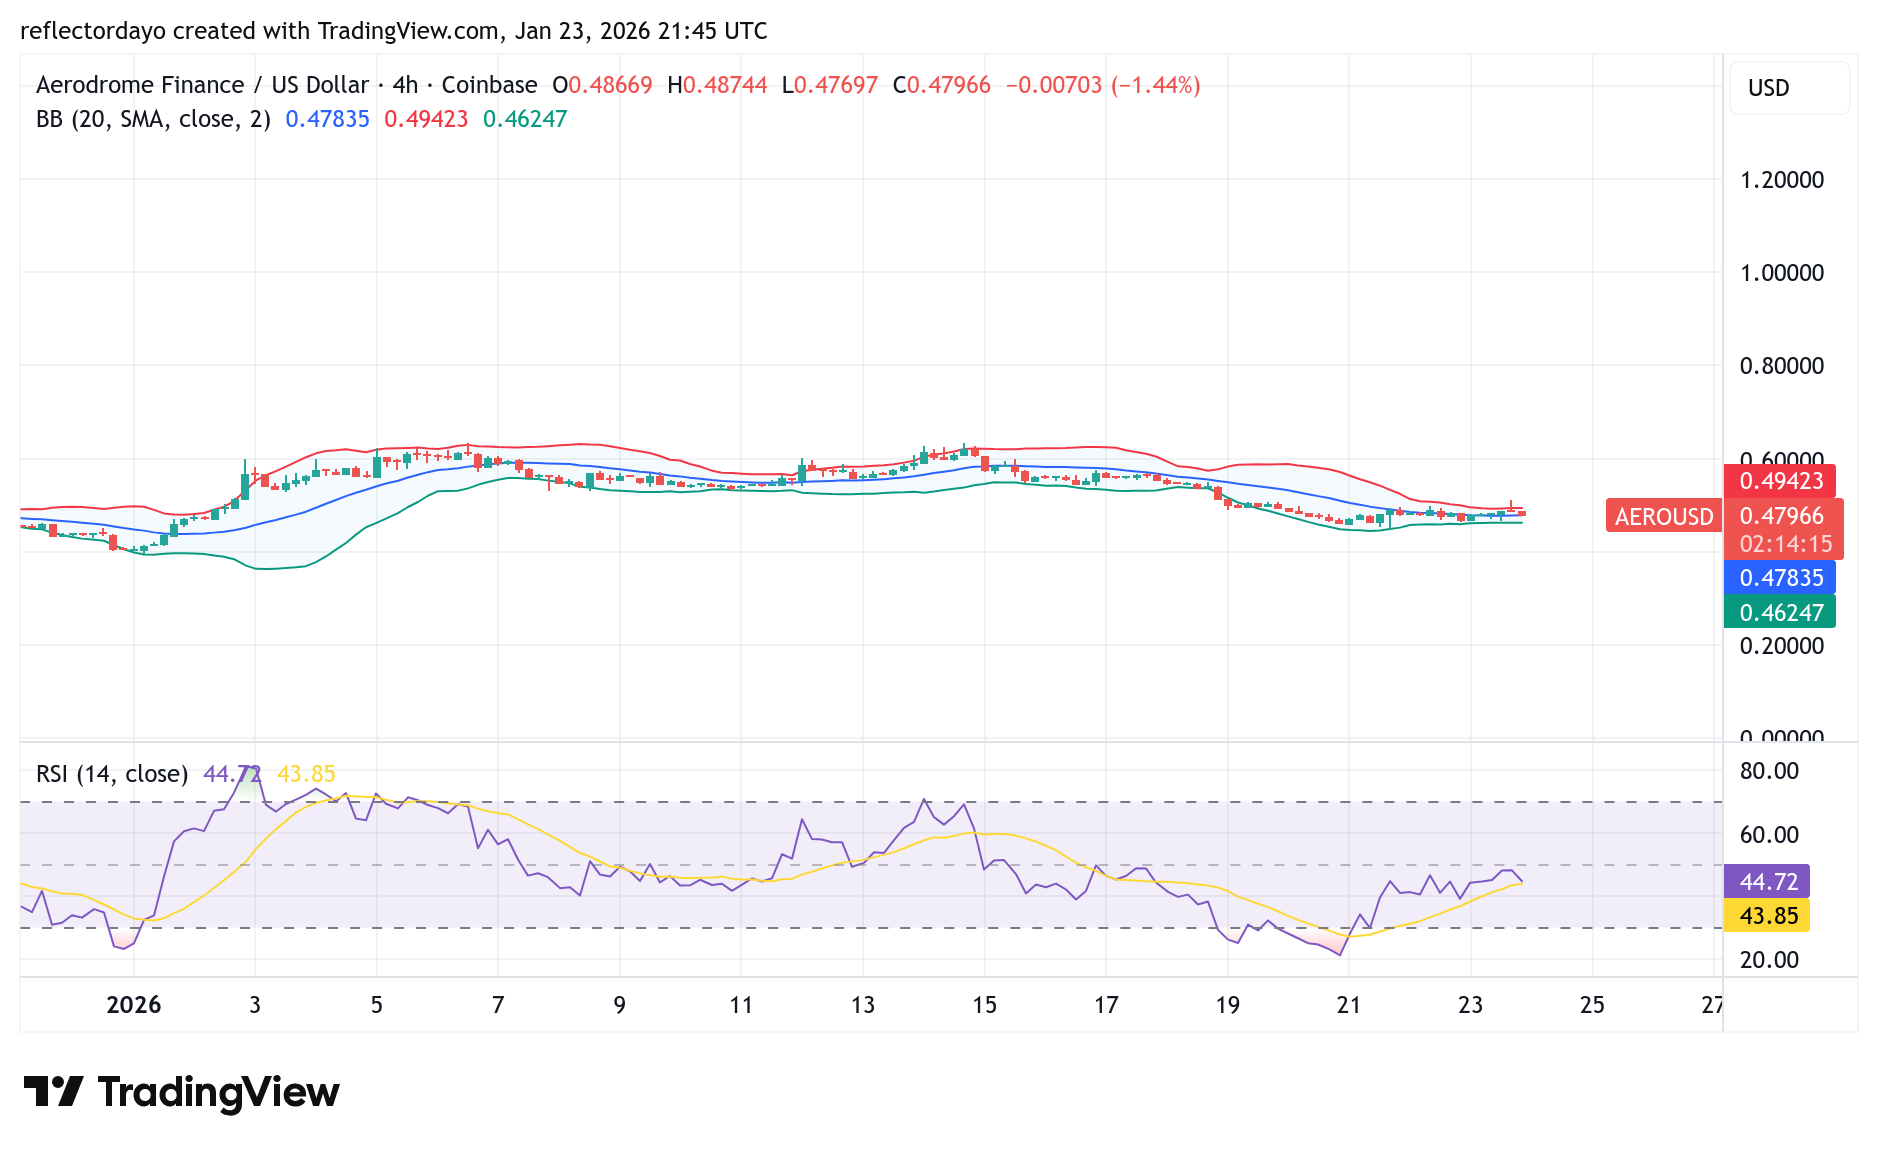
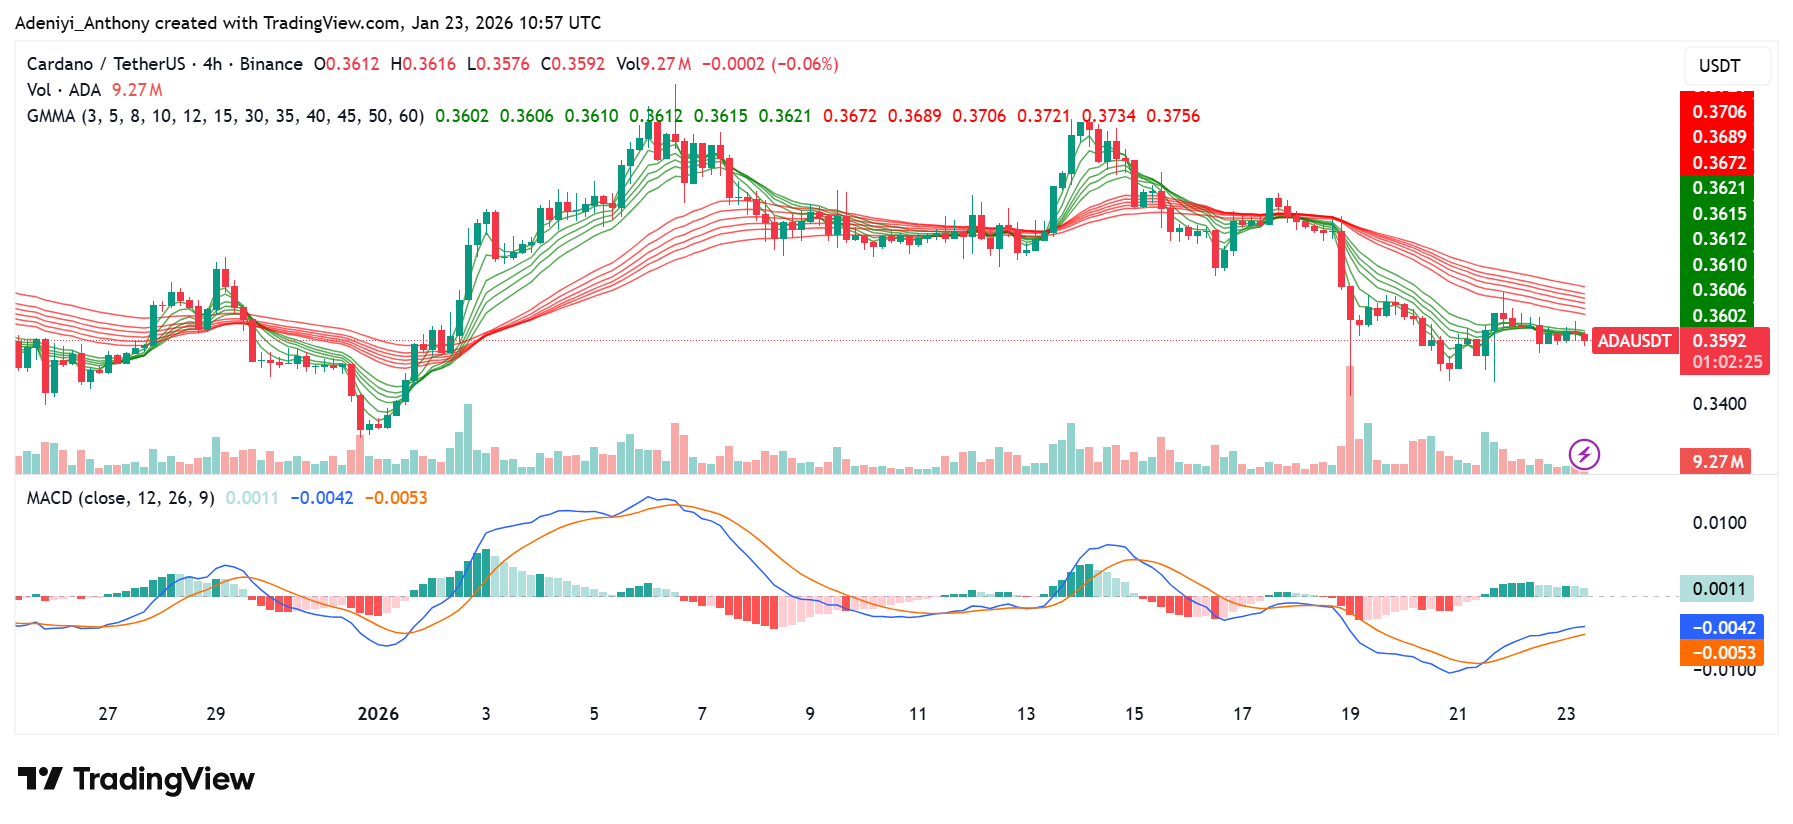
The 4hr timeframe shows the market respecting the Point of Interest (POI) at the price level $0.00000580 and reversing from there. This confirms the market is still in an uptrend. The Relative Strength Index (RSI) is far from the overbought zone, showing there is still room for the market to continue higher.

You can purchase Lucky Block here.  Buy LBLOCK

Note: Cryptosignals.org is not a financial advisor. Do your research before investing your funds in any financial asset or presented product or event. We are not responsible for your investing result.

Gold and Silver Break Records Amid Global Market Shift

Gold and silver have emerged as defining themes in the global market recently. Both metals appear to be outperforming major stocks and indices. During early trading on Friday, gold futures for March on the COMEX climbed to $4,970. They then built a base above $4,900 within the same session. Similarly, silver futures for March rose sharply toward $100 per ounce. They settled at an intraday high of $99.395.

As it stands, market data showed that prices in Asia largely matched global gold levels, while silver prices in China closed above $111 per ounce. This created a price premium of nearly $14 compared to Western markets. This highlights a stronger demand for silver in Eastern economies as both metallic substances surge to a historic high.

Gold and Silver Reach a Significant Peak as Safe-Haven Demand Intensifies

According to analysts, gold’s upward momentum has been driven mainly by central bank purchases and increased investor demand for safe assets. Analysts also observed that gold has risen more than 13% since the beginning of the year. The metal seems to be drawing strength from ongoing geopolitical risks and concerns over global economic stability.

Similarly, silver, on the other hand, nears $100 with more than a 39% increase. As it stands, the metal is attracting even greater attention due to its dual role as both a monetary and industrial metal.

Gold and Silver Break Records Amid Global Market Shift

To this end, experts were reported as saying that unless an unexpected and severe market shock occurs, the current bull cycle in precious metals is likely to remain intact. Repeated record highs this week have reinforced the perception of gold as a reliable hedge against uncertainty.

Bitcoin Lags as Traditional Assets Regain Favor

In a different light, the market for Bitcoin fails to act accordingly despite the strong performance of precious metals. The cryptocurrency has remained well below its October peak of over $126,000 and is currently trading near $89,000.

As it stands, Peter Schiff, Chief Economist and Global Strategist at Europac, has argued that Bitcoin’s recent underperformance is linked to its growing institutional adoption. He stated on social media that Bitcoin performed best when ownership was limited but began to struggle after broader participation from Wall Street and retail investors increased.

To this end, this current development shows that unless Bitcoin sees a major catalyst to propel it upward, the price may remain under the shadow of its previous high.


In order to place winning trades with us via Bybit, you can open an account here.

Livepeer (LPT/USD) Bull Run Challenged at $3.50

The Livepeer market started today on a bullish note, as buyers formed a higher low above the previous support at $2.75. Trading for the session opened around the $3.00 price level. However, as buying pressure continued to push the market higher, strong resistance emerged near the $3.50 level, challenging the ongoing bullish momentum.

Livepeer (LPT/USD) Market Data

  • LPT/USD Price Now: $3.49
  • LPT/USD Market Capitalization: $173.6 million
  • LPT/USD Circulating Supply: 49 million LPT
  • LPT/USD Total Supply: 49 million LPT
  • LPT/USD CoinMarketCap Ranking: #173

Livepeer’s Evolution Into Real-Time AI Video Infrastructure

Livepeer is undergoing a significant transformation as it pivots from a decentralized video streaming network into a broader real-time AI video infrastructure. According to a recent in-depth report published by Messari, this strategic shift positions Livepeer to support emerging use cases such as AI-powered video processing, real-time inference, and scalable video compute services. The analysis highlights how this evolution could expand Livepeer’s role within the AI and Web3 ecosystems, potentially increasing demand for its network and strengthening its long-term value proposition.

Key Levels to Monitor

  • Resistance: $3.80, $4.00, $4.50
  • Support: $3.00, $2.35, $2.20

Livepeer (LPT/USD) Bull Run Challenged at $3.50

Livepeer Market Analysis: Technical Viewpoint

In the early hours of today’s trading session, the Livepeer market surged sharply, with the price quickly reaching the $3.78 level. This area had previously served as a key support zone, keeping the price buoyant for nearly ten days in December.

At this level, profit-taking set in, triggering a tussle between buyers and sellers. This interaction later stabilized into a temporary equilibrium around the $3.50 price level. The market’s behavior in the next trading session will be crucial in determining whether the crypto signal rebounds toward $3.78 or continues to consolidate above $3.50.

Livepeer (LPT/USD) Bull Run Challenged at $3.50

LPTUSD 4-Hour Chart Outlook

Analyzing the market from the 4-hour chart perspective, we observe that price previously experienced a sharp upswing, with price action appearing almost vertical. It is normal for the market to pause or consolidate following such a rapid advance.

The Relative Strength Index (RSI) is currently measuring momentum around the 70 level, indicating strong bullish pressure. This suggests that the market may still have further upside potential, provided momentum remains supported.

Trade crypto coins on BYBIT

POL (Prev. MATIC) Price Prediction: POL/USDT Remains Under Pressure

Date: January 24, 2026

Headwinds in the POL (formerly MATIC) market have continued to pressure price action. As a result, previously secured gains have been steadily erased. The ongoing session remains on a downward path, suggesting that further price declines may occur.

POL/USDT Long-Term Trend — Bearish (Daily Chart)

Key Price Levels

Resistance: $0.1300, $0.1500, $0.1700

Support: $0.1200, $0.1100, $0.1000

POL (Prev. MATIC) Price Prediction: POL/USDT Remains Under Pressure

The POL (formerly MATIC) market continues to retrace toward lower price levels. The latest daily candle remains red and reflects only modest price movement while keeping the market below the 9-day Exponential Moving Average (EMA). Additionally, the Stochastic Relative Strength Index (SRSI) lines are moving sideways in the oversold region, with no bullish crossover in sight.

POL/USDT Price Prediction: POL (Prev. MATIC) Bulls Remain Defeated (Daily Chart)

Signals from the daily POL (prev. MATIC) chart continue to suggest that bullish momentum is exhausted. The market has been trending lower since failing to hold the $0.1980 price region.

The most recent price candle remains red and below the 9-day EMA. Likewise, the SRSI lines are drifting sideways deep within the oversold zone, reinforcing the view that bearish forces remain in control and further downside movement is likely.

POL/USDT Price Prediction: POL (Prev. MATIC) Maintains a Southward Course (4-Hour Chart)

On shorter timeframes, bearish pressure remains consistent, though price movement is relatively mild. The last three candles on the 4-hour chart are small and red, keeping price action below the 9-day EMA.

POL (Prev. MATIC) Price Prediction: POL/USDT Remains Under Pressure

Meanwhile, the Stochastic RSI lines continue to sink deeper into the oversold region. This technical setup suggests that bullish forces remain subdued, and bears may extend their advance toward the $0.1200 level.

Get POL (prev. MATIC) here. Buy POL 

Aerodrome Finance (AERO/USD) Demonstrates Resilience at $0.45

Amid the raging bear market, which has also affected the Aerodrome Finance, price has pulled back from the recent high around the $0.60 level. Buying and selling pressures have since converged near the $0.45 price area, resulting in an extended phase of horizontal price action.

This consolidation reflects notable resilience on the part of the bulls, as the market continues to hold above this key level despite broader bearish conditions.

Aerodrome Finance (AERO/USD) Market Data

  • AERO/USD Price Now: $0.48
  • AERO/USD Market Capitalization: $437 million
  • AERO/USD Circulating Supply: 918 million AERO
  • AERO/USD Total Supply: 1.8 billion AERO
  • AERO/USD CoinMarketCap Ranking: #97


Diamond Continuation Pattern: Final Signal Before Trend Resumption

The diamond continuation pattern is a relatively rare but powerful technical formation that typically develops during an ongoing trend and signals a potential continuation of that trend. In a bearish context, the pattern begins with an expansion in price volatility—marked by higher highs and lower lows—followed by a contraction phase where price action forms lower highs and higher lows, creating a diamond-like structure. Within this contraction phase, the market often prints a final higher low, reflecting a last attempt by buyers to regain control. However, this higher low is usually followed by a final test of downtrend resistance. If sellers successfully defend this resistance, bearish momentum reasserts itself, leading to a downside breakout and confirming the continuation of the prevailing downtrend.

Key Levels to Monitor

  • Resistance: $0.50, $0.55, $0.60
  • Support: $0.40, $0.35, $0.30

Aerodrome Finance (AERO/USD) Demonstrates Resilience at $0.45

Aerodrome Finance Analysis: Technical Viewpoint

It may be a positive sign that Aerodrome Finance spent the concluding week consolidating around the $0.45 price level. This tug-of-war has persisted for some time in this area, even amid the bearish crypto storm that swept through the broader market this week. Despite the overall weakness, the market has managed to hold its ground around this level.

This price behavior may suggest a potential exhaustion of bearish momentum, which could open the door for a rebound and a possible breakout toward the $0.60 level.

Aerodrome Finance (AERO/USD) Demonstrates Resilience at $0.45

AERO/USD 4-Hour Chart Outlook

From the perspective of the 4-hour chart, the Bollinger Bands are converging around a horizontally moving price channel, signaling that the market may be preparing for a significant directional move. Given that price action has been consolidating along a key support level, the potential bias appears to favor the upside.

Trade crypto coins on BYBIT

Stablecoin Growth Accelerates Across Africa as Remittances Overtake Aid

Stablecoin growth in Africa is expanding rapidly as individuals and businesses seek faster and more affordable ways to send money across borders. Speaking at the World Economic Forum in Davos, Switzerland, economist Vera Songwe stated that remittances and protection against inflation are now the main reasons Africans are turning to stablecoins.

In addition to this statement, she explained that stablecoins are becoming a practical alternative to traditional financial systems that remain costly and slow across continents.

Stablecoin Growth Accelerates Across Africa as Remittances Overtake Aid
Vera Songwe, Right, at the World Economic Forum in Davos, Switzerland.
Source: WEF

Remittances and Inflation Drive Stablecoin Growth

Songwe told participants at the Davos panel that money sent home by Africans living abroad has become more significant than foreign aid for many economies. To this, she said traditional remittance services in Africa often charge fees of around $6 for every one hundred dollars transferred, while also taking several days to complete transactions.

Meanwhile, the analyst has said that stablecoins are reducing both costs and waiting times. Additionally, she raised a point that small and medium-sized enterprises are the main users of these digital assets. This shows that stablecoins are supporting everyday business activity rather than speculative trading.

As it stands, Songwe has highlighted Egypt, Nigeria, Ethiopia, and South Africa as the highest users of Stablecoins.

To this end, she was able to justify her statement that these nations face challenges such as high inflation or strict capital controls, making stablecoins the only means of preserving value and accessing global markets.

African Governments Respond as Crypto Use Expands

According to a recent Chainalysis report on Sub-Saharan Africa, it was revealed that over two hundred and five billion dollars in on-chain transactions were made between July 2024 and June 2025. This represents a year-on-year increase of about fifty-two percent.

Stablecoin Growth Accelerates Across Africa as Remittances Overtake Aid
Source: Chainlaysis

As it stands, stablecoin use in Africa has seen a significant increase. Meanwhile, African governments are beginning to introduce different regulatory approaches.

In December, Ghana passed legislation to formally legalize cryptocurrency trading. To this development, officials stated that the new framework allows innovation while giving regulators oversight tools to manage risks. In addition to that, Nigerian authorities recently introduced rules requiring crypto platforms to link transactions to users’ tax identification numbers to enhance openness.

However, to crown it all, South Africa’s central bank has warned that rising crypto and stablecoin adoption may be considered good, but may be a problem for the traditional financial sector.


In order to place winning trades with us via Bybit, you can open an account here.

Solana Mobile SKR Is Live: How Seeker Users Can Claim Tokens

Solana Mobile SKR has officially launched, giving Seeker smartphone users a chance to claim and stake tokens. Eligible participants now have 90 days to claim before unclaimed allocations return to the airdrop pool after April.

Users can claim SKR through the Seed Vault Wallet’s Activity Tracking tab, with a small SOL balance required. This launch demonstrates how Solana Mobile SKR rewards active users and developers while strengthening the Seeker ecosystem.

What the SKR Launch Means

The launch of Solana Mobile SKR reinforces the idea that users who support the network should also own it. By distributing tokens to active users and developers, the platform encourages engagement and long-term ecosystem growth.

Solana Mobile has officially launched SKR, the native token of the Seeker smartphone ecosystem, allowing users to claim their stake in the platform’s future.

This tweet provides authoritative confirmation of the launch and aligns with the article’s focus.

How to Claim SKR Tokens

• 90-day claim window for all eligible users
• Unclaimed tokens return to the airdrop pool after the deadline
• Developers with qualifying apps from Seeker Season 1 can claim via the Publishing Portal
• SKR is issued as an SPL token on Solana, integrated with Seeker smartphones

Only verified, active users receive tokens, ensuring fair distribution.

Governance and Staking Benefits

Holders of Solana Mobile SKR can:
• Delegate tokens for governance
• Earn staking rewards
• Participate in decisions shaping the Seeker ecosystem

The SKR token uses a linear inflation model: 10% first year, decreasing 25% annually, stabilizing at 2% for the long term. This supports Seeker Season 2 with expanded apps and rewards.

Make money without lifting your fingers: Start using a world-class auto trading solution.

EightCapyour trusted Partner in CFDs, Cryptocurrencies and Stocks.

Quantum Computing Blockchain Security: Coinbase Recruits Global Experts to Protect Digital Assets

Rising concerns about how emerging technologies may alter the security of digital assets have sparked new industry debate among major cryptocurrency giants. At the moment, Coinbase Global Inc., a major American crypto provider, announced on January 21 that it has established an independent panel focused on quantum computing blockchain security. The initiative, disclosed in a company blog post, reflects rising concern that advances in quantum technology could eventually challenge the cryptographic systems that currently protect digital assets.

Top Scientists Tackle Quantum Computing Blockchain Security

The Head of Cryptography at Coinbase, Yehuda Lindell, reported that advanced future computers have the power to change industries like healthcare and national safety. He explained that for the crypto world, the risks are very high because the current function used to lock digital wallets might be broken by these new machines.

Quantum Computing Blockchain Security: Coinbase Recruits Global Experts to Protect Digital Assets

To address this, Coinbase has gathered a team of elite scientists from schools like Stanford and the University of Texas. According to the firm, this group will act as an independent body to study risks and share defensive research regarding quantum computing blockchain security with the entire tech community.

Future-Proofing Assets Through Quantum Computing Blockchain Security

Coinbase detailed that modern networks like Bitcoin currently use “elliptic-curve” math, which is safe today but could fail against future technology. Preparing for that era requires experts to work together long before these computers are actually built.

The company’s plan for Quantum Computing Blockchain Security includes updating how Bitcoin addresses are made and creating new “post-quantum” signatures that are much harder to hack. Lindell stated that by hiring the best minds, Coinbase is making sure the industry stays ahead of the problem. To this end, the team expects to publish its first major report on Quantum Computing Blockchain Security early next year.


In order to place winning trades with us via Bybit, you can open an account here.

Cardano Market (ADA/USDT) Faces $0.3400 Amid Macro Pressures and Technical Exhaustion

The Cardano market over the last 24 hours appears to have extended its weekly decline to 8.71%, remaining within the $0.300 zone, as the broader crypto market experienced a more than 1.04% drop in total crypto market capitalization. From a technical perspective, the Cardano market appears to be under significant pressure, with attempts to build a base above the $0.3400 demand zone. As it stands, the momentum indicators are flashing bearish, and there is a lack of immediate bullish catalysts to counter macro concerns.

To this end, if Cardano Price fails to maintain a space above the level, a sell pressure toward deeper support may be triggered.

Currently, Cardano trades at $0.3592 with over 26.3 million traded volumes on the daily timeframe.

Cardano Market (ADA/USDT) Faces $0.3400 Amid Macro Pressures and Technical Exhaustion
ADAUSDT -Daily Chart

Technical Indicators

Major Resistance Levels: $0.3772, $0.4032, and $0.4159

Major Support Levels: $0.3400, $0.3300, and $0.3200

Technical Analysis

On the daily timeframe, Cardano shows a clear bearish structure. The Guppy Multiple Moving Average (GMMA) reveals long-term EMAs fanning out above the price. This signals that trend-following sellers confront each relief rally. The MACD (12, 26, 9) sits below the zero line, and the histogram has some diminishing red bars. This hints at weakening bearish pressure. Still, the signal lines stay bearishly entwined. This shows there is a lack of upward conviction.

As it stands, the price action is currently consolidating near the bottom of its recent range. For a reversal to be confirmed, the price would need to print a daily close above the long-term GMMA resistance. Until such a breakout occurs, the technical outlook remains weighted to the downside, with the risk of further consolidation or a retest of the $0.33 support.

Cardano Market Eyes a Potential Trend Pivot After Violent Whiplash Session

The Cardano market in recent times has experienced sharp intraday volatility. Moreover, ADA is swinging aggressively amid heavy leverage liquidations and elevated trading volume. Meanwhile, Cardano Price initially appeared to be following the dictate of the EU–US trade tension headlines, but sentiment reversed after tariff plans were canceled. As it stands, Bitcoin reclaimed technical structure, while ADA showed early bullish signals, raising the possibility of a higher low, though key macro risks remain.

ADA/USDT Analysis: Cardano Market at a Crossroads

On the 4-hour chart, ADA/USDT appears to be showing signs of short-term exhaustion within a narrow consolidation phase. Also, the short-term EMAs are currently compressed with the price candles, confirming short-term consolidation.

From another angle, the MACD on this timeframe is showing a slight bullish divergence. Meanwhile, the price has made relatively flat lows; this potential momentum is being capped by the long-term EMAs acting as dynamic resistance just above $0.3591. To this end, the 4-hour trend remains neutral-to-bearish until a decisive break above $0.3700 is achieved with supporting volume.

Cardano Market (ADA/USDT) Faces $0.3400 Amid Macro Pressures and Technical Exhaustion
ADAUSDT – 4H Chart


You can purchase crypto coins here. Buy Crypto