Date: January 23, 2026
The Solana market has remained under pressure. Price action has been trading predominantly below the $150 threshold since it last tested that level.
Long-Term Trend: Bullish (Daily Chart)
Key Price Levels
Resistance: $145, $150, $155
Support: $140, $135, $130
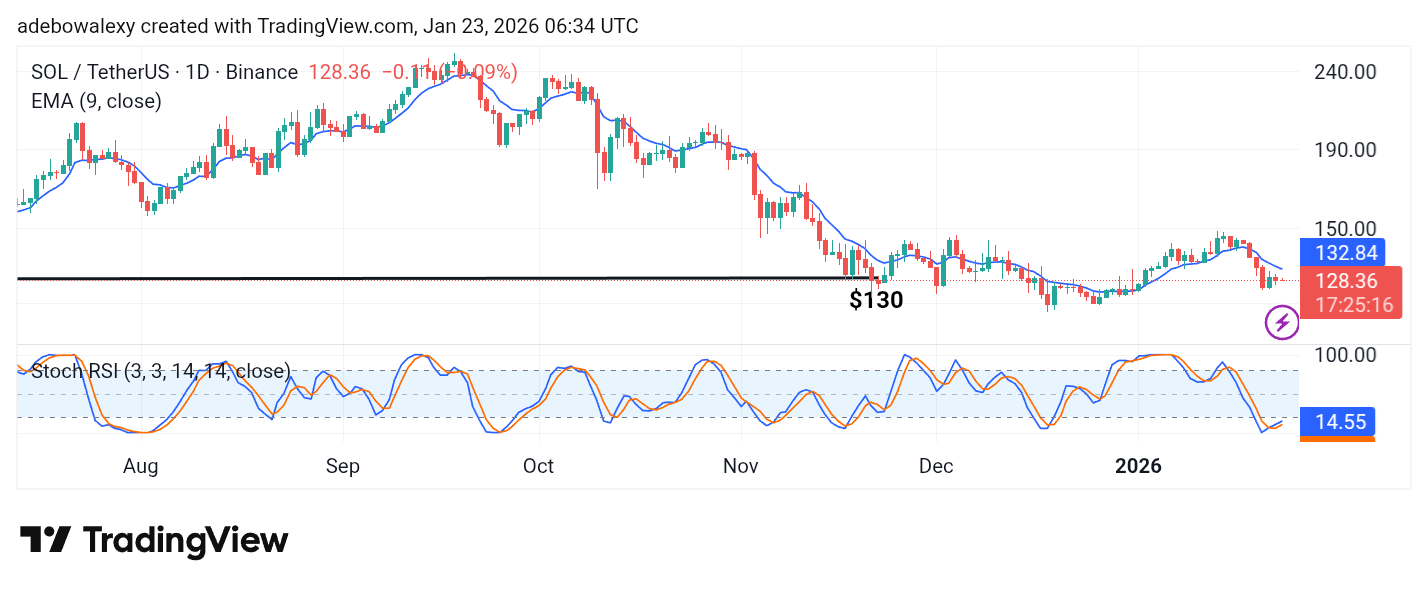
The Solana market has shown only a downward retracement. Price action has been declining with stronger momentum over recent sessions. Meanwhile, the most recent price candle is a small red candle, and price continues to trade below the 9-day Exponential Moving Average (EMA). However, the Stochastic Relative Strength Index (SRSI) lines are still edging slightly higher from the oversold region.
Solana (SOL) Price Prediction: Solana Yields to Bearish Pressure
Price action on the SOL/USDT daily chart recorded a moderate upward rebound on Wednesday. However, since then, the market has resumed its decline.
Although the ongoing session is showing only a modest price decrease, the fact that price action remains below the 9-day EMA suggests that the downward retracement could extend further.
The current movement of the SRSI appears to be reflecting the previous rebound rather than fresh bullish momentum. As such, traders may consider maintaining a bearish bias.
Solana (SOL) Price Prediction: SOL/USDT May Fall to $125 (4-Hour Chart)
On the SOL/USDT 4-hour chart, bearish forces appear positioned to keep the market moving lower. The latest price candle is red and formed after the price tested resistance at the 9-day EMA.
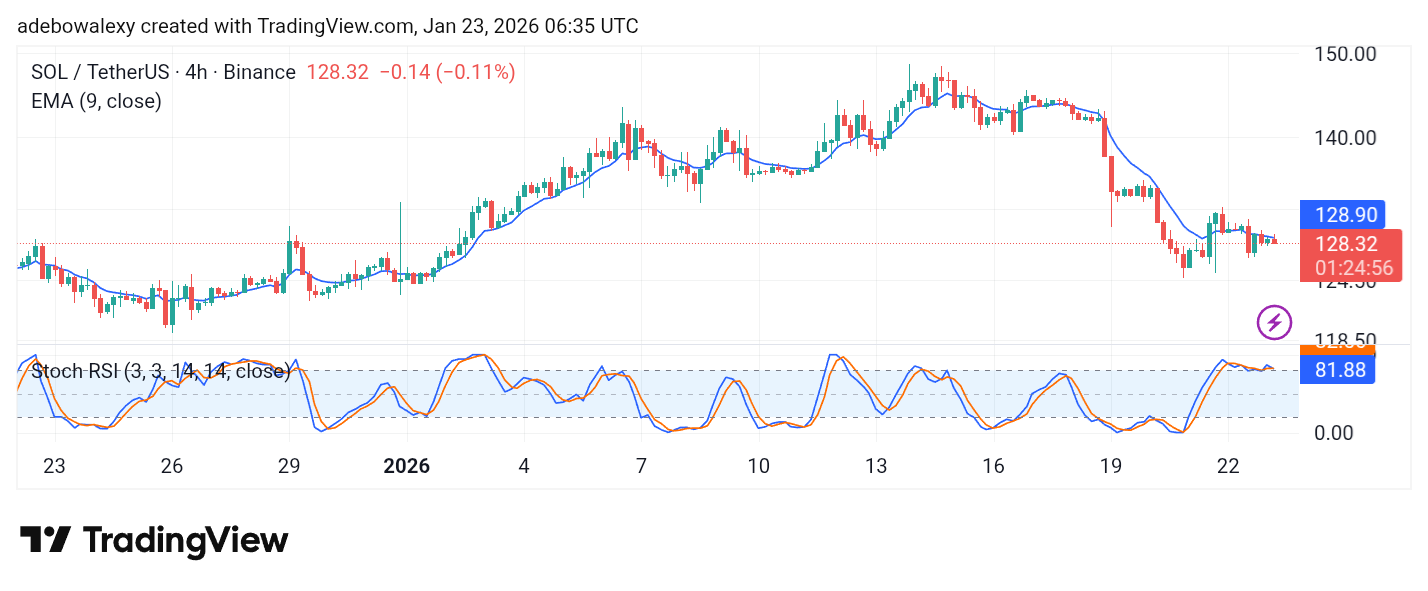
Additionally, the SRSI lines are in the overbought region and have produced a bearish crossover, with both lines now trending downward. This suggests that bearish momentum remains dominant and could drive the market toward the $125 price level.