CMC20 (DFTUSD) Index Pulls Back From Range High as Momentum Softens Near Mid-Zone

CMC20 Price Prediction — January 19

The CoinMarketCap 20 Index (CMC20) is trading around the $195.00 region after facing rejection near the upper range. Following the recent advance toward resistance, price has eased back into consolidation, with momentum cooling and volatility compressing. Current structure suggests the index is digesting gains rather than entering a fresh bearish phase, as buyers and sellers reassess control around the mid-zone.

CMC20 Market Key Levels

Resistance levels: $203.00, $227.00
Support levels: $176.00, $97.00

CMC20 (DFTUSD) Index Pulls Back From Range High as Momentum Softens Near Mid-Zone

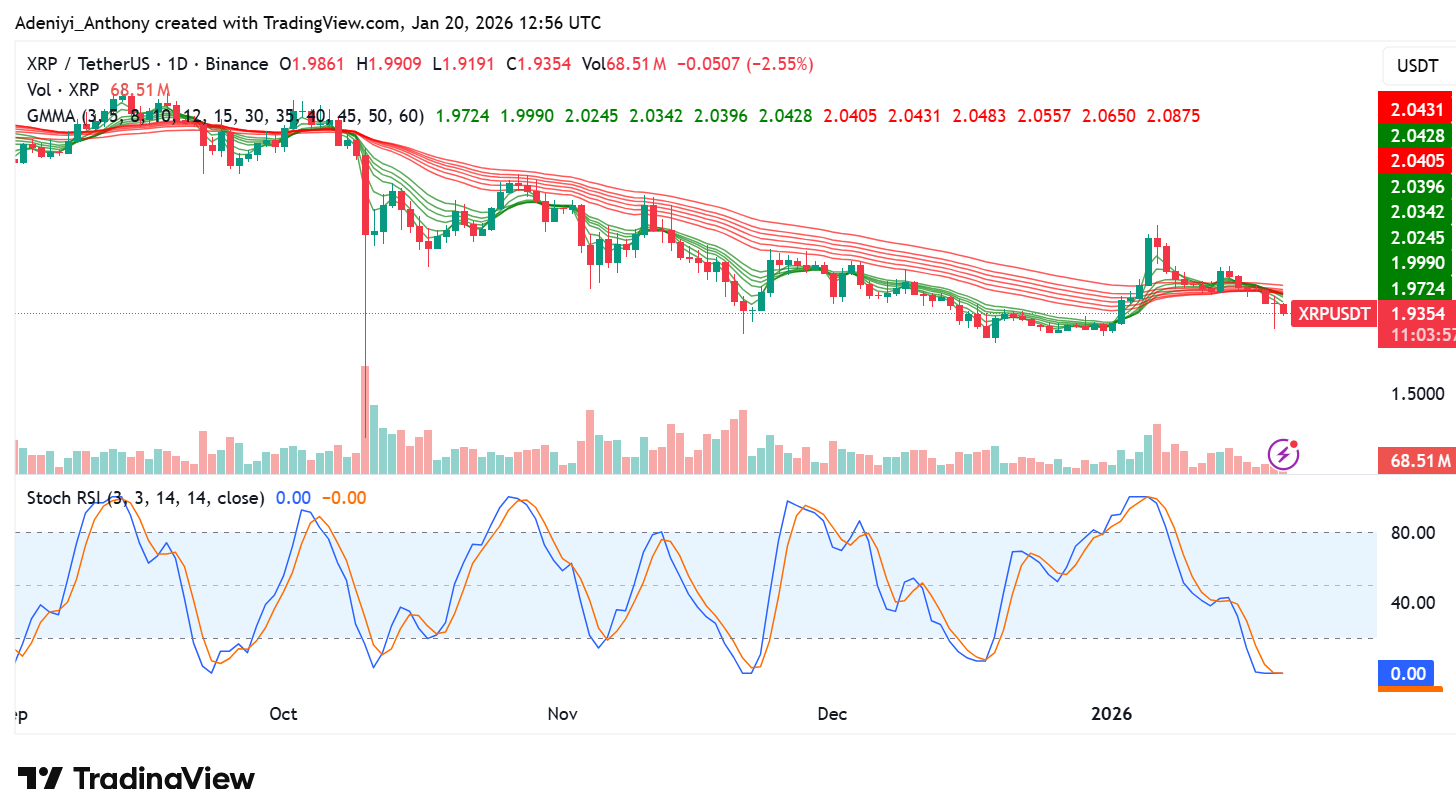
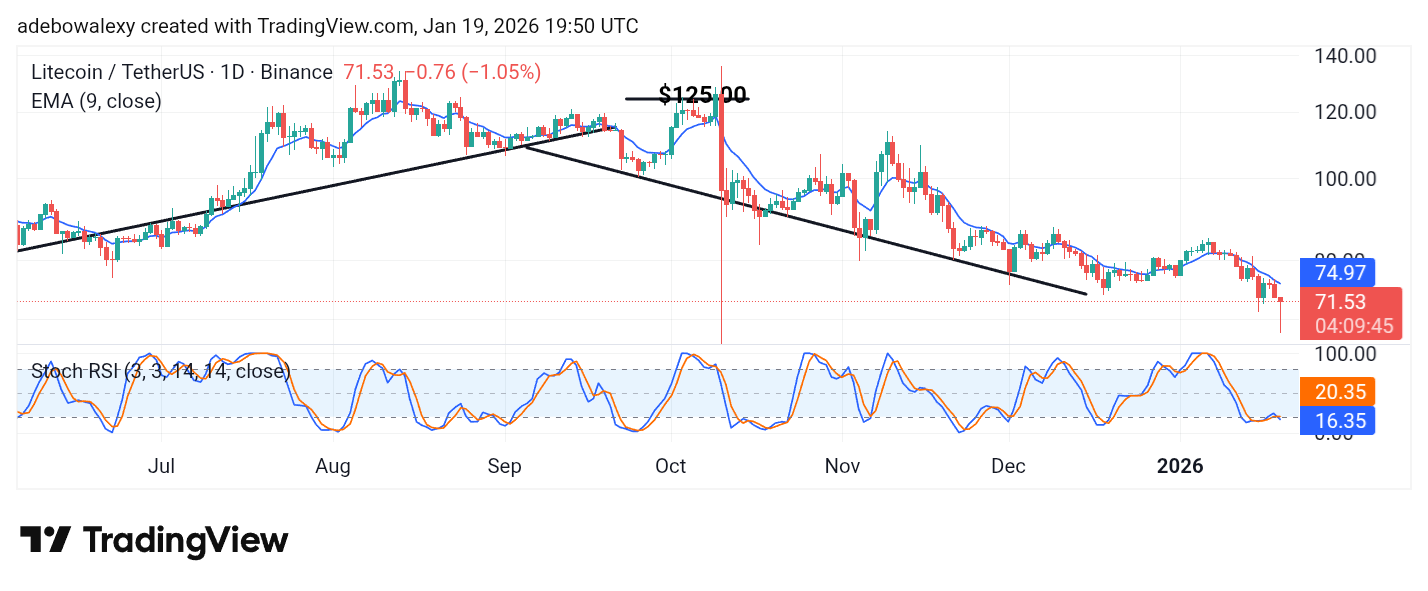
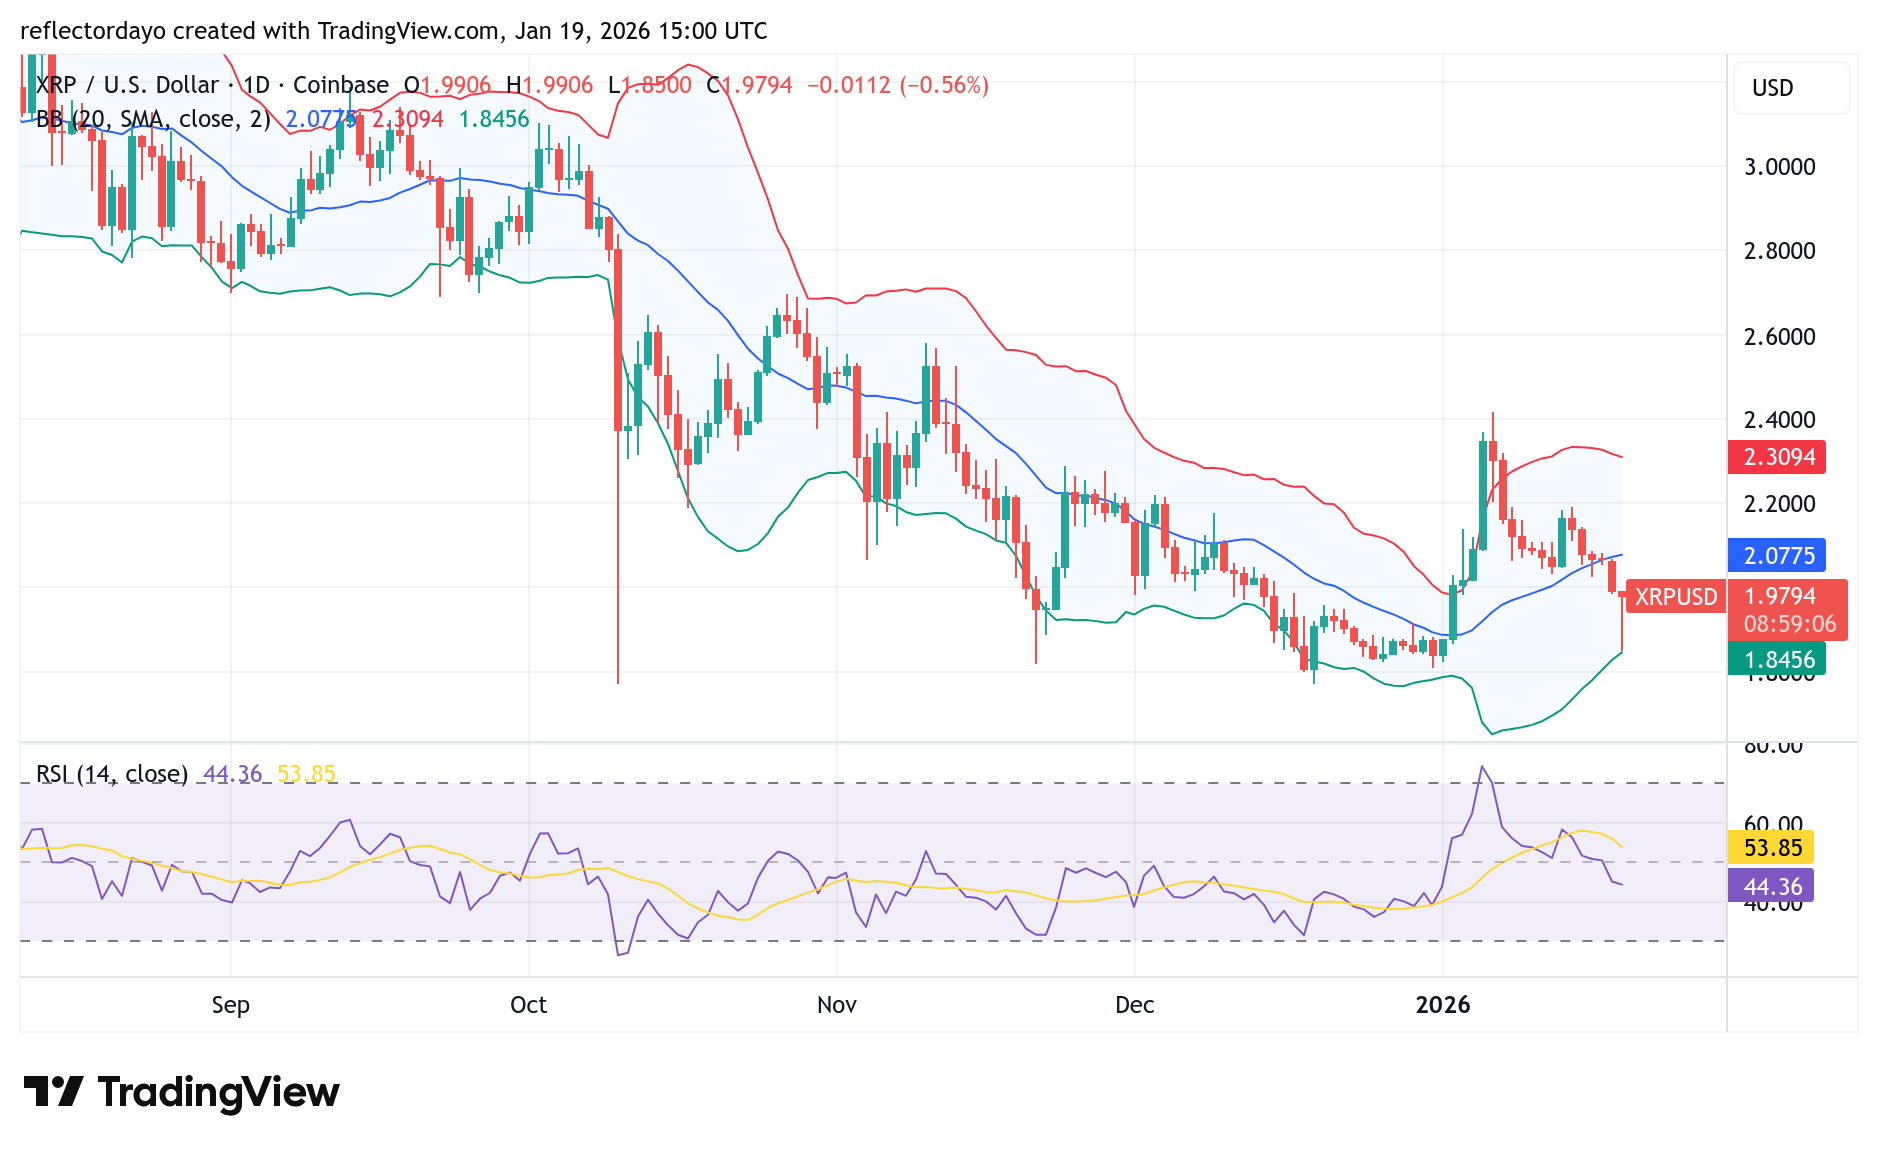
CMC20 Long-Term Trend — Neutral (Daily Chart)

On the daily chart, CMC20 remains locked in a broad recovery range rather than a trending expansion. The sharp downside event from late November was absorbed decisively, followed by a rebound that stabilized above the $176.00 support area. Since then, price action has respected a horizontal structure, reflecting balance across the broader crypto market.

What is the market outlook for CMC20?

The Chande Momentum Oscillator remains mildly positive, showing underlying demand but lacking acceleration. At the same time, MACD remains above the zero line, though histogram expansion has slowed, signaling that upside pressure is no longer increasing aggressively.

As long as CMC20 holds above $176.00, the broader recovery structure remains valid. However, sustained upside progress requires acceptance above $203.00. A daily close and hold above that level would indicate renewed strength across large-cap assets, opening the path toward $227.00 and reinforcing improving crypto signals across the market.

Failure to reclaim $203.00 keeps the index vulnerable to continued sideways rotation. A breakdown below $176.00 would invalidate the current recovery range and shift focus toward deeper downside levels.

CMC20 (DFTUSD) Index Pulls Back From Range High as Momentum Softens Near Mid-Zone

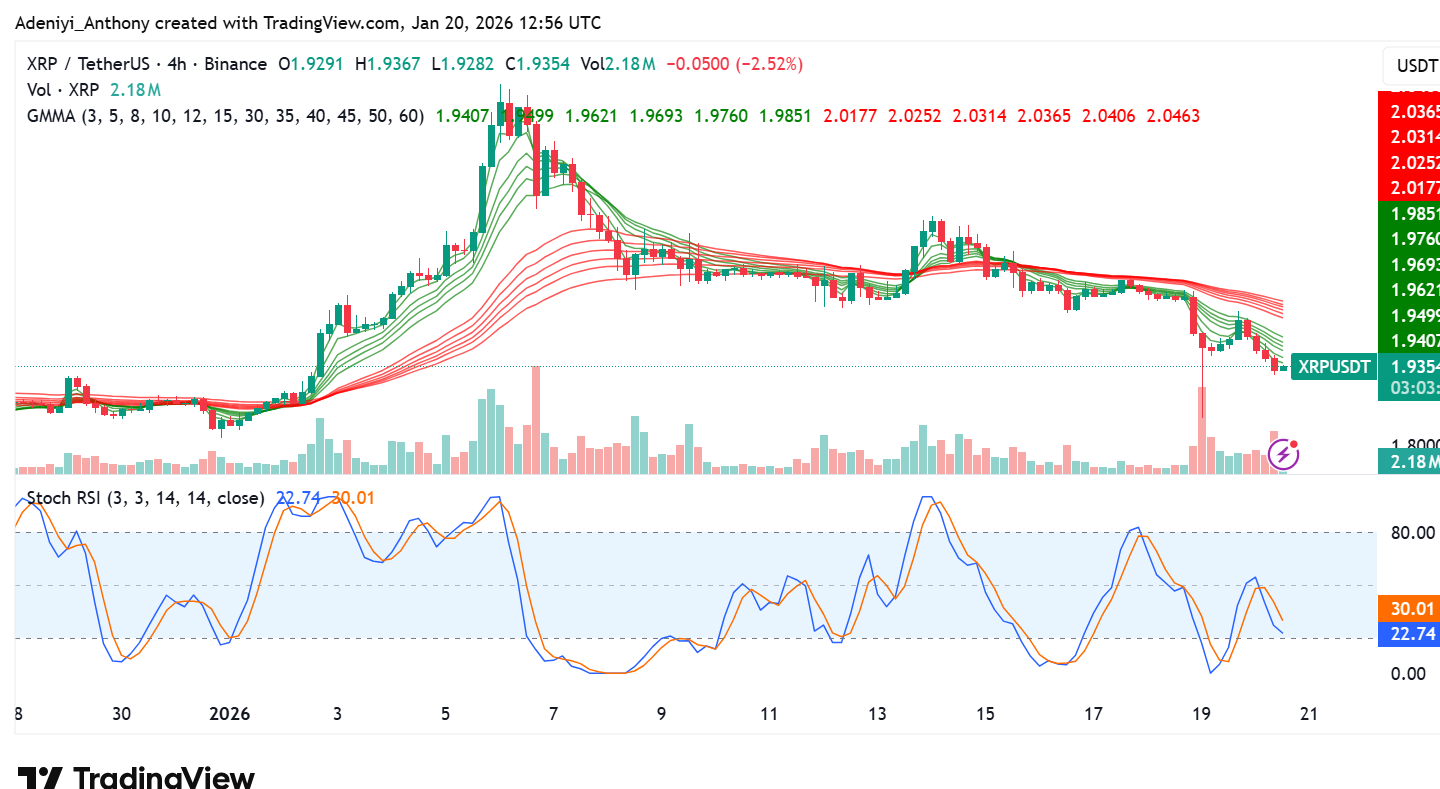
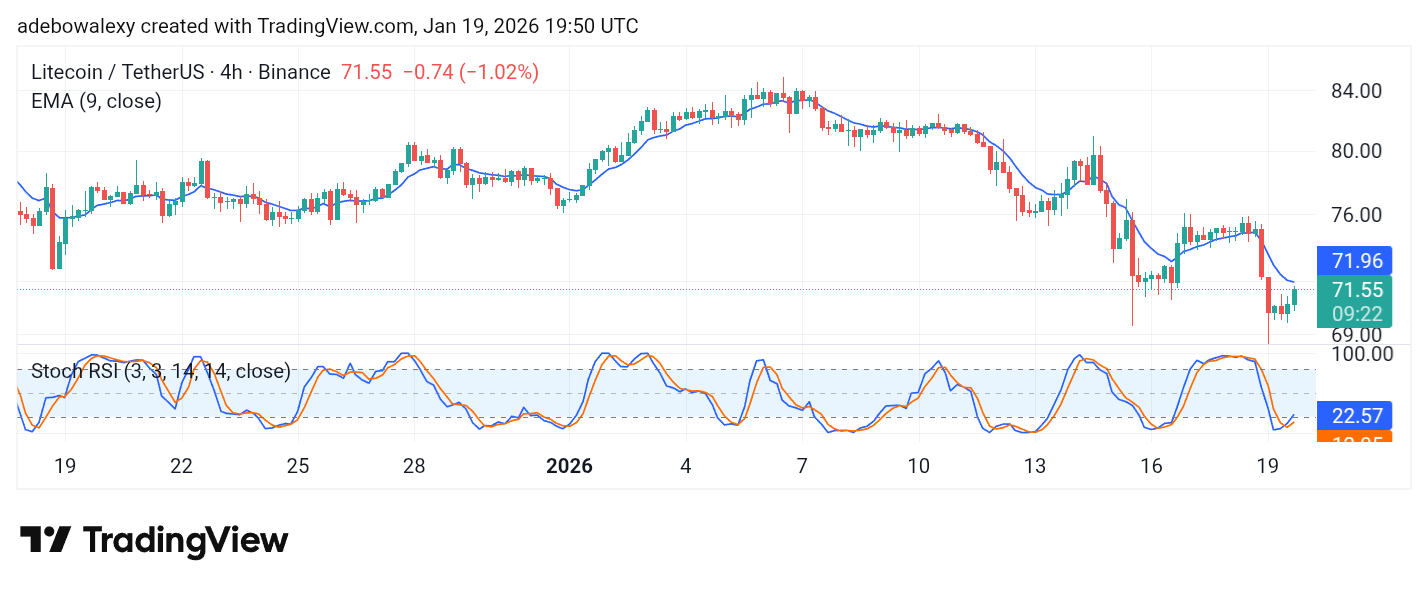
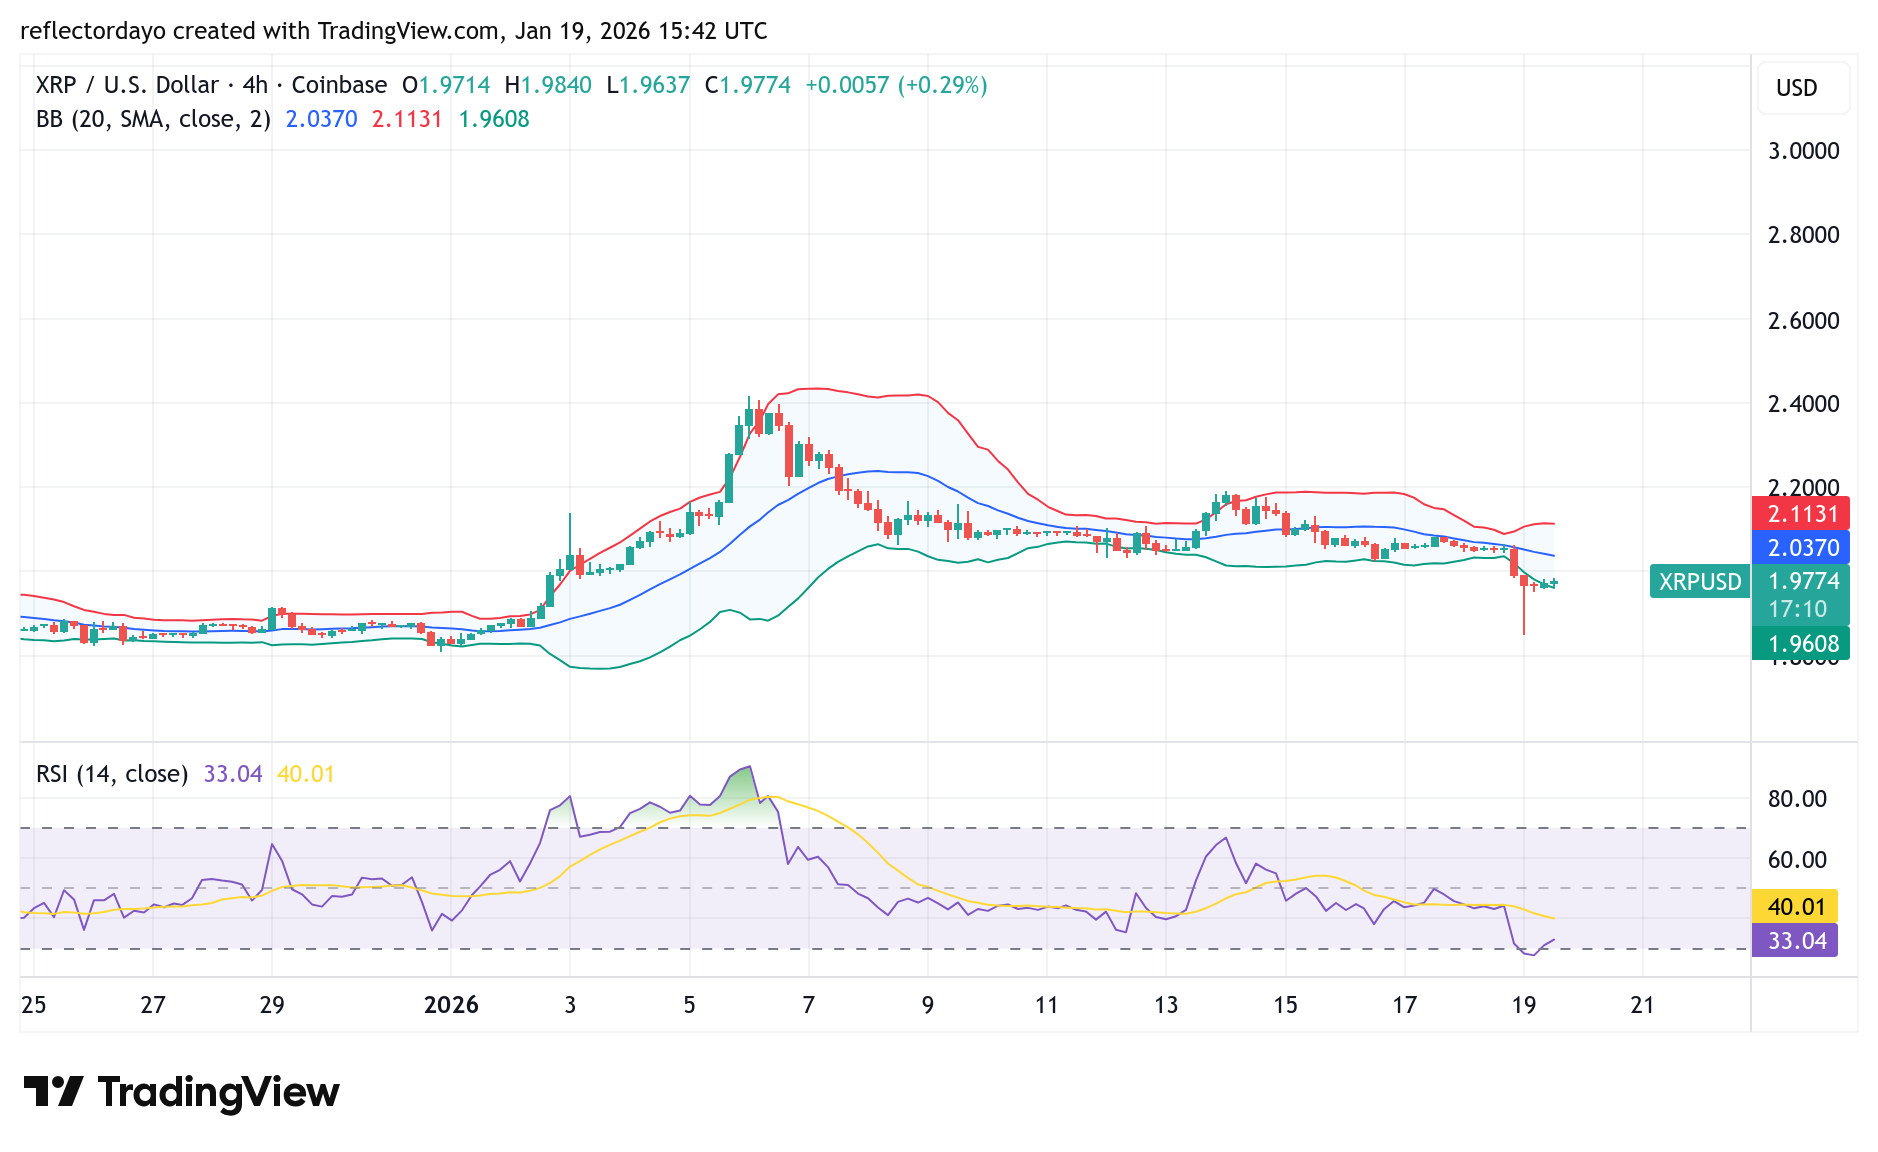
CMC20 Short-Term Trend — Neutral (4-Hour Chart)

On the 4-hour chart, CMC20 is showing clear signs of momentum loss after the recent push higher. Price has rolled over gently from the range high, with smaller candles and reduced follow-through. Chande momentum has slipped into negative territory intraday, while MACD histogram has turned lower, confirming short-term weakness rather than trend reversal.

This structure typically precedes either renewed expansion or deeper consolidation. A reclaim of $203.00 would favor bullish continuation, while sustained trading below $190.00 increases the risk of a pullback toward $176.00.

CMC20 Market Statistics

Current Price: $195.00
Market Capitalization: $510,000,000,000
24H Trading Volume: $36,000,000,000

You can purchase DTF here: BUY DTF

Bitcoin (BTC) Price Prediction: BTC/USDT Nosedives Towards the $90K Threshold

Date: January 20, 2026

The Bitcoin market has started to see a strong downward retracement recently. Price action is now testing the $90,000 mark, and it is likely that the market may fall below this baseline.

BTC/USDT Long-Term Trend — Bullish (Daily Chart)

Key Price Levels

Resistance: $92,500, $95,000, $97,500

Support: $90,000, $88,000, $86,000

Bitcoin (BTC) Price Prediction: BTC/USDT Nosedives Towards the $90K Threshold

On the daily chart, it can be seen that headwinds have been dominant. Over the past five sessions to the current one, headwinds have prevailed as price action made a U-turn and is now testing the $90,000 threshold. The 9-day Exponential Moving Average (EMA) line now lies above the recently depreciated price candles. At the same time, the Stochastic Relative Strength Index (SRSI) indicator lines are falling sharply into the oversold region.

Bitcoin Price Prediction: BTC/USDT Falls Head First

Looking at the Bitcoin market, it can be observed that the applied technical indicators suggest one thing—that the market has a downward bias.

The 9-day EMA curve lies above price action, and the ongoing session places the current price far below the 9-day EMA curve. Simultaneously, the SRSI indicator lines are dropping sharply into the oversold region. As such, this market appears set for a downward path.

Bitcoin Price Prediction: BTC/USDT Keeps a Bearish Pose (4-Hour Chart)

Even on shorter time frames, the Bitcoin market keeps diving southward. The latest price candle can be seen testing support at the $90,000 level.

Consequently, this implies that price action remains below the 9-day EMA curve. Similarly, the SRSI indicator lines are still in the oversold region and appear to be preparing to linger there. This suggests that price action may proceed toward the $87,500 price level.

Get Bitcoin (BTC) here. Buy BTC 

TRON (TRXUSD) Consolidates Below Range High as Momentum Cools Near Resistance

TRXUSD Price Prediction — January 19

TRON (TRXUSD) is trading around the $0.320 region after failing to sustain upside momentum above the upper range. Following the recent bullish push, price has transitioned into a tight consolidation just below resistance, with volatility compressing and short-term conviction fading. Current behavior suggests the market is pausing rather than reversing, as buyers reassess strength near a key decision zone.


TRXUSD Market Key Levels

Resistance levels: $0.320, $0.340
Support levels: $0.300, $0.270

TRON (TRXUSD) Consolidates Below Range High as Momentum Cools Near Resistance

TRXUSD Long-Term Trend — Bullish (Daily Chart)

On the daily chart, TRXUSD remains in a broader bullish structure despite the recent slowdown. Price continues to print higher lows from the $0.270 base, confirming that the larger recovery trend is still intact. The market is now pressing into the upper boundary of the range, where profit-taking and hesitation are naturally increasing.


What is the market outlook for TRXUSD?

Momentum has improved meaningfully from prior bearish conditions, but it is no longer accelerating. This shift reflects a market that has already moved and now requires consolidation before any continuation. As long as TRXUSD holds above the $0.300 support zone, the bullish structure remains valid.

The market is currently boxed between $0.300 support and $0.320 resistance, creating a clear equilibrium range. Holding above $0.300 keeps the bullish thesis intact, but acceptance above $0.32 is required to unlock further upside.

A clean daily breakout and hold above $0.320 would signal renewed trend strength, opening the path toward $0.340. Such a move would confirm that consolidation is resolving higher, aligning with improving crypto signals across select large-cap altcoins.

TRON (TRXUSD) Consolidates Below Range High as Momentum Cools Near Resistance

TRXUSD Short-Term Trend — Neutral (4-Hour Chart)

On the 4-hour chart, TRXUSD is trading in a tight, compressed range with shallow swings and limited follow-through. Price is rotating around the mid-zone, reflecting indecision rather than directional control.

This type of structure often precedes expansion. A decisive push above $0.320 would favor continuation toward higher resistance, while a breakdown below $0.300 would likely trigger a deeper pullback. Until either level is breached with conviction, short-term conditions favor patience over aggression.


TRXUSD Market Statistics

Current Price: $0.320
Market Capitalization: $29,000,000,000
24H Trading Volume: $900,000,000

You can purchase TRON here. Buy TRX

Sandbox (SAND/USD) Bullish Recovery Faces Resistance at $0.150

After an extended period of bearish price action, Sandbox found strong support around the $0.108 level following a sustained downward trend. The emergence of bullish interest at this zone caused price action to stabilize and consolidate around this level.

More recently, a bullish recovery has begun to unfold in the market, signaling renewed buying momentum and suggesting that bulls are becoming more active. However, this recovery is now being challenged, as bearish pressure is starting to build around the $0.150 resistance level.

Sandbox (SAND/USD) Market Data

  • SAND/USD Price Now: $0.142
  • SAND/USD Market Capitalization: $371 million
  • SAND/USD Circulating Supply: 2.6 billion SAND
  • SAND/USD Total Supply: 3 billion SAND
  • SAND/USD CoinMarketCap Ranking: #110

Geopolitical Tension Is Hurting the Crypto Market

Using Bitcoin as a representative example of broader crypto market conditions, we have recently witnessed a sharp and significant price decline. Bitcoin dropped from around $93,000 to the $90,000 level, reflecting heightened uncertainty driven by geopolitical tensions.

If downside volatility persists, Bitcoin may struggle to reclaim the $93,000 level. In that case, the next potential area where price could find support and attempt a rebound is around the $88,300 level.

Key Levels to Monitor

  • Resistance: $0.150, $0.16, $0.17
  • Support: $0.110, $0.100, $0.09

Sandbox (SAND/USD) Bullish Recovery Faces Resistance at $0.150

Sandbox Market Analysis: Technical Viewpoint

Between late last year and the beginning of this year, the market has been consolidating around the $0.10 price level. This prolonged consolidation suggests the emergence of a potential bullish recovery following the extended bear market that began around the $0.35 level in July.

Typically, after a long bearish phase, traders tend to accumulate around a key price zone, and this appears to be exactly what has occurred here. A bullish recovery has indeed begun to play out; however, the Sandbox market is now at a crossroads near the $0.150 level.

Although $0.150 has emerged as a key resistance and has consistently capped bullish advances for some time, bulls have recently found support around $0.134, a level in close proximity to this resistance. This development in the crypto signal indicates that buyers may still be willing to press for further upside. Nonetheless, bearish pressure remains firm at the $0.150 resistance zone.

Sandbox (SAND/USD) Bullish Recovery Faces Resistance at $0.150

SAND/USD 4-Hour Chart Outlook

The earlier aggressive buying activity caused market volatility to spike. However, more recently, the Bollinger Bands have begun to converge, indicating a slowdown in volatility as both buyers and sellers firmly establish their positions around the $0.134 and $0.150 levels.

This convergence of the indicator suggests that the market may enter a period of consolidation before a potential continuation of the bullish recovery.


Trade crypto coins on BYBIT

XRP Price Risk Elevated Below $2.00 as Market Volatility Spikes

XRP price against Tether has dropped significantly, going down by 2.13% in the last 24 hours. It appears that major investors are selling off large positions, causing $14 million in losses. The token’s price has struggled to stay above key technical levels, signaling a loss in momentum below $2.04. Additionally, broader market fears and a falling stock market further discouraged buyers. As it stands, a new plan by the NYSE to trade digital versions of stocks made some investors reconsider trading tokens like XRP.

Currently, XRP trades at $1.9354, recording more than 68 million traded volumes on the 24-hour chart.

XRP Price Risk Elevated Below $2.00 as Market Volatility Spikes
XRPUSDT-Daily Chart

Technical Indicators

Major Resistance Levels: $2.04, $2.32, and $2.40

Major Support Levels: $1.87, $1.77, and $1.61

Can XRP Sustain the Move?

In a recent post, @ChartNerdTA asserts that the XRP price has flipped from bearish to bullish following a major breakout, despite the price currently retracing to backtest falling wedge resistance. While a rejection occurred at the $2.40 golden ratio resistance level, the analyst opined that the primary objective for the bulls now is to successfully defend the $1.80 support level.

Technical Analysis

Technically, the XRP price appears to be in a cool-down phase after a big rally. Observably, out of the last 14 days, 13 have seen the price go down. However, the Stochastics RSI shows that while there is a lot of selling pressure, the momentum seems to be stabilizing. This suggests some buying activities around the $1.90 zone.

To this end, for the XRP price to reclaim its lost position, it needs to break above $2.09 with strong buying volume. Conversely, if momentum continues, a break below $1.80 might send the price back to the $1.61 level as the Guppy Multiple Moving Averages (GMMA) signals an impending bearish crossover.

XRP Price Update

The XRP against Tether is currently facing resistance at $2.20 after bouncing from December lows. Despite the rebound, price action remains “noisy” and range-bound. The analysis shows that reliable bottoming signals are absent until a breakout above the $2.69–$2.84 range occurs. This is leaving the immediate outlook speculative and lacking a high-probability setup.

As it stands, downward pressure persists, with potential support levels near $1.77 and $1.68. Meanwhile, a break above $2.19 might shift local focus higher; the structure remains corrective. To this end, monitoring for a clear five-wave move to confirm a definitive trend direction amidst this complex, volatile consolidation is necessary.

XRP/USDT Analysis: Short-term Price Trapped Above $1.84

The 4-hour chart shows XRP/USDT is squeezed between $1.92 and $1.98. As it stands, the price is currently trapped in a downward pattern as the GMMA displays obvious dominance from the bears. Meanwhile, the pattern of the momentum oscillator suggests upside potential as the line extends into the oversold region.

To this end, if the price can close a 4-hour candle above $1.98, it might jump back to $2.04; a move below $1.87 would further elevate the risk.

XRP Price Risk Elevated Below $2.00 as Market Volatility Spikes
XRPUSDT- 4H Chart


You can purchase crypto coins here. Buy Crypto

Berachain Market Analysis: Bullish Consolidation at Multi-Month Highs

Berachain in recent times has surged 10.69% daily and nearly 80% weekly. This shows a significant performance compared to the broader crypto market, as it appears the Berachain market rally is driven by strong technical momentum and the “Bera Builds Businesses” shift toward sustainable revenue models.

In addition to this development, it has been noted that increasing corporate treasury interest and the launch of new ecosystems, such as Rhea Finance, are fueling demand. Meanwhile, despite high RSI levels, investor confidence remains high.

Currently, Berachain trades at $0.996 with more than 10.2 million traded volumes on the daily timeframe.

Berachain Market Analysis: Bullish Consolidation at Multi-Month Highs
BERAUSDT – Daily Chart

Technical Indicators

Major Resistance Levels: $1.020, $1.500, and $1.710

Major Support Levels: $0.876, $0.786, and $0.700

Will the Berachain Market Price Establish a Base Above $1.00?

As it stands, @krasnovcrypto has observed that Berachain has established multiple liquidity levels, both at a higher timeframe and locally. This is pointing to “pockets” of interest that the price is likely to gravitate toward. The analyst suggests that while the price is poised to “hunt” this liquidity, a high-quality trade entry is not yet available, urging traders to await a period of solid consolidation to confirm the move.

Technical Analysis

Technically, Berachain has been aligned bullishly against Tether on the daily chart. The Berachain market price appears to be trading above the cluster of the simple moving averages (SMA), signaling an uptrend. Although the Stochastic RSI suggests an overbought condition and a potential exhaustion ahead, the overall structure remains bullish as the price sits above $0.800.

To this end, if momentum holds with improved volume as seen on the chart above, a potential move above the $1.200 mark may be recorded before the February supply event.

Berachain Downtrend Resistance & Potential Breakout Alert

In a recent analysis, Berachain appears to be testing key resistance between $1.06 and $1.60. This suggests the token is making a move for a breakout towards $3.15, ending the downtrend. However, failure to consolidate above recent lows risks a “death spiral.” To this end, caution must be applied, as previous retests of these levels resulted in significant price rejections and lower lows.

BERA/USDT Analysis: Finding Balance After Sharp Rally

On the 4-hour chart, BERA/USDT seems to be cooling down as indicated by the momentum oscillator’s neutral stance. However, the price retains its position above the SMA. As it stands, the pair is heading toward $1.00. However, a move below $0.836 would invalidate this move, and a retracement towards $0.786 may unfold. To this end, though buying volume seems to have met an unexpected end, the sell-side volume for a reversal is not enough.

Berachain Market Analysis: Bullish Consolidation at Multi-Month Highs
BERAUSDT – 4H Chart


You can purchase crypto coins here. Buy Crypto


Litecoin (LTC) Price Prediction: LTC/USDT Gets Pushed Back Above $70

Date: January 19, 2026

The Litecoin market has continued to slide lower over the recent past. Even now, the ongoing session has kept descending in general. However, some price movements suggest that bulls are causing a pullback.

LTC/USDT Long-Term Trend — Bearish (Daily Chart)

Key Price Levels

Resistance: $75, $80, $85

Support: $70, $65, $60

Litecoin (LTC) Price Prediction: LTC/USDT Gets Pushed Back Above $70

The ongoing session in the Litecoin market has produced a significant downward movement via the last price candle. This has brought trading further below the 9-day Exponential Moving Average (EMA) line. Also, while the last price candle on the chart stays generally red, it has a long lower shadow, which presents another narrative. Meanwhile, the lines of the Stochastic Relative Strength Index (SRSI) indicator are keeping a downward bearing in the oversold region.

Litecoin (LTC) Price Prediction: LTC/USDT Remains Vulnerable

While the ongoing session in the Litecoin market stays bearish, considering the current setup, it can also be found that upside forces have produced some positive contraction. Despite this, the token remains trading below the 9-day EMA curve.

Also, the SRSI indicator lines can be seen keeping a downward trajectory in the oversold region. The ensuing lines of the indicator recently delivered what seems like a downward crossover. This affirms that, in the longer term, this market may stay in a bearish trend.

Litecoin (LTC) Price Prediction: LTC/USDT Pullback Looks Strong (4-Hour Chart)

On the 4-hour price chart, it can be observed that price action has been climbing its way upward. This can be seen to have amounted to the upside-down contraction on the daily chart.

Litecoin (LTC) Price Prediction: LTC/USDT Gets Pushed Back Above $70

Nevertheless, trading remains below the 9-day EMA curve. The lines of the SRSI indicator are still poised upward from deep in the oversold region of the indicator. At this point, traders might want to exercise some patience, as price action needs to cross a critical level at $72 before more bullish stances can be taken in this market.

Get Litecoin (LTC) here. Buy LTC 

XRP Market (XRP/USD): Bulls Defend the $2.00 Level

Volatility remains elevated in the XRP market, with price action fluctuating within a broad trading range between the $1.80 and $2.40 levels. In recent sessions, however, bulls have shown notable resilience by keeping prices above the critical $2.00 mark. Although sellers briefly pushed the price below this level between yesterday and today, bullish interest quickly emerged. Buyers responded decisively, driving prices back upward as they attempt to reclaim and stabilize the market above the $2.00 level.

XRP Market (XRP/USD) Market Data

  • XRP/USD Price Now: $1.979
  • XRP/USD Market Capitalization: $120 billion
  • XRP/USD Circulating Supply: 60.8 billion XRP
  • XRP/USD Total Supply: 99.9 billion XRP
  • XRP/USD CoinMarketCap Ranking: #5

XRP Pulls Back as Bulls Show Resilience Amid Global Uncertainty

XRP has experienced a pullback amid heightened geopolitical tensions that have sparked a broader risk-off mood across the market. However, this decline does not yet qualify as a confirmed bearish trend. The asset previously formed a strong rebound around the $1.80 level and maintained a bullish recovery, with resistance levels continuing to form higher highs. This suggests that bullish structure remains intact, and the recent sell-off appears to be more of a reaction to global geopolitical developments—such as tensions involving the US, Europe, NATO, and Greenland—rather than a breakdown in XRP’s underlying market strength.

Key Levels to Monitor

  • Resistance: $2.10, $2.30, $2.40
  • Support: $1.80, $1.75, $1.70

XRP Market (XRP/USD): Bulls Defend the $2.00 Level

XRP Market Analysis: Technical Viewpoint

Amid ongoing market volatility, the XRP market experienced a strong bearish move after peaking around the $2.40 level, prompting a notable price pullback. Initially, bears showed strong momentum and attempted to push the price down toward the $1.80 level. However, bulls have firmly defended the territory between $1.80 and $2.00, asserting control within this zone.

XRP Will Pump Soon

Technical Viewport (Continued)

Their buying activity has triggered a rebound, driving the price back toward the $2.00 level. If bulls sustain this defense, XRP could regain upward traction. A successful hold above $2.00 may weaken resistance around $2.20, potentially forcing sellers to retreat and opening the path for a renewed move toward the $2.40 level.

XRP Market (XRP/USD): Bulls Defend the $2.00 Level

XRP/USD 4-Hour Chart Outlook

Viewing the market from the 4-hour chart perspective, the indicators suggest that a potential rebound may be forming, as price action has flattened near the lower regions of the indicators. This behavior could signal an accumulation phase, with traders gradually building positions in anticipation of a stronger move. If a breakout occurs around the $2.00 level, resistance near $2.20 could be cleared with relative ease, opening the door for a further advance toward the $2.40 price level.

Trade crypto coins on BYBIT

Bitcoin and Ether ETFs 2026 Inflows See a Fresh Start as Demand Increases

The market report shows that the week ending January 16, 2026, saw an increase in institutional investors’ interest in cryptocurrency exchange-traded funds (ETFs). Inflows into Ether ETFs and Bitcoin ETFs showed notable changes. This indicates greater confidence in regulated cryptocurrency investment products. The week saw a total influx of $1.9 billion.

Meanwhile, it was observed that Ether ETFs alongside certain altcoin funds also had consistent growth, but Bitcoin ETFs drew the most share. To this end, the implication of these movements suggested institutions were positioning for long-term exposure despite short-term market swings.

Bitcoin and Ether ETFs 2026 Inflows See a Fresh Start as Demand Increases
Bitcoin and Ether ETFs 2026

Bitcoin ETFs Record One of the Strongest Weekly Inflows

Sources reported that U.S. spot Bitcoin ETFs drew a combined inflow of about $1.42 billion during the week, supported by trading volumes of roughly $21.77 billion. BlackRock’s IBIT was said to have led the market, contributing over $1.03 billion alone.

Analysts noted that strong buying on January 14 and 15 helped absorb selling pressure toward the end of the week. Fidelity’s FBTC was reported to have added close to $194 million, even though some outflows were recorded on Friday. Meanwhile, Grayscale’s GBTC was described as largely flat, as early gains were balanced by later withdrawals.

Other products, including Ark & 21Shares’ ARKB and Bitwise’s BITB, were said to have closed the week slightly positive. Market commentators stated that these Bitcoin ETF inflows showed sustained institutional confidence in Bitcoin, even as prices fluctuated in the short term.

Ether and Altcoin ETFs Attract Steady Institutional Support 

Reports also indicated that Ether ETFs enjoyed their strongest week of the year, with net inflows of about $479 million on traded volumes near $7.74 billion. BlackRock’s ETHA was said to have accounted for the largest share, adding over $219 million. Additionally, Grayscale’s Ether Mini Trust and ETHE were reported to have attracted more than $200 million combined, while Fidelity’s FETH ended the week modestly higher.

In the altcoin space, analysts said XRP ETFs recorded nearly $57 million in inflows, mainly driven by Grayscale’s GXRP. Solana ETFs were also reported to have gained close to $47 million, led by Bitwise’s BSOL.

To this end, experts explained that institutions appeared to be buying market dips, keeping Bitcoin and Ether ETFs inflows resilient as January progressed.


In order to place winning trades with us via Bybit, you can open an account here.