The market for BNB against Tether in the last 24 hours has declined by 1.91%, underperforming its 7-day increase of 2.60%. However, while the pair has seen a decline, it is performing better than the broader crypto market, which fell by 2.61%, according to Coinmarketcap data. As it stands, this slight pullback contrasted with its recent weekly strength, suggesting a pause in momentum rather than a complete change in trend.
To this end, analysts are of the opinion that the recent decline is a result of a broader market sell-off due to increasing geopolitical tensions, leading to its inability to sustain above the previous resistance at $935.
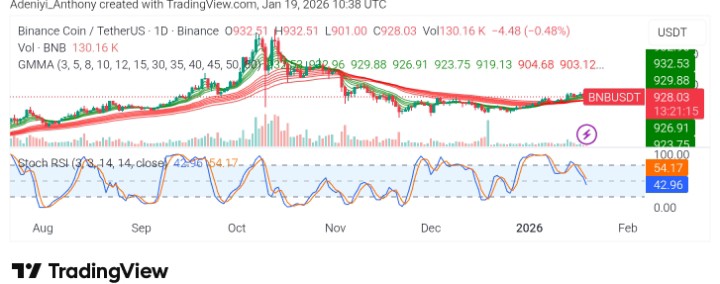
Currently, BNB trades at $928.03 with a stable trading volume of around 130,00 on the daily timeframe.
Technical Indicators
Major Resistance Levels: $935, $960, and $1,020
Major Support Levels: $920, $905, and $880
BNB Technical Analysis
On the daily timeframe, BNB against Tether seems to remain in a broader corrective structure after the October peak, with the price trading in the upper section of an improving Guppy Multiple Moving Averages (GMMA). However, despite the long-term neutral-bearish structure, the recent BNB price prediction suggests reduced downside momentum as the price compresses above the $920 level. As it stands, the current stance suggests stabilization, as the short-period EMAs appear to be diverging further to the north.
Meanwhile, @cryptochiefss on X (formerly Twitter) has spoken highly about BNB, suggesting the token is approaching a critical decision zone after completing an Adam and Eve bottom formation. The analyst stated that a decisive breakout and sustained hold above the current range would validate the reversal structure and potentially pave the way for a continued move toward the psychological $1,000 resistance level.
$BNB is pressing into a major decision zone after completing an Adam & Eve bottom.
A clean breakout and hold above this range would confirm the reversal structure and open the door for a continuation move towards the psychological $1,000 level resistances. pic.twitter.com/R94N00IOg2
— Crypto Chiefs (@cryptochiefss) January 18, 2026
To this end, once the Stochastic RSI signals an improved condition and reduced selling pressure, a bounce to $930 would indicate a move into the $940-$960 range; otherwise, a loss below would reopen downside risk.
Binance BNB Coin Price Prediction Update
Earlier in January, BNB was trading around $943; the token appears to be posting a modest daily gain of nearly 1%, with the advance driven by market structure rather than speculative excitement. As it stands, the price action is showing clear respect for the lower range near $924. Despite remaining about 31% below its all-time high, the chart shows recovery and a promising phase rather than a breakdown scenario.
BNB/USDT Analysis: BNB Price Prediction
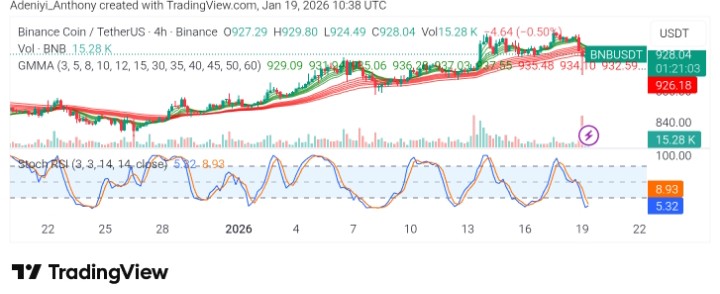
On the 4-hour chart, BNB/USDT appears to be heading south with the price under the long-period EMAs, suggesting increasing bearish pressure as the price operates under $930. However, the Stochastic oscillator shows momentum is stabilizing as selling pressure faces equal bullish effort. The Stochastic’s lines suggest an impending upside move in the coming session, as a move above $930 would confirm a move to the north.
You can purchase crypto coins here. Buy Crypto
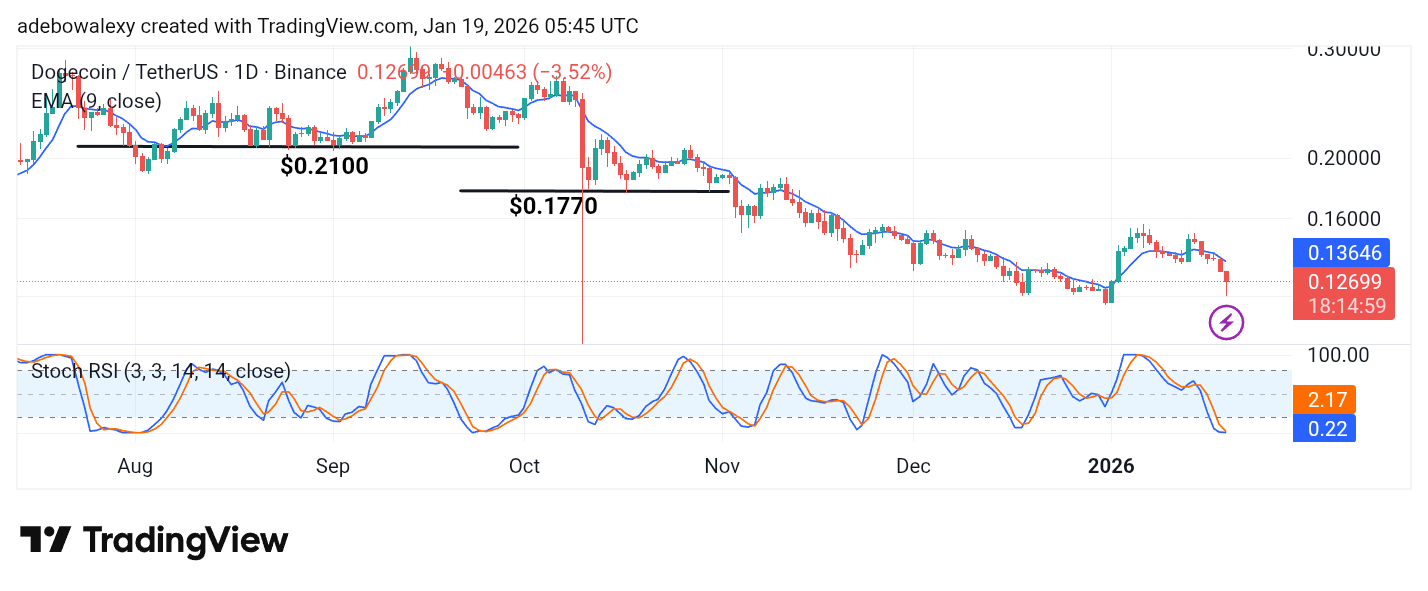
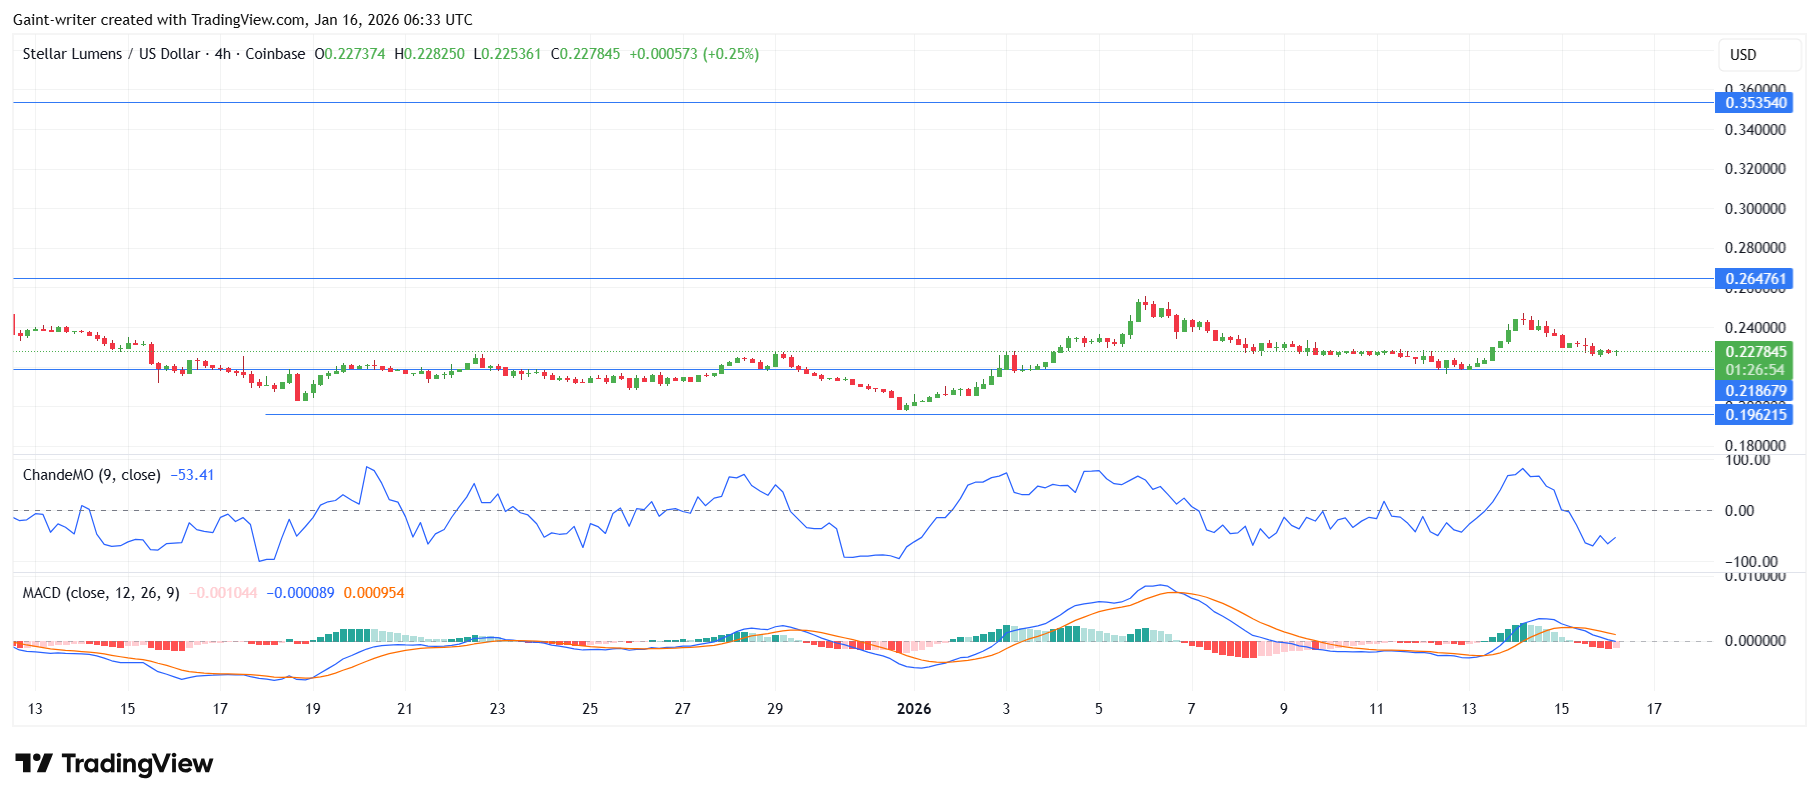
 Sellers made a final aggressive attempt to drive price below $0.1990, but the move was quickly reversed due to the presence of strong buyers defending that level. This rejection highlights