BlackRock Sees Bitcoin Outflows As Ethereum Buying Picks Up — What’s Behind The Shift?

Key Takeaways:

  • BlackRock’s IBIT saw $60M in outflows while ETH purchases topped $20M.
  • The shift reflects client Bitcoin selling alongside BlackRock’s ETH accumulation.
  • It may signal an early rotation toward Ethereum, but more flow data is needed.


A single week of fund flows rarely rewrites a thesis. But when the world’s largest asset manager shows net selling in its Bitcoin ETF at the same time it’s adding to Ethereum, that combination is hard to file away as noise.

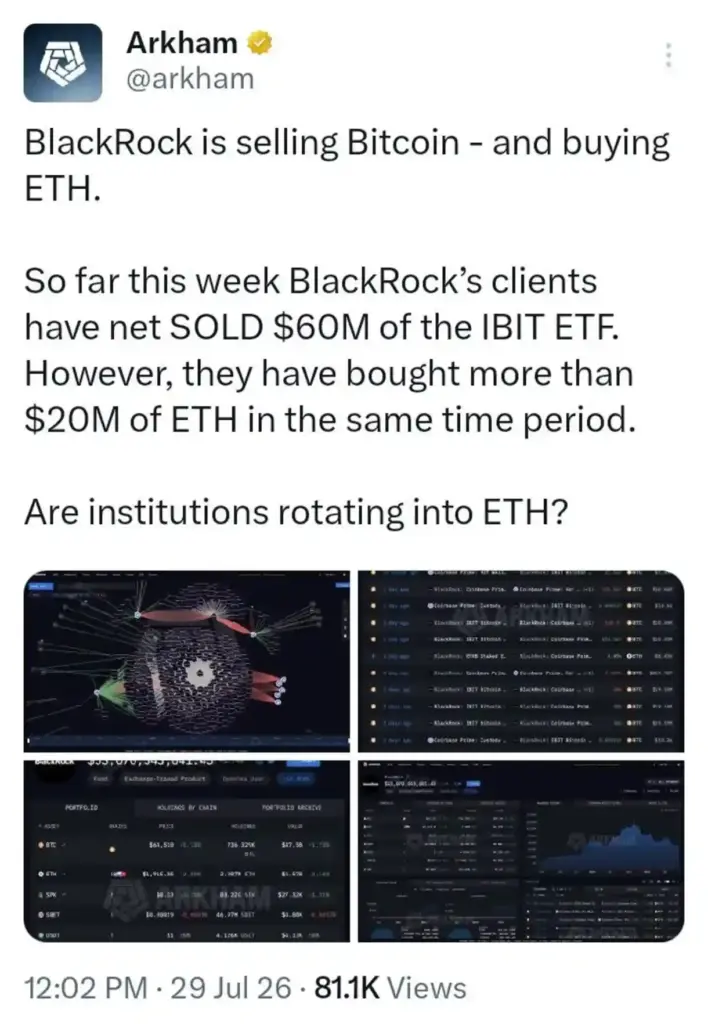
Arkham reported on July 29, 2026 that BlackRock’s clients have net sold $60 million of the IBIT ETF so far this week, while the firm has bought more than $20 million of ETH over the same period. ETH trades at $1,920.22, up 2.2% over the past seven days.
BlackRock Sees Bitcoin Outflows As Ethereum Buying Picks Up — What's Behind The Shift?
Image Via X/Arkham.

Two Flows Moving in Opposite Directions

The distinction Arkham is drawing matters. IBIT’s outflows reflect what BlackRock’s ETF clients are choosing to redeem — investor-driven selling flowing through the fund structure. The ETH purchases, by contrast, appear on BlackRock’s own on-chain wallets, tracked moving through Coinbase Prime custody alongside the firm’s existing BTC and staked ETH holdings. That’s not the same entity making one consistent decision — it’s client redemptions on one side and BlackRock’s own accumulation on the other, happening in the same week.

What BlackRock’s Wallets Currently Show

Arkham’s portfolio data puts BlackRock’s tracked crypto holdings at just over $55 billion, dominated by 736,329 BTC worth roughly $47.58 billion, alongside 3,987 ETH and additional staked ETH positions. Even with this week’s reported ETH buying, Bitcoin remains overwhelmingly the larger position by a wide margin — meaning the current shift looks more like a rotation at the margin than any wholesale change in allocation.

The Chart Behind the Question

Looking at the seven-day chart, ETH spent July 24 through 26 consolidating in the high $1,850s to low $1,900s, before a sharp rally on July 27 pushed price above $1,960 — its high for the week. That move faded through July 28, and ETH has since chopped between roughly $1,900 and $1,930, settling at $1,920.22 as of July 30. The reported BlackRock buying falls within this same window, though the size involved is far too small relative to ETH’s overall market to have driven the rally on its own.
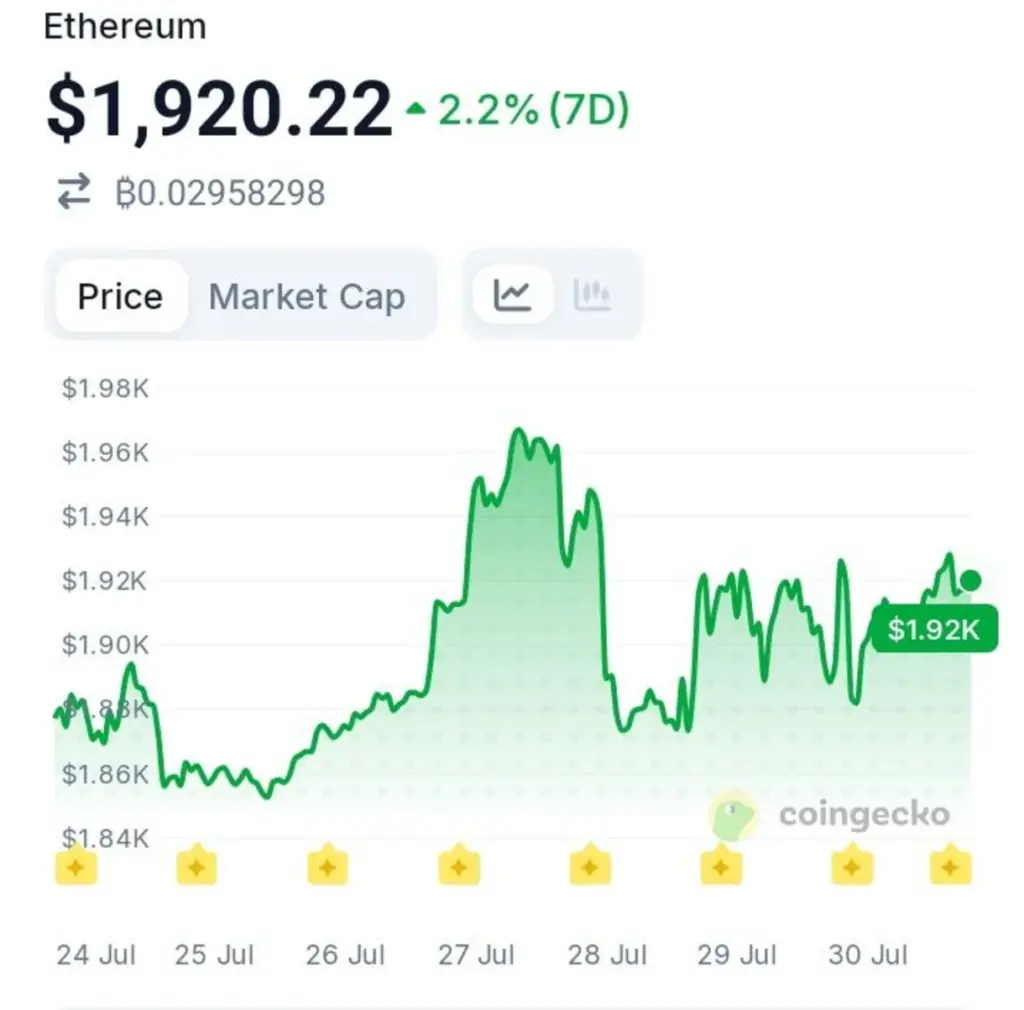
ETHUSD Weekly Chart. Source: CoinGecko.

Why the Question Is Worth Asking, Even Without an Answer Yet

$20 million in ETH purchases against $60 million in IBIT redemptions isn’t proof of a broad institutional pivot from Bitcoin into Ethereum — the numbers are small next to BlackRock’s total crypto footprint, and a single week of flows can reverse just as quickly as it appeared. 

What makes it notable is the direction: institutional flows moving opposite ways across two assets from the same firm, in the same short window, is exactly the kind of early signal on-chain analysts watch for before a larger rotation becomes visible in the data. Whether this is the start of something or a one-week blip is the detail the next few weeks of flow data will need to answer.
Binance (BNB) Launches Toward the $600 Mark

Summary:

  • BNB gained over 3%, breaking above the $580 resistance.
  • Bullish indicators remain strong, with price above the 9-day EMA and rising SRSI.
  • BNB could target $600 short term, with $700 possible if momentum continues.

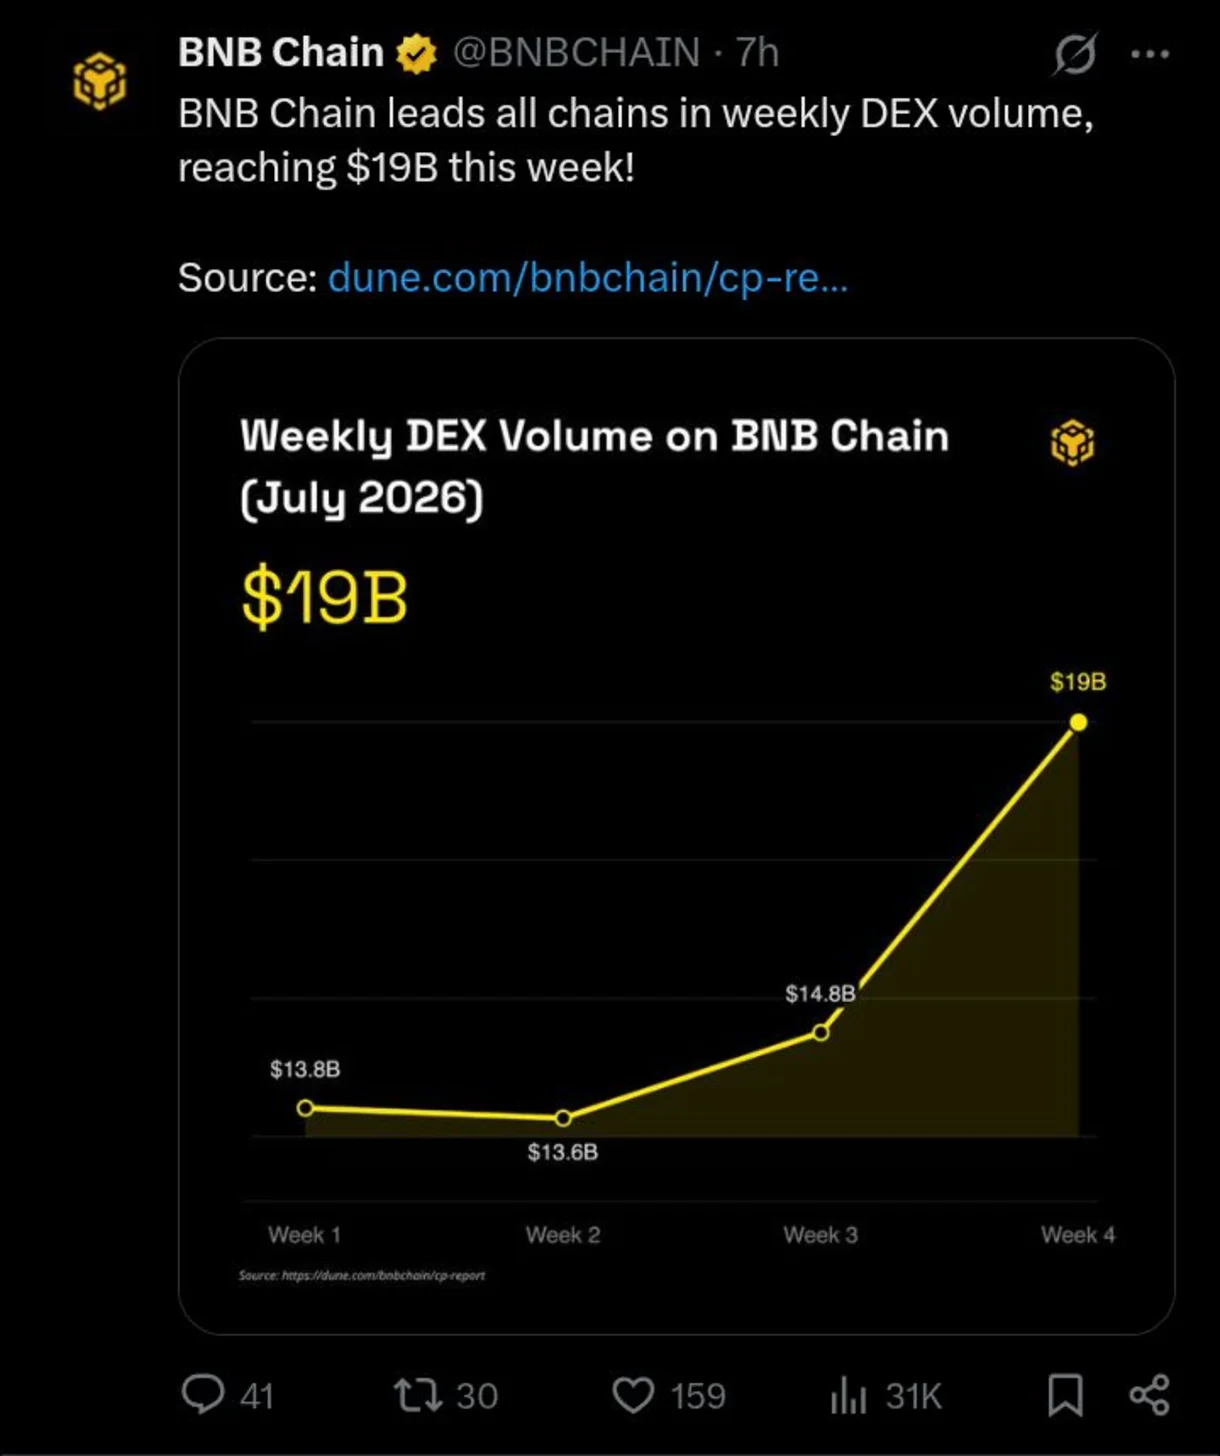
As Binance continues to lead all DEX platforms in weekly trading volume, the BNB token has maintained a bullish trajectory. As of today, price action has broken above a medium-term resistance level by a notable margin, suggesting that the market may continue its upward momentum.

BNB 24-Hour Chart

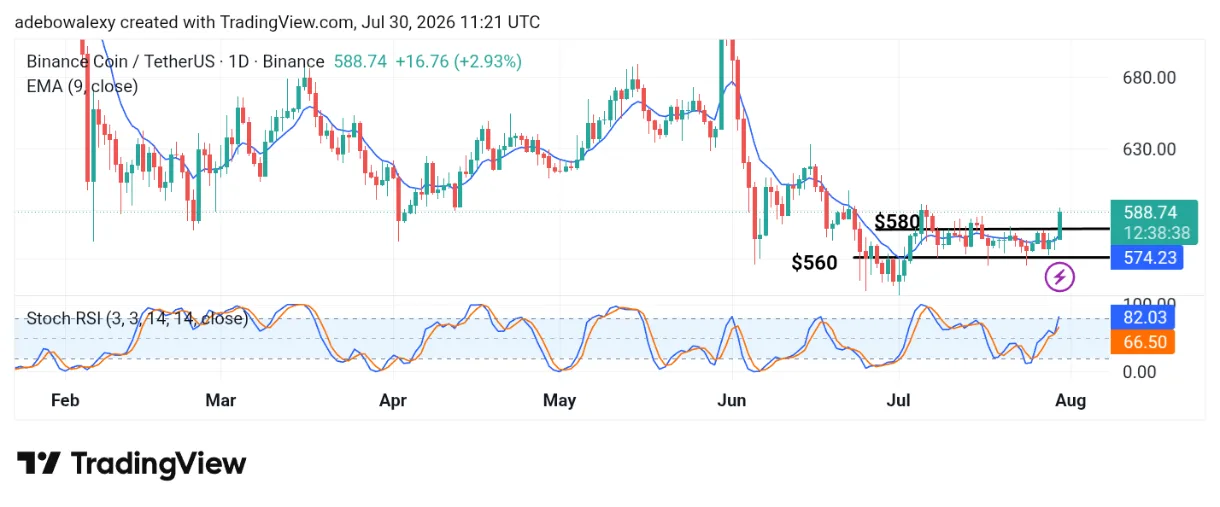
Based on today’s price movement, BNB has recorded a gain of more than 3%. The latest price candle has broken above the $580 resistance level, pushing the token to around $588 at the time of writing.

Binance (BNB) Launches Toward the $600 Mark
Binance (BNB) Launches Toward the $600 Mark. Source: TradingView

Additionally, BNB is trading well above the 9-day Exponential Moving Average (EMA), while the Stochastic Relative Strength Index (SRSI) has produced a bullish crossover and continues to trend upward.

Binance Is Drawing Attention

Going by activities in the BNBUSDT market both technical and fundamental indicators suggest that BNB is attracting increased market attention. The growth in DEX trading volume has coincided with the recent price surge, providing additional support for bullish traders.

The current session has brought the token closer to the $600 price level, making it the next key short-term target for traders. A successful move above this level could catalyze further gains. The bullish outlook is further supported by the positions of the SRSI and the 9-day EMA, both of which continue to favor upward price movement.

Binance (BNB) Launches Toward the $600 Mark
Binance (BNB) Launches Toward the $600 Mark. Source: X.com

BNB Eyes the $600 Target

The $600 price level appears to be the next immediate target for the Binance market. Both price action and technical indicators support this outlook, suggesting that the market still has room to move higher.

Although $600 level seems like a short-term objective, traders with a medium-term outlook may consider $700 the next significant upside target.

Cardano (ADA) Seems Ready for a Breakout

Summary:

  • ADA is rebounding strongly, supported by a bullish double-bottom pattern.
  • Technical indicators are positive, with SRSI showing a bullish crossover.
  • ADA could target $0.186, with $0.20 possible if momentum continues.

The Cardano market has recorded a notable upward rebound today. This coincides with continued developments on the blockchain. The rollout of the Shelley upgrade, which further decentralizes the network, appears to have sparked renewed interest and attracted more buyers.

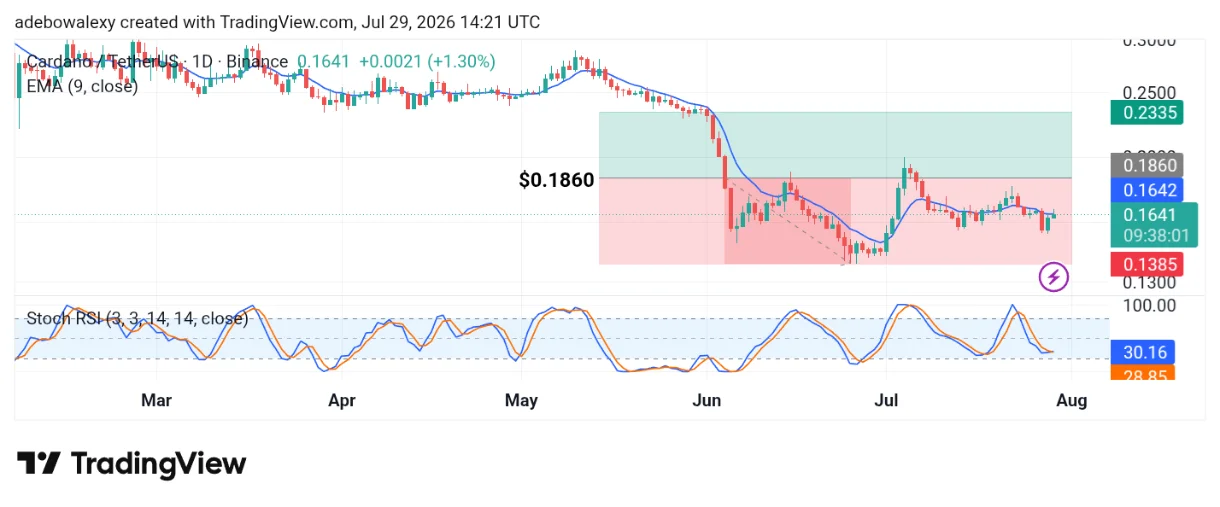
ADA 24-Hour Chart

Since the previous session, the Cardano market has rebounded. The current session has maintained the bullish momentum established earlier. As a result, the token is now trading at the level of the 9-day Exponential Moving Average (EMA).

Cardano (ADA) Seems Ready for a Breakout
Cardano (ADA) Seems Ready for a Breakout. Source: TradingView

The Stochastic Relative Strength Index (SRSI) has produced a bullish crossover, signaling a potential reversal. In addition, recent price action suggests that the market has formed a double-bottom pattern, further strengthening the bullish outlook.

Cardano Is Set to Breach Nearby Resistance

As noted above, the ADA/USDT market has formed a bullish double-bottom pattern, indicating that buying pressure may continue to strengthen. Technical indicators also point to the possibility of a significant upward move.

The SRSI previously declined below the 50 level and even fell beneath the 40 mark before reversing higher. The recent bullish crossover supports the expectation of continued upward price movement.

Cardano (ADA) Seems Ready for a Breakout
Cardano (ADA) Seems Ready for a Breakout.Source: X.com

Hitting the $0.1860 Target Seems Realistic, but Aiming Higher Isn’t Unreasonable.

Cardano appears poised for a stronger upward move, supported by both price action and technical indicators. The latest price candle briefly broke above the 9-day EMA before pulling back to retest it. Nevertheless, the candle remains bullish, suggesting that buyers are still in control of the market.

Additionally, the developing double-bottom pattern suggests a stronger recovery. As a result, while the market may first target the $0.1860 resistance level, a move toward $0.2000 cannot be ruled out.

Crypto Whale Wallets: How to Track Big Moves Without Overreacting

A crypto whale is a wallet or entity that holds a large amount of a coin. Whale activity attracts attention because big holders can influence liquidity, sentiment, and short-term volatility.

When a whale moves coins, traders often react quickly. A large transfer to an exchange may be interpreted as potential selling. A large withdrawal from an exchange may be seen as accumulation. A big stablecoin transfer may suggest buying power preparing to enter the market.

The problem is that whale data is easy to misread. Not every large transfer is a trade. Exchanges move funds between internal wallets. Custodians rebalance storage. Funds transfer assets for operational reasons. A scary-looking transaction can mean very little without context.

telegram

Free Crypto Signals Channel

More than 50k members
Technical analysis
Up to 3 free signals weekly
Educational content
telegram Free Telegram Channel

The best way to use whale tracking is to look for patterns, not isolated screenshots. One large Bitcoin transfer may be noise. Repeated inflows from known large holders during a failed rally may be more important. Multiple large withdrawals during a steady uptrend may support a supply squeeze thesis.

Wallet labels help but are not perfect. Some blockchain explorers and analytics tools identify exchange wallets, fund wallets, and known entities. Still, labels can be incomplete or wrong. Traders should avoid treating every “whale alert” as a direct instruction to buy or sell.

A practical checklist helps. Ask: Is the transfer going to or from an exchange? Is it large compared with normal daily volume? Did price react? Is the market near support or resistance? Are funding and open interest also showing crowding?

Cryptocurrency Signals Monthly
£42
  • 2-5 Signals Daily
  • 82% Success Rate
  • Entry, Take Profit & Stop Loss
  • Amount To Risk Per Trade
  • Risk Reward Ratio
Cryptocurrency Signals Quarterly
£78
  • 2-5 Signals Daily
  • 82% Success Rate
  • Entry, Take Profit & Stop Loss
  • Amount To Risk Per Trade
  • Risk Reward Ratio
Cryptocurrency Signals Yearly
£210
  • 2-5 Signals Daily
  • 82% Success Rate
  • Entry, Take Profit & Stop Loss
  • Amount To Risk Per Trade
  • Risk Reward Ratio
arrow
arrow

Whale activity can be useful for confirming an idea. If your chart already shows weakness and whales are sending coins to exchanges, caution increases. If your chart shows strength and exchange balances are falling, the bullish case may improve.

Key takeaway:

Whale wallets can provide useful context, but single transactions are not reliable trade signals. Track patterns, confirm with price action, and avoid emotional reactions to large transfers.

Educational content only. Not financial advice. DYOR.

Ethereum Whale Quietly Adds $14.6M In ETH — How Much Bigger Could This Bet Get?

Key Takeaways:

  • Ethereum whale adds $14.6M in ETH, bringing holdings to $37M.
  • Two major buys from the same BitGo source suggest steady accumulation.
  • The buying pattern could signal a larger ETH position is still being built.


Six weeks isn’t long in whale-watching terms, but it’s enough time to see a pattern take shape. One Ethereum wallet has now made its second major purchase in that window, and the pace of accumulation is starting to say more than the dollar figures alone.

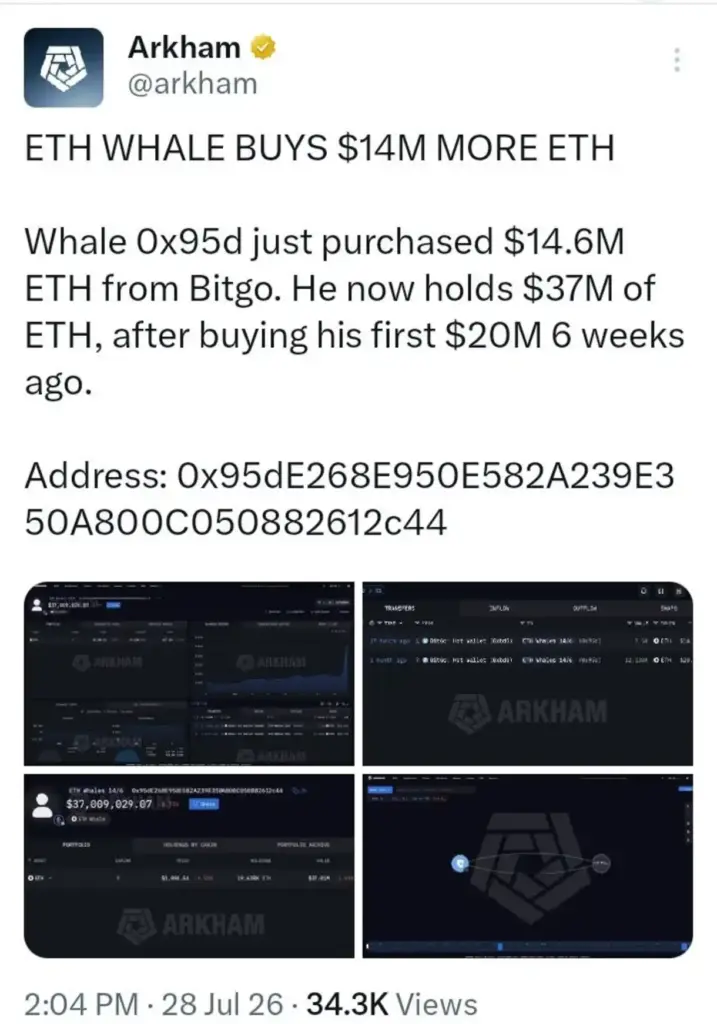
Arkham reported on July 28, 2026 that whale wallet 0x95d purchased $14.6 million in ETH from Bitgo, bringing its total holdings to $37 million, after making its first $20 million purchase six weeks earlier. ETH trades at $1,886.09, down 2.3% over the past seven days.

Ethereum Whale Quietly Adds $14.6M In ETH — How Much Bigger Could This Bet Get?
Image Via X.

Two Buys, One Consistent Source

What stands out in Arkham’s data isn’t just the size of the position — it’s where both purchases came from. The wallet’s most recent buy, roughly 7,516 ETH worth $14 million, arrived from Bitgo’s hot wallet 17 hours before the alert. Its first purchase, about 12,120 ETH worth $20 million, came from the same Bitgo wallet a month earlier. Routing two separate eight-figure purchases through the same institutional custody source over a six-week span points to a deliberate, repeatable buying process rather than a single opportunistic trade.

A Position Still Being Built

Arkham’s portfolio data shows the wallet now holding 19,636 ETH, currently valued at just over $37 million, with an average cost basis of $1,884.54 — almost exactly in line with where ETH trades today. That detail matters: despite ETH’s pullback over the past week, this whale’s position remains roughly at breakeven rather than underwater, suggesting the buys have been timed to accumulate through weakness rather than chase strength.

The Price Backdrop for This Accumulation

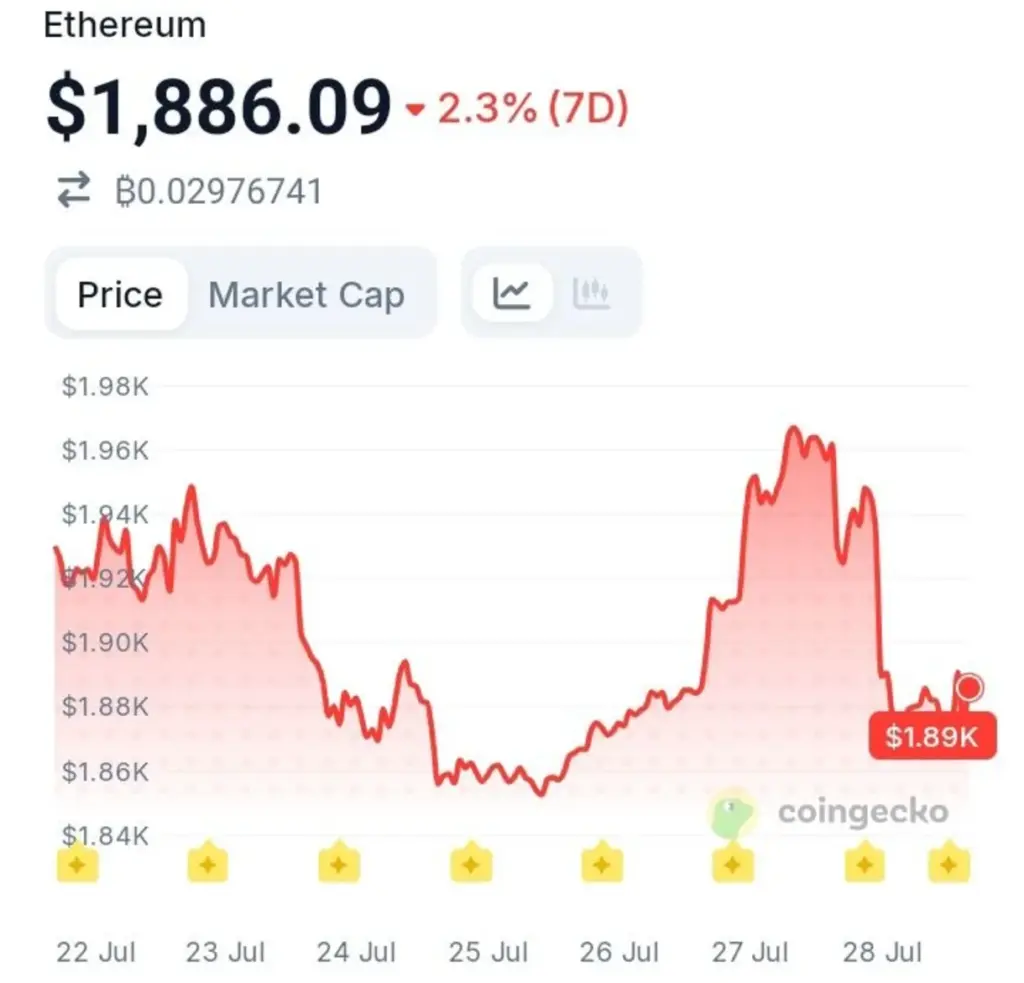
Looking at the seven-day chart, ETH spent July 22 through 24 sliding from a high near $1,946 down to a low around $1,858 by July 25, before staging a sharp recovery that pushed price back above $1,960 on July 27. That rally has since faded, with ETH settling at $1,886.09 as of July 28 — the same day this latest whale purchase was reported. The timing places the buy in the middle of a choppy, directionless week, rather than at either extreme of the range.

Ethereum Whale Quietly Adds $14.6M In ETH — How Much Bigger Could This Bet Get?
ETHUSD Weekly Chart. Source: CoinGecko.

Why the Trend Matters More Than the Total

$37 million is a meaningful position, but it’s not large enough on its own to move a market the size of Ethereum’s. What makes this wallet worth tracking is the cadence — two purchases of comparable scale from the same custodial source in six weeks suggests this could be an early stage in a larger accumulation strategy rather than a completed one. Whether the next Bitgo-sourced purchase shows up in another six weeks, or sooner, is the detail that will determine whether this turns into one of the more consequential wallets to watch this quarter.

Solana’s Biggest Capacity Upgrade Yet Is Nearly Here — Will It Change the Game?

Key Takeaways:

  • Solana is raising block capacity by 66%, from 60M to 100M compute units.
  • The upgrade could boost DeFi and other high-demand applications.
  • SOL’s price remains weak, making post-upgrade network performance key to watch.


A blockchain’s speed limit isn’t fixed forever — it’s a governance decision, and Solana just voted to raise its own by two-thirds in under a day.

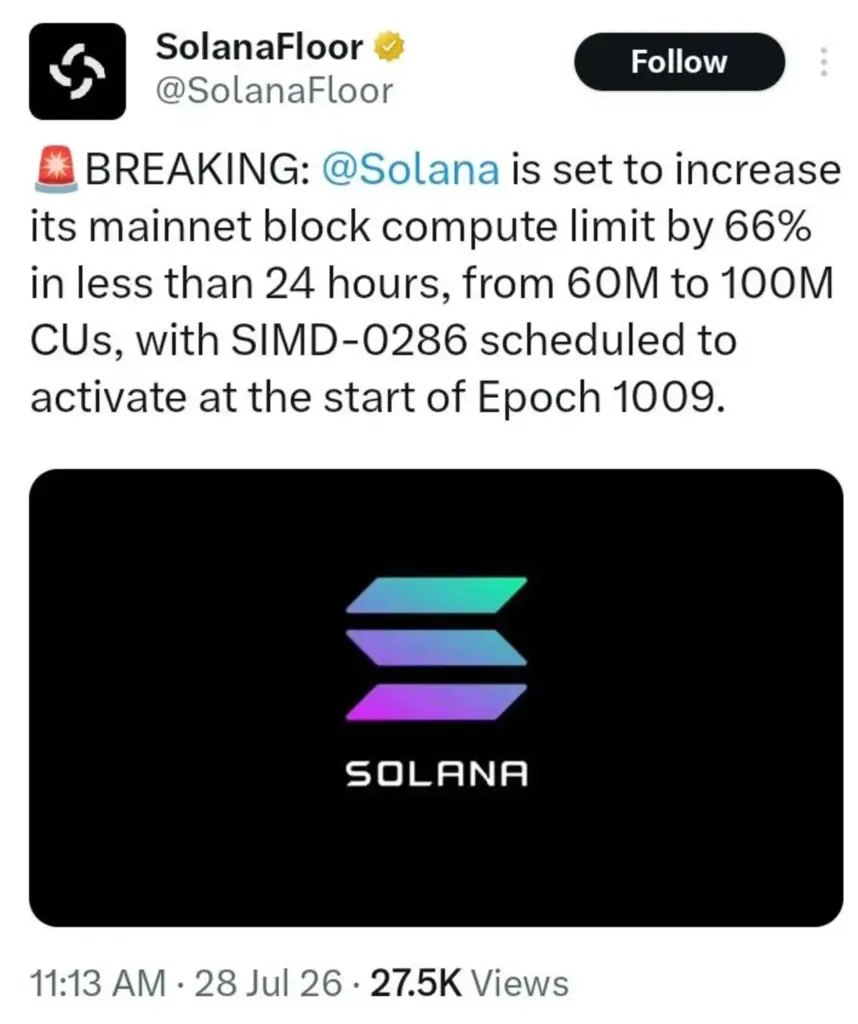
SolanaFloor reported on July 28, 2026 that Solana is set to increase its mainnet block compute limit by 66% in less than 24 hours, from 60 million to 100 million compute units, with the upgrade under proposal SIMD-0286 scheduled to activate at the start of Epoch 1009. 

Solana's Biggest Capacity Upgrade Yet Is Nearly Here — Will It Change the Game?
Image Via X.

What a Compute Unit Increase Actually Changes

Compute units function as the processing budget each block gets to execute transactions within roughly 400 milliseconds. A higher ceiling means more transactions, more complex smart contract calls, and denser decentralized application activity can fit into a single block without hitting execution limits. 

SIMD-0286 only raises the total compute allowed per block — other constraints, like the maximum writable accounts per block, remain unchanged, meaning the added headroom benefits parallelizable transaction types such as DeFi swaps and NFT mints most directly.

The Second Increase in a Short Window

This upgrade doesn’t arrive in isolation. It follows a prior increase from 50 million to 60 million compute units that had already lifted the network’s sustained throughput to around 1,700 transactions per second during peak traffic. Demand from restaking protocols, order-book DEXs, and real-world asset platforms has continued to press against that ceiling, which is what’s driving developers to push the limit higher again so soon after the last adjustment. 

The proposal itself was authored by Jito Labs, one of the more influential infrastructure teams in the Solana ecosystem, reflecting how directly validator-side infrastructure providers are shaping the network’s capacity roadmap.

Price Action Doesn’t Reflect the Upgrade Yet

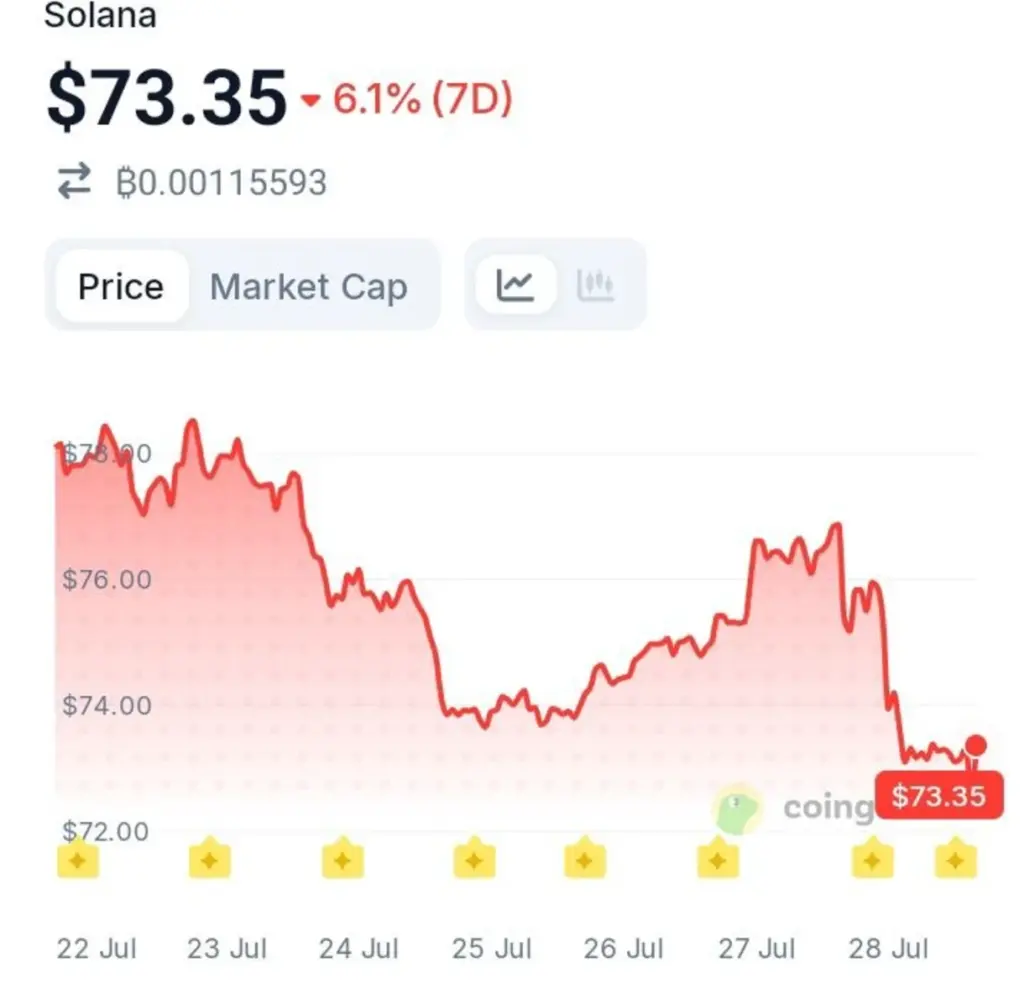
Looking at the seven-day chart, SOL has been under consistent pressure, sliding from highs near $79 on July 22 down to a low near $74 by July 25, followed by a brief recovery toward $77 on July 27 before dropping sharply to $73.35 by July 28 — the same day this upgrade news broke. 

Solana's Biggest Capacity Upgrade Yet Is Nearly Here — Will It Change the Game?
SOLUSD Weekly Chart. Source: Coingecko.

That disconnect is worth noting: a substantial capacity upgrade landed on a day when price moved in the opposite direction, underscoring that infrastructure improvements and short-term price sentiment don’t always move together.

What to Watch Once Epoch 1009 Begins

The real test comes after activation, not before it. Validator metrics in the 48 to 72 hours following the epoch transition — skip rates, block production consistency, and transaction success rates — will show whether the network’s infrastructure can handle the higher ceiling in practice rather than just on paper. Solana’s governance process keeps approving more ambitious throughput targets; whether the underlying hardware and validator set keep pace is the question this upgrade is about to answer in real time.

What’s the Reason Behind BitMEX’s Shutdown?

Summary:

  • BitMEX will shut down on September 23, 2026, after losing market share and liquidity.
  • Competitors have overtaken it, despite continued strong demand for perpetual futures.
  • BitMEX leaves a lasting legacy as a pioneer of crypto derivatives trading.

BitMEX, a pioneer in crypto perpetual futures, is shutting down after years of regulatory pressure, declining liquidity, leadership challenges, and unsuccessful attempts to sell the business.

The exchange is not closing because perpetual futures no longer work. Rather, it is shutting down because the product became so successful that competitors were able to build on the model and eventually surpass BitMEX.

BitMEX announced on July 23, 2026, that it will cease exchange operations on September 23, 2026, at 04:00 UTC, bringing more than eleven years of operation to an end.

Official Shutdown Plan

Following the announcement, BitMEX stopped accepting new users. Trading will continue until August 26, after which users will only be allowed to reduce or close existing positions.

The exchange will then begin force-closing any remaining contracts as individual markets are shut down. Any positions still open at 04:00 UTC on September 23 will be closed by BitMEX.

Despite the shutdown, users will still be able to access their account history and withdraw their funds. However, customers who choose to leave assets on the platform will be charged $50 per month or 1% of their account balance annually. The company also stated that these fees may increase over time.

What's the Reason Behind BitMEX's Shutdown?
What’s the Reason Behind BitMEX’s Shutdown. Source: Google Images

Liquidity Left—and Never Returned

BitMEX’s shutdown was largely due to its steep decline in market share.

CryptoQuant founder Ki Young Ju reported that BitMEX processed about $84 million in Bitcoin futures volume on July 22, representing just 0.08% of the market. Kaiko data, cited by Reuters, estimated its market share at below 0.01%. Although the figures use different methodologies, both highlight the exchange’s dramatic fall from its former dominance.

Meanwhile, the perpetual futures market continues to thrive. Centralized exchanges recorded approximately $12.7 trillion in trading volume during the second quarter of 2026, while Hyperliquid has become the second-largest perpetual futures platform by open interest.

BitMEX was not brought down by declining demand. Instead, traders and market makers migrated to platforms offering deeper liquidity, tighter spreads, broader asset listings, and transparent on-chain trading. Once liquidity shifted elsewhere, winning it back became increasingly difficult.

What Message Does BitMEX’s Closure Send?

BitMEX’s shutdown is unlikely to have a significant impact on the global crypto derivatives market, as the exchange no longer holds enough trading volume or open interest to create major market instability. However, this assumes that users close their positions and withdraw their funds before liquidity declines further.

What's the Reason Behind BitMEX's Shutdown?
What’s the Reason Behind BitMEX’s Shutdown. Source: Google Images

BitMEX introduced several innovations that helped shape modern cryptocurrency trading, including perpetual futures, funding-rate mechanisms, Bitcoin-backed collateral, automatic deleveraging, and real-time liquidation systems. At the same time, its rise and eventual decline highlighted both the opportunities and risks of offshore financial innovation, demonstrating how an unregulated product can reshape global markets while also emphasizing the importance of strong regulatory compliance.

The greatest irony is that BitMEX ultimately fulfilled its original mission: making professional crypto derivatives trading accessible to participants around the world. In doing so, it helped transform perpetual swaps into the industry’s most widely traded derivative product.

However, the product ultimately outgrew the platform that created it. Perpetual futures will continue to dominate crypto derivatives markets, but BitMEX itself will not. For that reason, September 23 marks more than the closure of another exchange—it represents the end of one of the most influential pioneers in cryptocurrency trading history.

Leading Reasons Why You Should Trade Futures

Summary:

  • Futures trading is now faster and largely electronic.
  • CME Globex offers global access, high liquidity, and low costs.
  • Regulation and central clearing help reduce trading risks.

In the early 1990s, futures were primarily traded on physical exchange floors. Traders would verbally announce their buy and sell prices and wait for another participant to take the opposite side of the trade. This method, known as open outcry, was the traditional way of trading futures. However, it was manual, relatively slow, and susceptible to errors such as order mismatches.

Technological advancements and innovations by major futures exchanges have transformed the industry. Today, futures trading is conducted electronically, with most transactions taking place through digital platforms. The CME Globex platform has become the world’s leading electronic marketplace for futures trading, where buy and sell orders are matched seamlessly. This allows traders to access highly liquid futures markets from around the world almost 24 hours a day.

1. Trade on the Globex Platform from Almost Anywhere, Nearly 24 Hours a Day

Our focus is on highly liquid futures contracts traded on the CME Globex platform, which is accessible in over 150 countries and operates nearly 24 hours a day. With only a brief daily trading pause at 5:00 p.m. (EST), the market offers continuous price action for traders across different time zones.

Traders can choose from more than 22 liquid futures contracts with tight bid-ask spreads, making the platform suitable for long-term, swing, day, and scalping strategies. Selected regional futures markets are also available to match local trading hours.

Leading Reasons Why You Should Trade Futures
Leading Reasons Why You Should Trade Futures. Source: Google Images

2. Trade in Highly Liquid Markets with Low Costs and Rapid, Transparent Execution

CME Globex is one of the world’s most liquid electronic futures exchanges, offering low transaction costs, tight bid-ask spreads, and competitive pricing. Its open-access network enables traders worldwide to connect directly through local brokers, ensuring fast and reliable order execution.

Whether you’re a retail trader, an institutional investor, or a corporation, you receive the same transparent pricing and efficient market access, making futures trading a cost-effective way to participate in the global financial markets.

3. Turn a Winning Day Trade into a Swing Trade

When a day trade performs well and shows the potential for a longer-term move, it can be converted into a swing trade. Since liquid futures trade almost around the clock, traders can hold positions overnight with significantly less concern about large price gaps when the market reopens.

A profitable trade initiated on a 5-minute chart can be managed on higher timeframes such as the 15-minute, 60-minute, or even the daily chart using predefined swing-trading exit rules. While these opportunities are not common, they can generate exceptionally high risk-to-reward (R-multiple) returns. These setups are often referred to as “pirate trades.”

Leading Reasons Why You Should Trade Futures
Leading Reasons Why You Should Trade Futures. Source: Google Images

4. Trade Global Futures Markets with Extended Market Access

The global futures market continues to expand, giving traders access to more products through extended electronic trading hours. Since 2006, futures from exchanges such as NYMEX, CBOT, and CBOE have been available on the CME Globex platform, alongside international contracts like Japan’s Nikkei and the UK’s FTSE futures.

Major exchanges have also extended their trading sessions. For example, EUREX now offers up to 21 hours of daily trading, reflecting the industry’s move toward longer—and potentially 24-hour—market access.

5. Futures Exchanges Promote Fair and Orderly Markets

The CME Globex marketplace Clearing House supports the CME Globex marketplace by acting by the CME Clearing House, which acts as the central counterparty for every futures transaction. It stands between buyers and sellers, guaranteeing the performance of every contract and ensuring the integrity of each trade.

This centralized clearing system eliminates pricing ambiguity, promotes market transparency, and reduces counterparty risk. In addition, the CME is regulated by the U.S. Commodity Futures Trading Commission (CFTC), helping to maintain a futures market that is competitive, efficient, and trustworthy.

With all these advantages, the real question is: Why haven’t you started trading futures?

Take your trading to the next level by exploring the opportunities offered by the global futures market.

Crypto Exchange Inflows and Outflows: What They Suggest About Supply

Exchange inflows and outflows track coins moving into and out of trading venues. They are not perfect signals, but they can help traders understand supply pressure.

An exchange inflow happens when coins move from a wallet to an exchange. This can suggest the owner may be preparing to sell, use collateral, or trade. If large inflows hit exchanges during weak market conditions, traders often become cautious because extra supply may come to market.

Cryptocurrency Signals Monthly
£42
  • 2-5 Signals Daily
  • 82% Success Rate
  • Entry, Take Profit & Stop Loss
  • Amount To Risk Per Trade
  • Risk Reward Ratio
Cryptocurrency Signals Quarterly
£78
  • 2-5 Signals Daily
  • 82% Success Rate
  • Entry, Take Profit & Stop Loss
  • Amount To Risk Per Trade
  • Risk Reward Ratio
Cryptocurrency Signals Yearly
£210
  • 2-5 Signals Daily
  • 82% Success Rate
  • Entry, Take Profit & Stop Loss
  • Amount To Risk Per Trade
  • Risk Reward Ratio
arrow
arrow

An exchange outflow happens when coins leave an exchange for a private wallet, custody solution, or long-term storage. This can suggest reduced immediate selling pressure. Long-term investors often withdraw coins when they do not plan to sell soon.

The context matters. A large Bitcoin inflow does not always mean a crash is coming. It could be an internal exchange transfer, custody movement, or market maker activity. A large outflow does not guarantee a rally. It simply changes the probability picture.

Traders should focus on unusual activity, not normal background noise. If Ethereum usually sees moderate exchange flows and suddenly records a major inflow during a support test, that is worth noting. If Bitcoin breaks resistance while exchange balances keep falling, that may support the bullish case.

Stablecoin flows can also matter. Large stablecoin inflows to exchanges may suggest buying power is arriving. If traders send USDT or USDC to exchanges, they may be preparing to buy crypto. Again, it is not guaranteed, but it adds useful context.

telegram

Free Crypto Signals Channel

More than 50k members
Technical analysis
Up to 3 free signals weekly
Educational content
telegram Free Telegram Channel

Exchange flow data works best with price action. If price is rising, volume is strong, and coins are leaving exchanges, bulls may have a cleaner backdrop. If price is failing at resistance while large inflows appear, caution is sensible.

For beginners, the main rule is simple: do not trade on one wallet movement. Use flows as one piece of a broader checklist that includes trend, volume, sentiment, funding, and news.

Key takeaway:

Exchange inflows can suggest potential selling pressure, while outflows can suggest reduced available supply. The signal is strongest when flows are unusual and confirmed by price behaviour.

Educational content only. Not financial advice. DYOR.