Market Analysis – The Bulls Are Seeking a Breakout
Compound show buyers resilience. Compound buyers have shown strong resilience as they refuse to pull out of their attempts to break out. Despite facing setbacks this week, the buyers remain determined. The bulls initially tried to breach the significant level of $61.990, but were met with resistance from sell traders, keeping the price in check. However, the buyers are actively seeking opportunities to launch more attacks in the market.
Compound Key Zones
Resistance Zones: $61.990, $69.030 Support Zones: $44.530, $$35.800
The Compound price has been lacking significant volatility for some time now. In December, the Bollinger Band indicated a lower compression before expanding slightly. Both buyers and sellers have been gradually taking turns in the market. The sellers pushed the price down to the significant zone of $44.530 earlier this month. However, the buyers managed to stage a comeback but failed to break through the market resistance.
Currently, the Bulls are putting in another effort to gain momentum. The Bollinger Band indicator shows a volatility trend, but buyers need to brace themselves for potential challenges. A breakthrough above the key level of $61.990 will confirm bullish actions in the crypto market. Traders should also keep an eye on the momentum indicator, as an increase in its pace signifies solid action and potential market movement.
Market Expectation
The short time frame also indicates bullish sentiment as buyers make another effort for a breakthrough. It is crucial for traders to closely monitor the market and look for signs of sustained momentum and a potential breakout.
Note: Cryptosignals.org is not a financial advisor. Do your research before investing your funds in any financial asset or presented product or event. We are not responsible for your investing results.
The majority of widely recognized tokens have failed to secure positions among the top five trending cryptocurrencies. Notably, this week, the MANTA market has emerged in the first position. As a newcomer, it appears to have capitalized on the initial hype, positioning itself as the most sought-after market for the week. This surge resulted in a substantial increase in trading volume within the first day it appeared on the chart. Conversely, the MYRO market has experienced a minor decline, slipping two positions to now occupy the fifth spot on the list. Without delay, let’s thoroughly analyze each of these tokens to identify potential opportunities for profit.
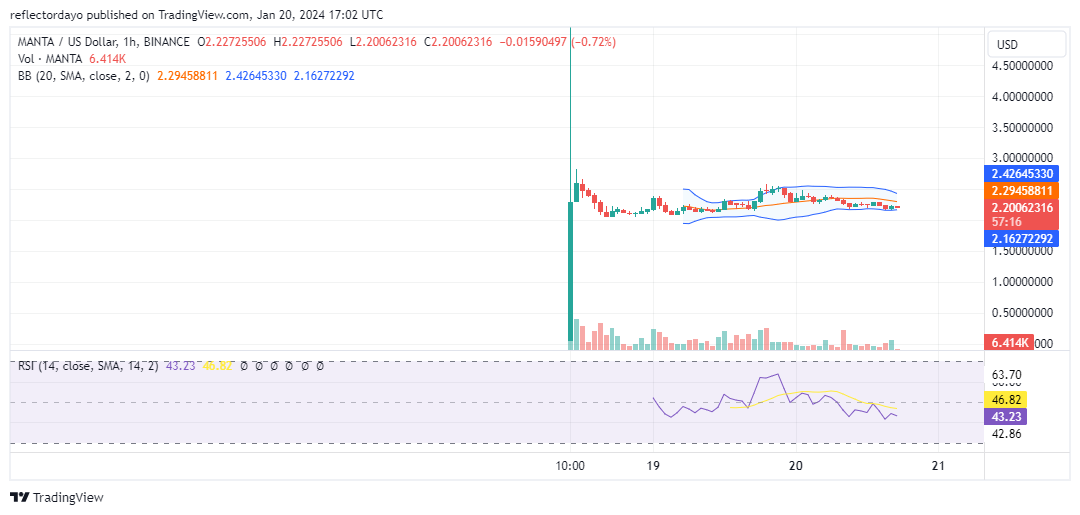
Manta Network (MANTA)
Major Bias: Indecision
The initial presence of this market was first observed on January 18. Opening at approximately $0.058, it reached a peak trading value of $6.3 before ultimately closing at around $2.34 by the day’s conclusion. During the daily trading session on January 18, based on a 1-hour chart perspective, a support level was established around the $2.079 price level. However, the price action remained confined within a stabilizing price channel and did not surpass the $2.500 price level. Looking ahead to the upcoming week, we anticipate potential upward momentum. This expectation is based on the increasing trade volume indicator, suggesting a growing level of market activity.
Current Price: $2.217
Market Capitalization: $551,770,265
Trading Volume: $456,136,966
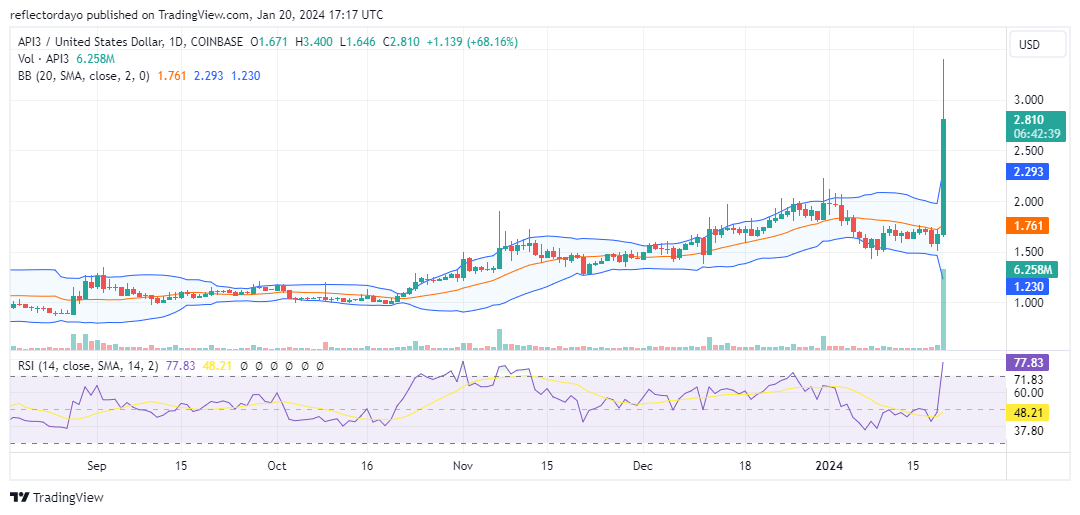
API3 (API3)
Major Bias: Bullish
The API3 market demonstrated remarkable performance in the last 24 hours, securing the second position on this week’s list of trending markets. After establishing a support level at $1.577, the market appeared relatively stagnant for the week but closed at $1.665 on Friday, continuing its trajectory into today. Notably, today’s market witnessed a sudden surge in trader interest, leading to a significant price increase of 91% over the last 24 hours.
Investors should exercise caution, anticipating a potential substantial price correction, given the aggressive and bullish price movement. This expectation is supported by the Relative Strength Index (RSI), which, due to the rapid and steep ascent, is currently indicating the market is in overbought territory. Despite the expectation of a correction, there remains the possibility that the market will establish a higher price level, sustaining the bullish trend. Traders should monitor these developments closely for informed decision-making.
Current Price: $2.808
Market Capitalization: $239,260,881
Trading Volume: $519,539,492
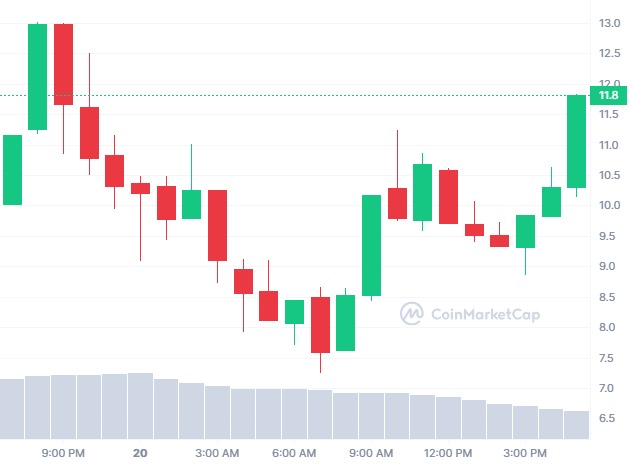
SatoshiVM (SAVM)
Major Bias: Bullish
Similar to the API3 market, this market experienced a sudden surge in investor interest within the last 24 hours. The market’s direction shifted following a bullish intervention from around the $9.0 price level. During the specific trading session, bearish sentiment initially pushed the price toward this level, potentially as traders awaited its approach before initiating purchases.
This turn of events led to the formation of a hammer candlestick, indicative of a bullish signal. Subsequently, the market has gained substantial upward traction, propelling it beyond the $11.00 price level.
Current Price: $10.05
Market Capitalization: $70,362,113
Trading Volume: $70,177,602
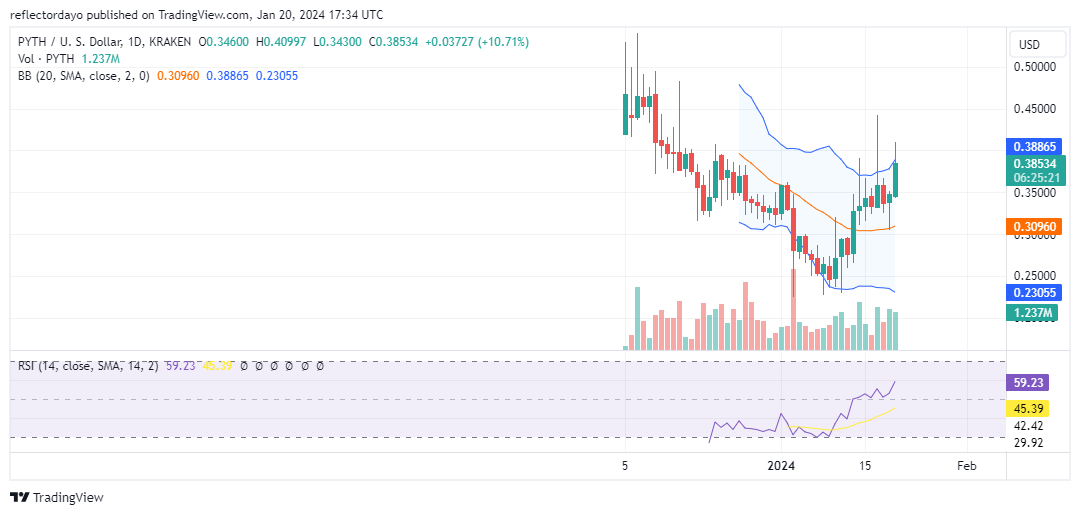
Pyth Network (PYTH)
Major Bias: Bullish
This week, the market has witnessed a significant surge in bullish sentiment, with traders demonstrating a clear inclination to engage in bullish trades. On Wednesday, the market experienced a substantial price pump, propelling the price to nearly $0.45. This surge triggered substantial profit-taking activities, leading to the market’s closure around the $0.36 price level.
Once again, today’s market performance suggests a potential retracement to the high observed on Wednesday, nearing the $0.450 price level. Confirming this expectation, the Relative Strength Index (RSI) is also indicating the growing bullish momentum in the market.
Current Price: $0.389
Market Capitalization: $584,906,004
Trading Volume: $118,585,187
Myro (MYRO)
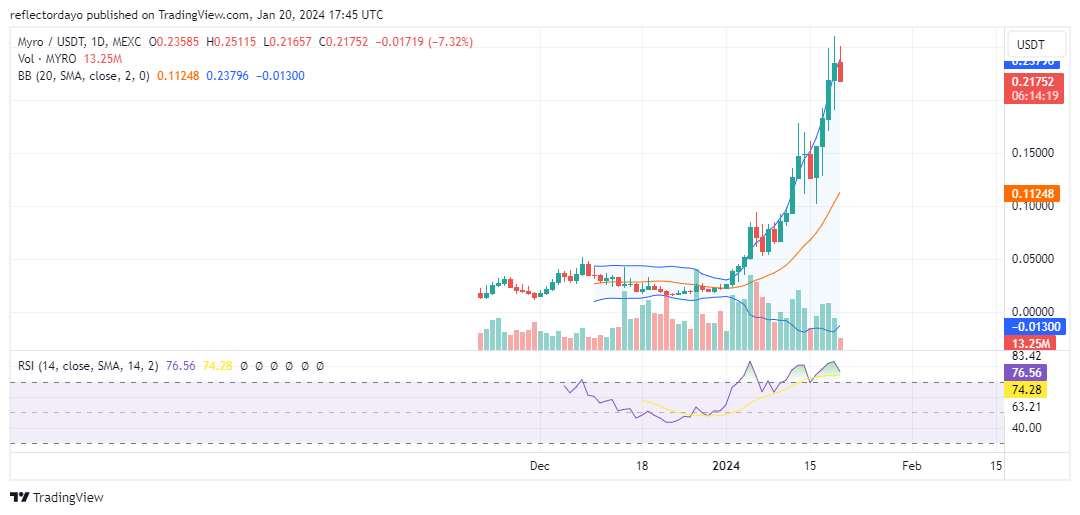
Major Bias: Bullish
Currently holding the third position is the Myro market, which has demonstrated a notable upward trend since last week. The market exhibits a distinct bullish trajectory, marked by the establishment of higher lows, a characteristic feature of bullish trends. Nevertheless, indicators suggest the potential for a price correction due to the market being significantly overbought.
Analyzing the Bollinger Bands indicator, we observe that bullish activities have led to a strong divergence in the upper standard deviation curve, while the lower standard deviation has not experienced substantial divergence. Although the bull market has heightened volatility, the market appears skewed in favor of the bulls, and the low standard deviation curve is on the verge of turning upward.
Despite these positive signals, today’s candlestick signals the development of a significant bearish price movement. Traders should remain vigilant for the formation of the next support level.
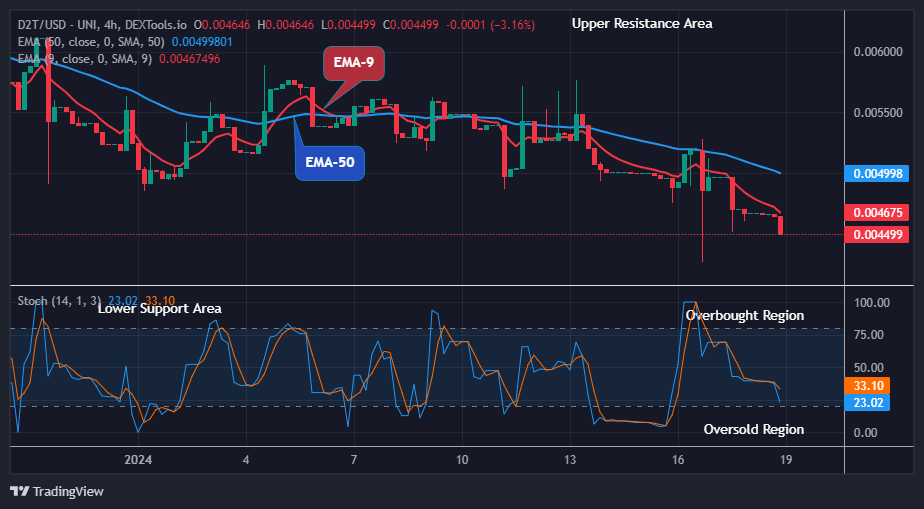
Dash 2 Trade Price Forecast: Price Is on the Verge of Reversal to the Upside (January 20) Today, the D2TUSD pair is on the verge of reversal as the crypto market selling pressure will soon be exhausted. The coin trading at the $0.00449 low value at the oversold region suggests that the coin price will soon reverse to face the upsides. Should the coin price turn up from the $0.00449 support and jump above the $0.00611 supply mark, the bearish thesis would get invalidated and this could lead the price to the $0.01000 upper resistance territory.
D2T (USD) Long-term Trend: Bearish (4H Chart) D2TUSD is bearish in its long-term outlook. The price responded to the shift in the market structure and is currently trading below the moving averages. The cryptocurrency price has been below the supply trend levels since its most recent low due to the persistent bearish pressure over the last few days. However, this will soon be invalidated as the low dip pressure seems to have been exhausted.
Today, the bears made a drop to a $0.00449 support level below the moving averages to resume the 4-hour chat. Given the current trend, buyers can purchase the item at a lower cost and push the market higher.
Therefore, if the bulls should increase their tension in the market, the price of Dash 2 Trade could reverse and turn positive and move above the key levels to the upper resistance zone.
Additionally, D2TUSD is likely going to reverse and face the upsides as the market is now trading around the 23% range of the daily stochastic; it means that the selling pressure will end soon. This will compel the buy traders to resume an uptrend and may likely break up the $0.00611 supply level soon in its higher time frame.
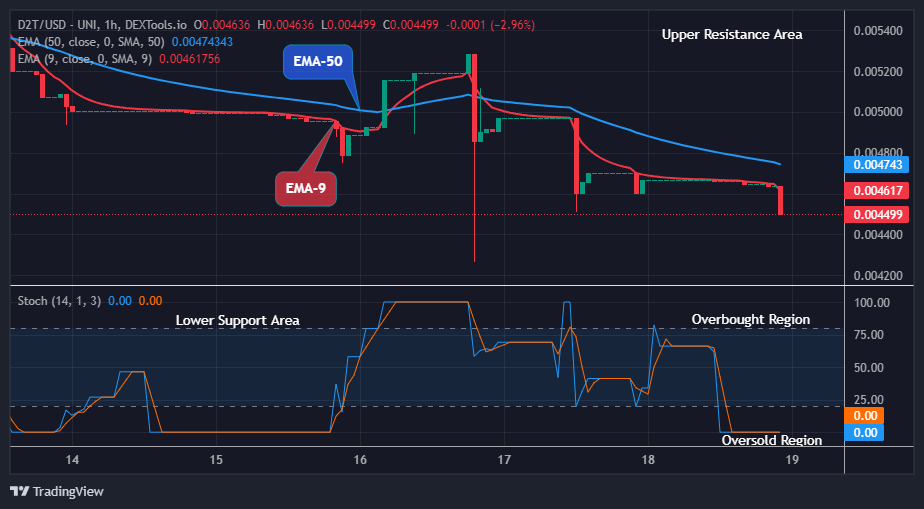
D2T (USD) Medium-term Trend: Bearish (1H Chart) According to the chart below, the medium-term outlook for the Dash 2 Trade market is in a bearish trend zone. The order flow by the sell-term traders at the $0.00464 low value in the past few hours has made the coin price stay below the supply levels in recent times. Actions from the sell traders further dropped the price of D2TUSD to a low at $0.00449 value below the resistance line as the 1-hour chart opens today. Thus, buyers need to add more pressure to their activities to move the market beyond the current price level.
Similarly, should the bulls exchange hands with the sell traders at the $0.00449 low value and close above the $0.00528 resistance value, the coin price might further increase to a $0.01000 resistance level which could lead to additional gains for the buy investors in its medium–term outlook.
Smart Money Insights: People and organizations perceived as highly educated and skilled, who often predict future trends, are known as smart money.
🚀Smart Money Insights📊
Smart Money is individuals & entities who are seen as experienced & informed, often signaling future trends.
Shiba Inu bears show weakness as the price progresses lower. The Market has been losing weight due to low impulse and a lack of significant price movements. The sellers have been dragging their feet, but they are currently planning to breach the critical level of $000000860.
SHIB Critical Levels
Resistance Levels: $0.00001050, $0.00000940 Support Levels: $0.00000856, $0.00000770
Shiba Inu has experienced a decline in price momentum since the beginning of this year. After the buyers lost their guard above the key level of $0.00001050, the bears swung into action. In early 2024, the sellers gained control and pushed the price lower. However, the bulls quickly picked up momentum and pushed the price back above the $0.0000770 level.
Currently, the bears have slowly drifted the price back to the $0.0000850 market zone. This retracement occurred after the buyers failed to breach the key level of $0.00001050. On the daily chart, the momentum indicator is stale and unyielding, indicating a lack of significant movement from both the bulls and bears. The Relative Volatility Index (RVI) is still in the middle range, suggesting that the atmosphere around Shiba Inu is characterized by low impulse.
Market Expectation
The sellers currently aim to push the price lower, but they are not showing enough strength to do so. As Shiba Inu becomes more volatile in the coming days, the trend will become clearer. Increased liquidity in the market will provide a clearer path for the Shiba Inu market.
Note: Cryptosignals.org is not a financial advisor. Do your research before investing your funds in any financial asset or presented product or event. We are not responsible for your investing results.
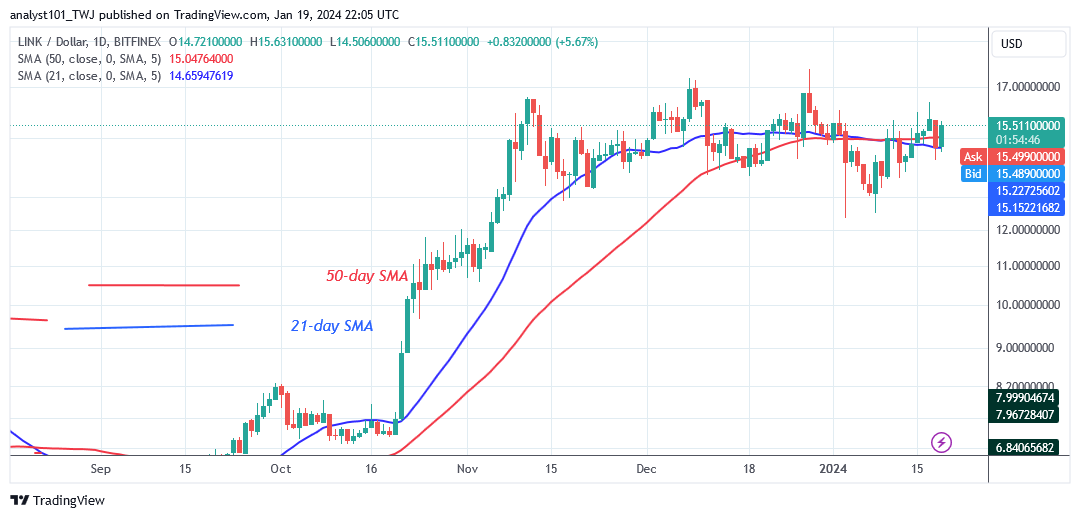
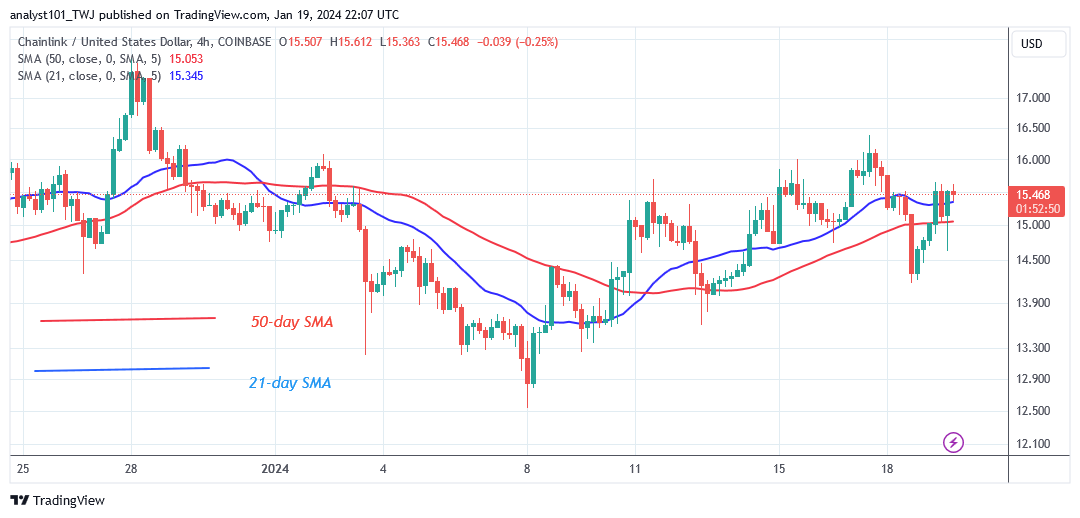
Chainlink (LINK) Long-Term Analysis: Ranging Chainlink’s (LINK) sideways trend continues as it confronts the overhead resistance at $17. Buyers have failed to maintain the price above the $17 high after the uptrend ended on November 11, 2023. On the positive side, Chainlink is trading in an overbought market. Every time the cryptocurrency retests the resistance level above, it will fall below the moving average lines.
Today, LINK//USD is advancing to retest the barrier level of $17. The altcoin is now worth $15.51 at the time of writing. The sideways movement will continue as long as the price bars remain above the moving average lines.
LINK/USD – Daily Chart
Technical indicators: Major Resistance Levels – $8.00, $10.00, $12.00 Major Support Levels – $6.00, $4.00, $2.00
Chainlink (LINK) Indicator Analysis The LINK price is trading in a bullish trend zone, with price bars above the moving average lines. This suggests that the sideways trend will continue in the bullish trend zone. The moving average lines on both charts are horizontal, indicating a sideways trend.
What Is the Next Direction for Chainlink (LINK)? Currently, Chainlink is trading above the moving average lines as it confronts the overhead resistance at $17. This enables buyers to push the coin to retest the overhead resistance at $17. In other words, the coin’s price ranges between $13 and $17. When the range-bound levels are breached, the Chainlink will trend.
Note: Cryptosignals.org is not a financial advisor. Do your research before investing your funds in any financial asset or presented product or event. We are not responsible for your investing result
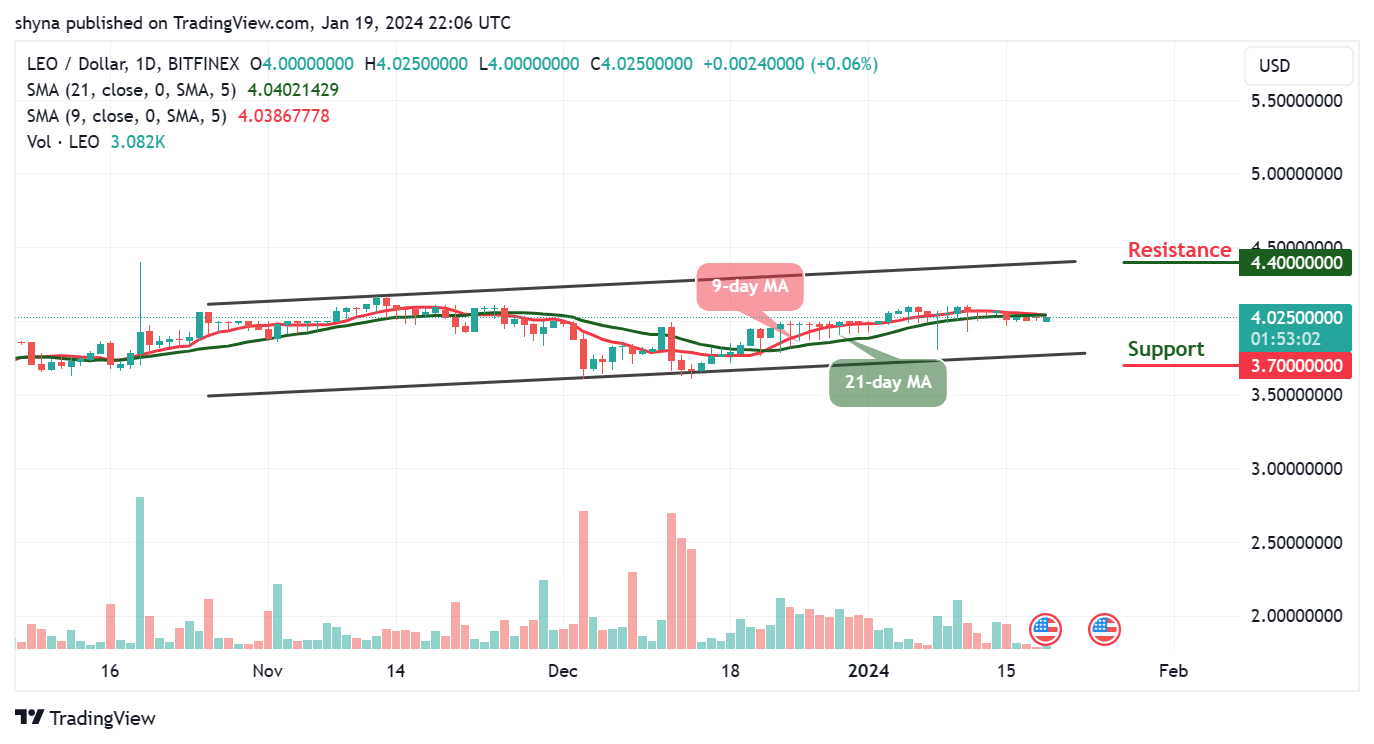
The UNUS SED LEO price prediction reveals that LEO may break out of the current short-term pattern and move towards the $4.30 level.
LEO/USD Long-term Trend: Ranging (Daily Chart)
Key levels:
Resistance Levels: $4.40, $4.50, $4.60
Support Levels: $3.70, $3.60, $3.50
LEOUSD – Daily Chart
LEO/USD is currently trading around $4.02 with a 0.06% gain in the past 24 hours. Looking at the daily chart, the UNUS SED LEO price is struggling to stay above the important level of $4.00. However, for LEO/USD to remain above this level for the past few days, it has made many traders feel that the $3.90 support level could be pretty strong.
UNUS SED LEO Price Prediction: Would LEO Price Break Higher
The UNUS SED LEO price is seen hovering below the 9-day and 21-day moving averages, if the coin breaks below the support level of $3.90, the market price may test another support below the 9-day and 21-day moving averages at the $3.80 level. Alternatively, UNUS SED LEO may touch the resistance level at $4.10 to head upwards. If successful, it could then aim at $4.40, $4.50, and $4.60 resistance levels.
However, the 9-day MA is likely to cross below the 21-day MA, which could bring the sellers back into the market. Moreover, this means that there may still be a room that could be explored by the bears if it crosses below the lower boundary of the channel. Therefore, the critical supports at $3.70, $3.60, and $3.50 may play out.
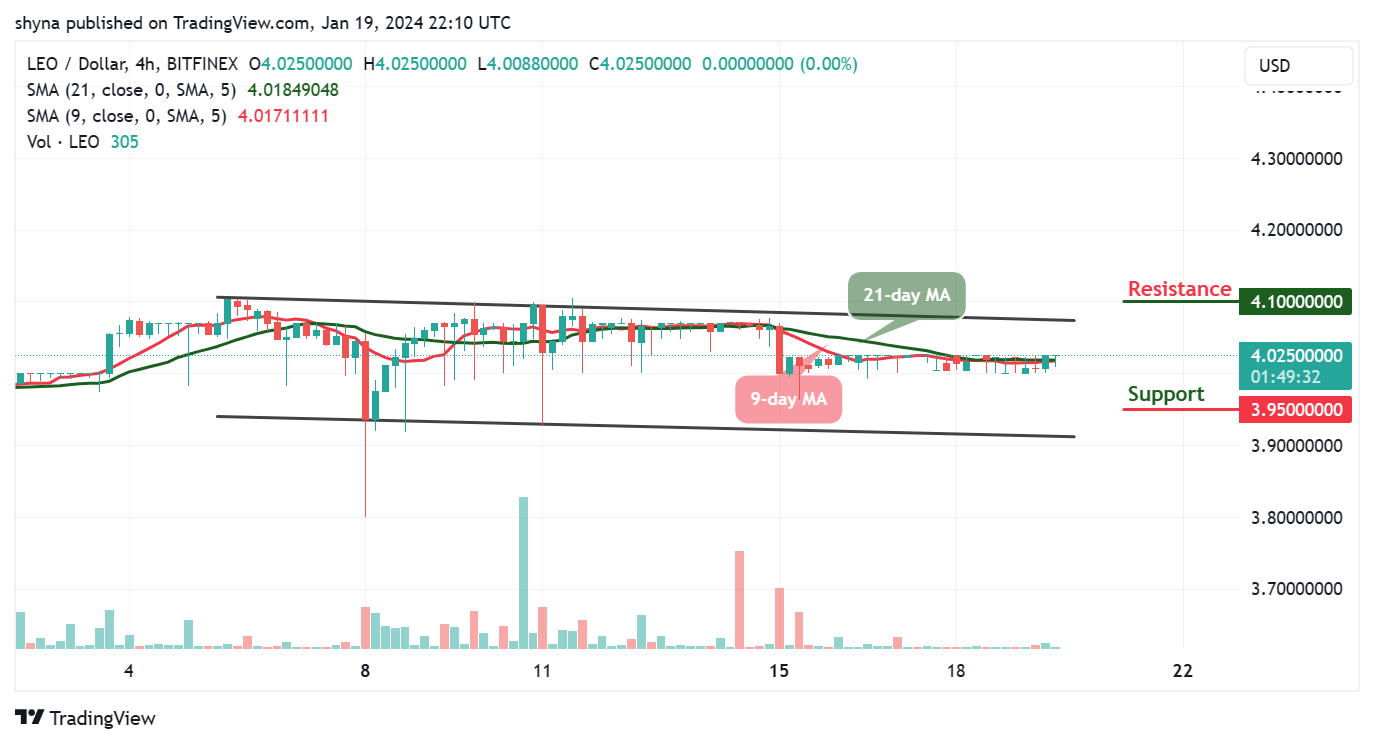
LEO/USD Medium-Term Trend: Ranging (4H Chart)
From a technical point of view, on the 4-hour chart, the 9-day moving average is likely to cross above the 21-day moving average, this may confirm the bullish movement. Meanwhile, adding to the above, there is a little bit of bullish divergence on the chart as the market price may head toward the upper boundary of the channel to continue the bullish movement.
LEOUSD – 4-Hour Chart
However, if the UNUS SED LEO price slides toward the lower boundary of the channel, the market price may likely reach support at $3.95 and below. Meanwhile, if the current market value rises and crosses above the upper boundary of the channel, it may likely reach the resistance at $4.10 and above.
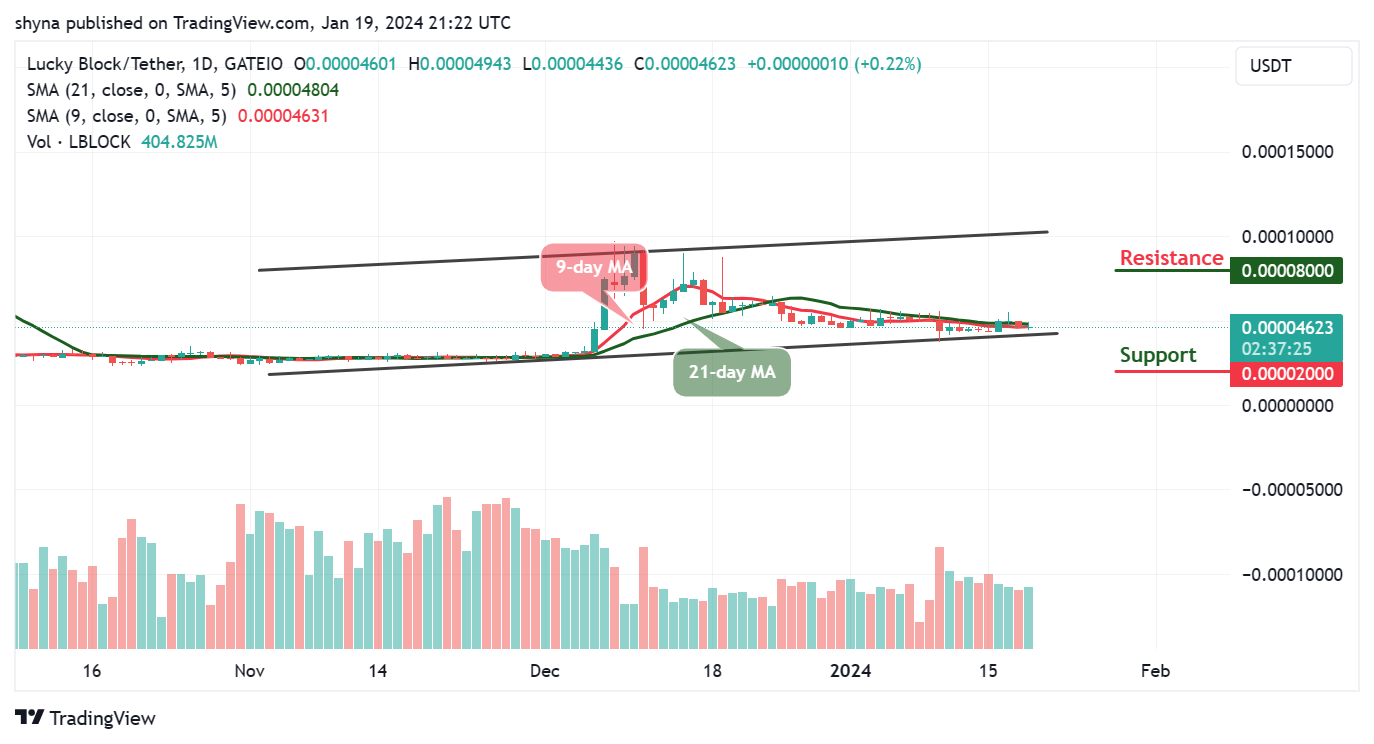
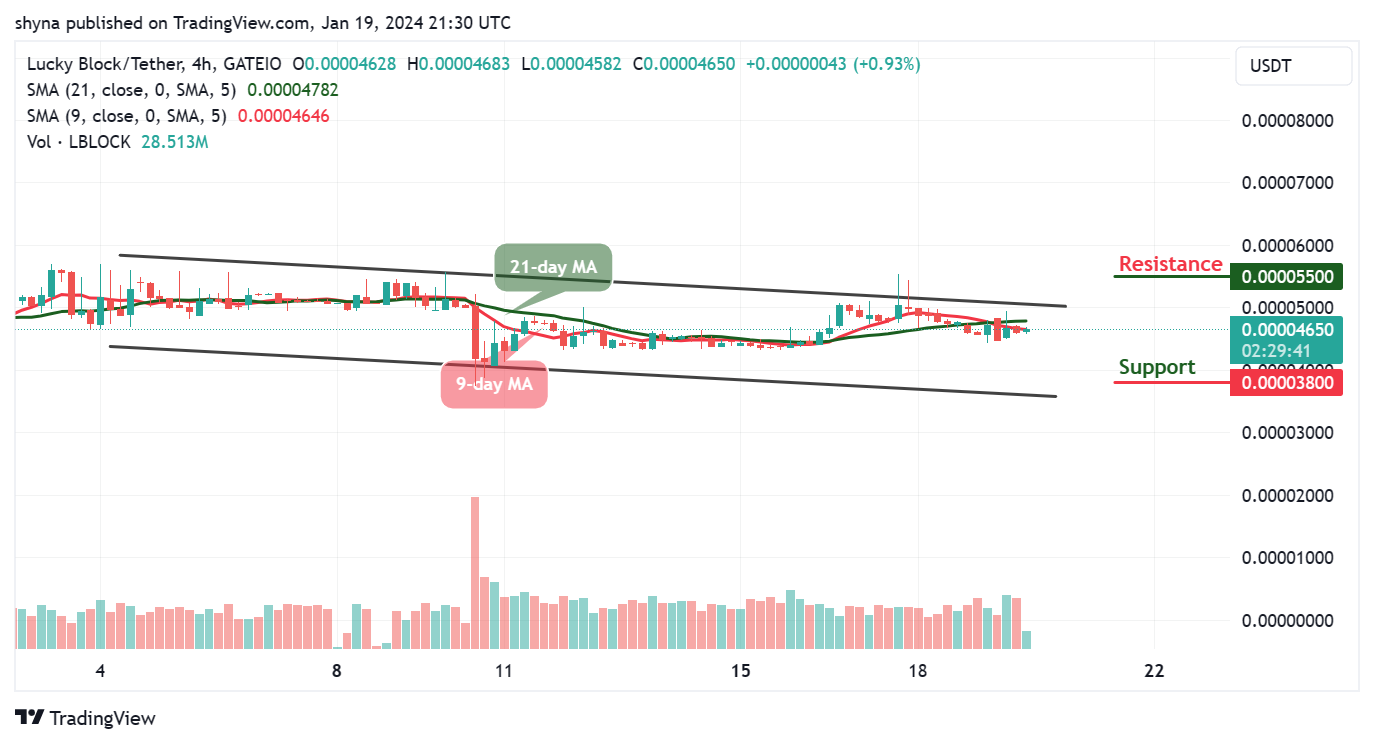
LBLOCK/USD will begin to follow a bullish movement as the coin moves to cross above the 9-day and 21-day moving averages. The current movement is essential for the coin so that it can reach the resistance level of $000050 as new buyers are expected to enter the market. Meanwhile, if the coin slides below the lower boundary of the channel, the support level of $0.000040 could be reached.
Lucky Block Price Prediction: LBLOCK Continues to Range
The Lucky Block price is hovering within the 9-day and 21-day moving averages. If the coin retreats and faces the south, it will be a good opportunity for the existing buyers to buy the dip while the new buyers could invest in the coin. However, if the bears step into the market, any bearish movement may locate the supports at $0.000020, $0.000015, and $0.000010.
Meanwhile, if the buyers hold the current market value and push it to the upside, the bulls can move near the upper boundary of the channel, and any further bullish movement could hit the resistance levels at $0.000080, $0.000085, and $0.000090 respectively.
LBLOCK/USD Medium-term Trend: Ranging (4H Chart)
On the 4-hour chart, the Lucky Block (LBLOCK) trades bullishly as the buyers are preparing to come into the market by crossing above the 9-day and 21-day moving averages. LBLOCK/USD is trading near the resistance level of $0.000050.
LBLOCKUSD – 4-Hour Chart
Nonetheless, the buyers are holding the coin below the moving averages, if the bulls increase the buying pressure and push the coin above the upper boundary of the channel, higher resistance could be located at $0.000055 and above, but any bearish movement could hit the support at $0.000038 and below.
Binance, the world’s largest cryptocurrency exchange, is set to challenge a lawsuit brought forth by the U.S. Securities and Exchange Commission (SEC) on Monday in a Washington court. The SEC, in its June filing, accused Binance and its founder, Changpeng Zhao, of engaging in fraud, market manipulation, and illicit trading of crypto tokens classified as securities.
Binance has vehemently denied these allegations, adamantly asserting that the SEC lacks jurisdiction over cryptocurrency assets and that it has not violated any U.S. laws.
“With regard to digital assets, the SEC has lost its way.”
In today’s @FortuneMagazine op-ed, Norman Reed, Interim CEO of @BinanceUS, highlights the SEC’s flawed approach to regulating digital assets and shares a path forward for the Commission and industry.
The eagerly awaited court hearing, initially scheduled for today but postponed due to snow, is poised to be a heated confrontation between the regulatory body and Binance, both striving to secure the court’s favor.
*SEC V. BINANCE COURT HEARING PUSHED TO MONDAY BECAUSE OF INCLEMENT WEATHER – THE BLOCK PRO
This legal showdown’s outcome holds the potential to establish a precedent for the SEC’s regulatory approach to the burgeoning crypto industry. The industry, which has experienced rapid growth in recent years, faces global scrutiny and uncertainty from regulators worldwide.
Binance Is Not the Only Company to Face the Wrath of the SEC
Binance is not the sole crypto entity in the SEC’s crosshairs; Coinbase, another major exchange, also faces legal action for allegedly offering unregistered securities on its platform.
The SEC, under the leadership of Chair Gary Gensler, has intensified enforcement actions against crypto firms, expressing concerns about investor protection and market transparency in the crypto space.
The regulatory body has urged Congress to enact legislation providing greater authority and clarity over crypto assets, which it contends are predominantly securities subject to federal laws. However, crypto advocates argue against this perspective, asserting that most tokens represent innovative and decentralized forms of money requiring a distinct regulatory framework.
Binance, which operates in over 180 countries, has encountered legal challenges in various jurisdictions.
Last year, the exchange agreed to a $4.3 billion settlement with the U.S. Department of Justice and the Commodity Futures Trading Commission, with founder Changpeng Zhao pleading guilty to money laundering violations.
As the courtroom drama unfolds, the crypto industry watches closely, recognizing the potential ripple effects on its regulatory landscape.
Interested In Learning How To Use Leverage While Trading? Find Out Here
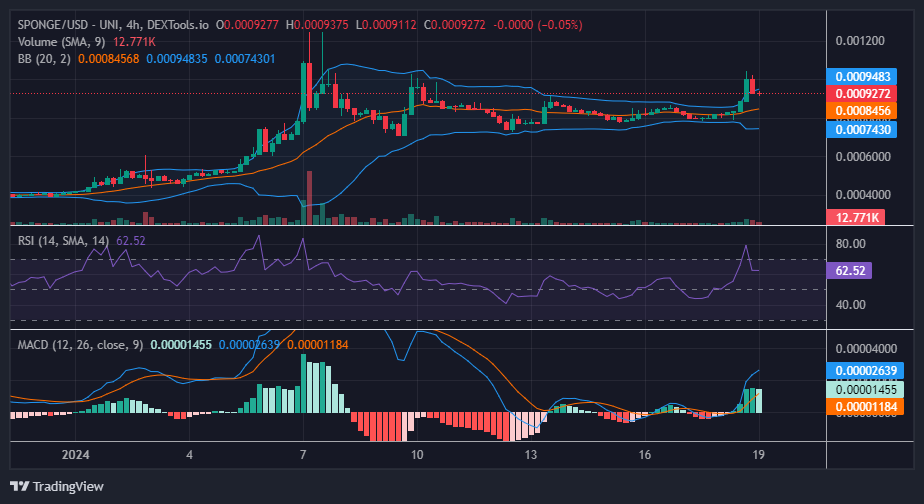
In our recent analysis of the $SPONGE market, we observed convergence between the support and resistance levels, with the price action maintaining a relatively steady state around $0.00082. This created increasing anticipation for a significant price breakout. In today’s session, the market has indeed experienced a breakout in an upward direction. This robust bullish movement has led to an escalation in volatility, strengthening the bearish side of the market.
Key Market Dynamics:
Resistance Levels: $0.0010, $0.0011, and $0.0012.
Support Levels: $0.000450, $0.00040, and $0.00035.
Comprehensive Technical Analysis for $SPONGE (SPONGE/USD):
Upon examining the chart, a sudden surge in the price of $SPONGE is evident, attributed to substantial buying activity that propelled the price beyond the $0.0009 threshold. At this elevated level, indicators indicate an overbought condition in the $SPONGE market, as both the Bollinger Bands and the Relative Strength Index reflect this situation. The robust price surge is now undergoing a corrective phase, characterized by a notable price retracement driven by heightened volatility. Nevertheless, stability seems to be emerging around $0.009272.
From this level, a potential support level may materialize, originating from the $0.0009 price level, thereby aligning the market closer to its target of $0.0012.
Insights from the 1-Hour Perspective:
The increased volatility was particularly prominent when observed in the 1-hour timeframe. The Bollinger Bands exhibit a substantial bandwidth, and interestingly, despite this heightened volatility, both the two standard deviation curves and the 20-day moving average are exhibiting an upward trend, forming an ascending price channel. Upon analyzing the price action, it is evident that bullish intervention occurred around $0.00091, just above the 20-day moving average. This intervention at a higher level has allowed the bullish side to maintain control of the market, successfully steering the trend in their favor.
All it takes to get rewards is staking your $SPONGE!
💸🛌 Earn passive rewards just by staking your $SPONGE! 🤯
Join the #SpongeV2 takeover and enjoy our current APY of 300%+ 😎