Fetch.ai (FET/USD) Primed for a Rebound as It Stabilizes at $0.52 Support Level

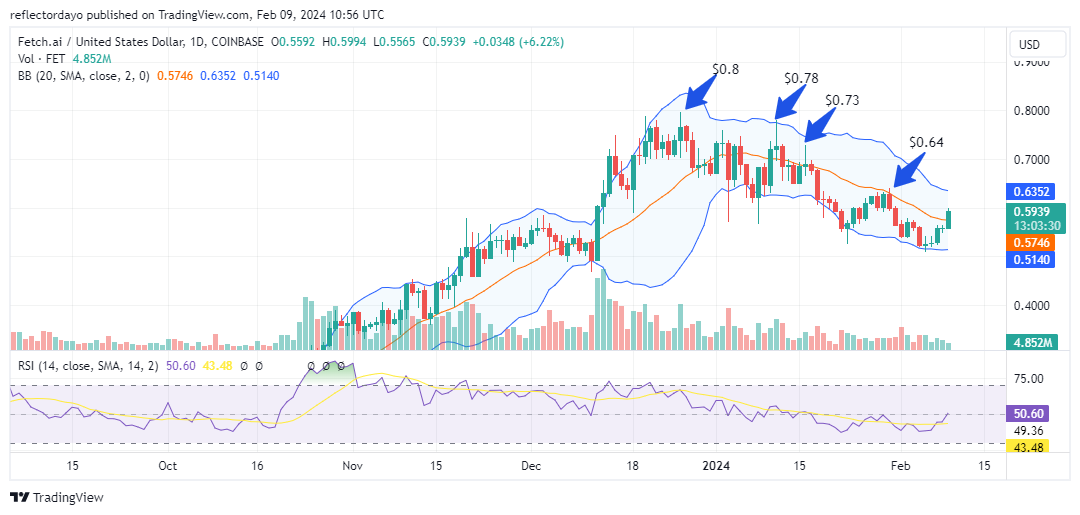
Following its peak at $0.80 on December 26, the Fetch.ai market has entered a bearish trend, characterized by a series of lower highs. Notable instances include $0.78 on January 11, $0.73 on January 14, and $0.64 on January 31. However, around the $0.50 support level, a notable confrontation between supply and demand ensued, culminating in a swift bullish breakout.

Fetch.ai Market Data

  • FET/USD Price Now: $0.59
  • FET/USD Market Cap: $48 million
  • FET/USD Circulating Supply: 831 million FET
  • FET/USD Total Supply: 1.2 billion FET
  • FET/USD CoinMarketCap Ranking: #112

Fetch.ai (FET/USD) Primed for a Rebound as It Stabilizes at $0.52 Support Level

Key Levels

  • Resistance: $0.60, $0.63, and $0.70.
  • Support: $0.52, $0.50, and $0.45.

The Fetch.ai Market Analysis: The Indicators’ Point of View

Upon analyzing the chart, we observed a diminishing bullish momentum coinciding with the formation of new lower highs in the market. At the $0.60 price level, there was a noticeable decrease in overall trading volume, indicating a waning interest from both bullish and bearish traders. The crypto signal from the analysis suggests a decline in investor engagement. However, as the market approached the $0.50 price level, buying interest emerged among traders. Consequently, bullish sentiment prevailed, triggering a significant price rally.

Currently, attention is focused on overcoming the $0.600 resistance level, which may pose a challenge given the relatively modest height of the volume histograms according to the volume indicator.

Fetch.ai (FET/USD) Primed for a Rebound as It Stabilizes at $0.52 Support Level

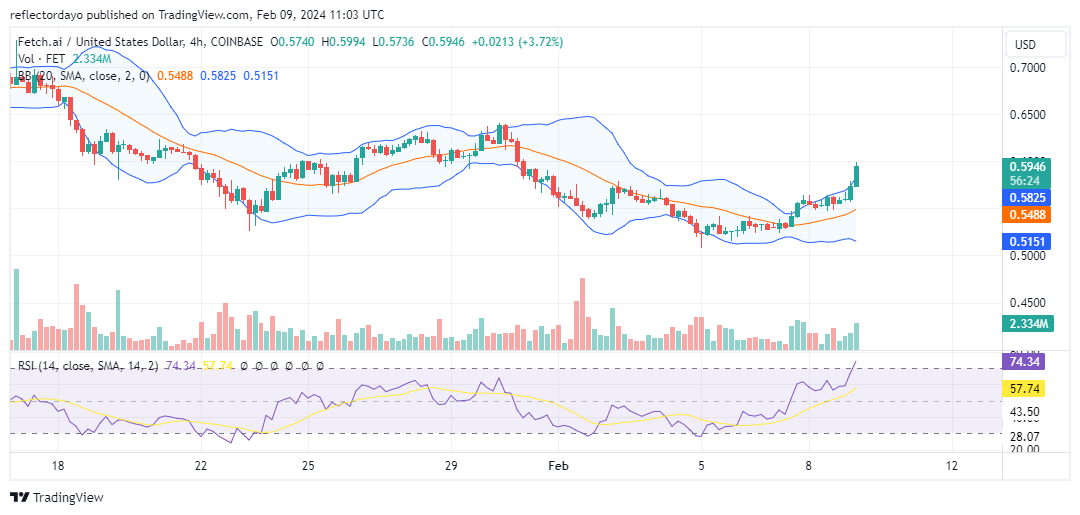
FET/USD 4-Hour Chart Outlook

Upon examining a smaller timeframe, the volume of trade histogram appears noteworthy, aligning with the current bullish market sentiment. Nonetheless, we observed the presence of bearish sentiment indicated by an upper shadow on the bullish candlestick at the $0.600 price level. Should bulls fail to secure a breakout beyond this point, a potential scenario could involve price consolidation near the $0.600 level to establish a robust foundation for overcoming bearish resistance.

Trade crypto coins on BYBIT!

Ethereum Rebounds As It Regains The $2,400 Support Level

Ethereum Price Long-Term Analysis: Bullish
Ethereum’s (ETH) price has resumed positive momentum as it regains the $2,400 support level. Since the January 23 price drop, Ethereum has traded in a bearish trend zone. On February 6, 2024, the altcoin rallied to a peak of $2,464. Buyers have kept the price above the moving average lines, but have failed to maintain the positive momentum above the $2,400 level.

If the current resistance level is breached, the largest altcoin will rally to its prior highs of $2,600 and $2,715. However, Ether will continue to trade in a range above the moving average lines but below the resistance at $2,500, where buyers failed to maintain the positive momentum to the previous highs. Ether is trading at $2,447 at the time of writing.

Ethereum Rebounds As It Regains The $2,400 Support Level
ETH/USD – Daily Chart

Technical indicators:
Major Resistance Levels – $2, 600, $2,800, $3,000
Major Support Levels – $1.600, $1, 400, $1,200

Ethereum Indicator Analysis
Following the price rebound on February 6, Ether’s price bars are now above the moving average lines. The altcoin has begun an upward movement in the positive trend zone. On the 4-hour chart, the moving average lines are sloping upward, with a bullish crossover. The cryptocurrency is still rising, but it meets an initial obstacle near the recent high.

Conclusion
The largest altcoin is resuming its bullish ascent as it regains the $2,400 support level. Ether has risen and is currently trading at $2,450, below the recent barrier. The crypto signal is likely to continue strong as the price retests the recent high, indicating a continuing upward trend. For the previous 48 hours, the altcoin has been trading above $2,400 and its latest high.

Ethereum Rebounds As It Regains The $2,400 Support Level
ETH/USD – 4 Hour Chart


You can buy crypto coins here. Buy LBLOCK

Note: Cryptosignals.org is not a financial advisor. Do your research before investing your funds in any financial asset or presented product or event. We are not responsible for your investing results

Dash 2 Trade Price Prediction for Today, February 9: D2TUSD Potential for a Bullish Run-off

Dash 2 Trade Price Forecast: D2TUSD Potential for a Bullish Run-off (February 9)
D2TUSD has the potential for a bullish run-off as the coin trades above the supply trend levels. The nearest resistance of the crypto is between levels $0.00619 to $0.00626, whereas the most immediate resistance is found around $0.00626. There is a higher probability of a price-breaking resistance zone if the buy traders can double their efforts. This could compel traders to start buying Dash 2 Trade speculating a price increase above the $0.01000 level. Thus a clear buy crypto signal and robust gain for the coin buyers.

Key Levels:
Resistance levels: $0.00700, $0.00800, $0.00900
Support levels: $0.00500, $0.00400, $0.00300

D2T (USD) Long-term Trend: Bullish (4H)
Dash 2 Trade is in a bullish trend market in its long-term view. The coin is trading above the two EMAs. However, the market is presently facing resistance at the recent high.
Dash 2 Trade Price Prediction for Today, February 9: D2TUSD Potential for a Bullish Run-off
The bulls are set to take over and push us higher. There are multiple possible targets at this point, but either way, the pair looks quite bullish here.

The bulls have sustained the crypto market at the $0.00610 supply value in the previous action; this has made it possible for the coin to stay above the trend line in its recent high.

The bulls’ action increases the price of Dash 2 Trade up to the $0.00626 resistance level even as the 4-hour session opens today. A strong break above the $0.00727 high point would intensify the buying pressure on the crypto.

Next, is the fact that the market is pointing upwards on the daily stochastic, this will draw more buy traders to the market for a bullish continuation pattern, if that occurs the price could further climb toward a $0.01000 upper high level and this will add to the bullish race in the future in its long-term outlook.

D2T (USD) Medium-term Trend: Bullish (1H)
In the medium-term time frame, the price of D2TUSD is above the supply trend lines, indicating an uptrend. However, staying above the supply mark will give the coin buyers the tendency to influence the price actions by continuing with the bullish run-off.
Dash 2 Trade Price Prediction for Today, February 9: D2TUSD Potential for a Bullish Run-off
The bullish pressure on the crypto in the past few hours has sustained the coin price above the supply trend lines in its recent high.

Dash 2 Trade prices at the $0.00626 high level can be seen above the two moving averages; this shows that the bulls are buying the token at this level.

Therefore, if the bulls increase their tension in the market, the price tendency will rise above the key levels at $0.00715, which would be the most robust confirmation of the anticipated rally.

In addition, to move the crypto price further up, more buyers’ participation is a prerequisite at the moment. We expect the price to test the $0.01000 upper resistance value amid sustained buying pressure in the coming days in its medium time frame.

Want a coin that has a huge potential for massive returns? That coin is Dash 2 Trade. Buy D2T now.

Bitcoin Miners HODL as Price Surges Above $45,000

Bitcoin surged past the $45,000 milestone on Thursday, marking its highest point in a month. This upswing coincides with recent data indicating that Bitcoin miners are holding onto their coins, alleviating some of the selling pressure on the market.

According to insights from CryptoQuant, a platform specializing in tracking on-chain data, major U.S. publicly traded Bitcoin mining companies have steadily increased their Bitcoin holdings in recent months. Notably, Marathon Digital, among the largest bitcoin miners in the U.S., has amassed over 8,000 bitcoins since October 2023.

Bitcoin Miners HODL as Price Surges Above $45,000
Image via The Block (CryptoQuant)

Furthermore, CryptoQuant’s analysis reveals a significant decline in daily sales by miners, plummeting from over 800 bitcoins between November and December 2023 to below 300 bitcoins thus far in 2024. This suggests a growing confidence among miners in Bitcoin’s enduring value, leading them to refrain from immediate liquidation of their rewards.

One contributing factor to miners’ retention of coins is the dwindling profits from Bitcoin network fees.

Analysts at CryptoQuant note a staggering 90% reduction in fees from their peak in December, attributed to decreased network activity. Daily transactions on the Bitcoin network have plummeted from an all-time high of 731,000 in late December to a three-month low of 278,000 presently.

Crypto Liquidations Pushing Bitcoin Higher

The surge in Bitcoin’s price isn’t solely attributable to reduced selling pressure from miners. The market has also witnessed a notable increase in liquidations of leveraged cryptocurrency positions due to heightened price volatility, resulting in margin calls and forced closures.

Coinglass, a platform specializing in monitoring liquidations, showed liquidations exceeding $121 million in leveraged positions across the market on Thursday, with over $48 million stemming from BTC shorts alone.

Bitcoin Miners HODL as Price Surges Above $45,000
Image via Coinglass

The convergence of bullish sentiment, diminished supply, and heightened demand have propelled Bitcoin’s price above the $45,000 resistance level, precisely reaching $45,507, paving the way for further upward momentum.

Bitcoin Miners HODL as Price Surges Above $45,000
BTC/USD Daily Chart

For those interested in trading Bitcoin and other cryptocurrencies, access to reliable and timely crypto signals is crucial. Join us today to access this.


Want to learn about the best crypto staking platforms? Click here

Tamadoge (TAMA/USD) Price Rally Anticipated as Investors Gather Around $0.00045 Level

The Tamadoge market has remained relatively stagnant, maintaining a sideways trajectory around the $0.00045 price level for some time. However, recent developments suggest a potential upward price surge. There is a noticeable influx of traders on both sides of the market, indicating increased activity among both bulls and bears. As a result, the market forces are now more evenly balanced, potentially setting the stage for significant movement.

Key Levels

  • Resistance: $0.013, $0.014, and $0.015.
  • Support: $0.0045, $0.0040, and $0.0035.

Tamadoge (TAMA/USD) Price Rally Anticipated as Investors Gather Around $0.00045 Level

TAMA/USD Price Analysis: The Indicators’ Point of View

The Bollinger Bands indicator depicts a volatility squeeze marked by the convergence of its bands into a narrower bandwidth, reflecting a tightening price channel as bullish and bearish forces reach parity. Concurrently, the volume of trade indicator shows a surge in investor interest, evident in the substantial increase in histograms. Despite this heightened activity, the price action remains confined within an eastward-bound price channel movement, indicating a state of indecision in the market.

While the observation of this crypto signal holds true, the fact that the Tamadoge price action is consolidating around the $0.00045 price level suggests an imminent bounce. Historically, this level has consistently repelled bearish advances since January 26th, reinforcing its significance in market dynamics.

Tamadoge (TAMA/USD) Price Rally Anticipated as Investors Gather Around $0.00045 Level

Tamadoge Short-Term Outlook: 1-Hour Chart

In fact, based on the 1-hour chart analysis, the Tamadoge market has shown a subtle upward trend. While this movement has been minimal and somewhat imperceptible, it signifies a gradual increase in bullish momentum. Despite the ongoing consolidation within a narrow price channel, there are indications of a slight shift favoring the bulls. Investors should be prepared to capitalize on buying opportunities at this price level to maximize potential profits.

TAMA will stop accepting deposits and withdrawals on February 7 at 2:00 am UTC.

Do you want a coin that will be 100 times more valuable in the next few months? That is Tamadoge. Buy TAMA today!

Solana (SOL/USD) Seeks Stability Above the $100 Price Level

In a remarkable turn of events during the previous daily trading session, Solana bulls gathered significant momentum and surpassed the $100 price level. In today’s trading session, bullish activity continues to prevail. Currently, the focus is on maintaining stability above the crucial $100 mark. Despite encountering notable bearish resistance at this level, the initial step for the bulls to overcome this resistance is to establish stability near it, which appears to be the current strategy of the market.

Solana Market Data

  • SOL/USD Price Now: $102.25
  • SOL/USD Market Cap: $44 billion
  • SOL/USD Circulating Supply: 436 million
  • SOL/USD Total Supply: 569 million
  • SOL/USD CoinMarketCap Ranking: #5

Solana (SOL/USD) Seeks Stability Above the $100 Price Level

Key Levels

  • Resistance: $105, $110, and $115.
  • Support: $94, $90, and $83.

The Solana Market Analysis: The Indicators’ Point of View

Yesterday’s impressive bull run extended into today’s trading session, providing the bulls with ample momentum to strive for a solid position above the $100 price threshold. This endeavor is anticipated to intensify pressure on the $101 resistance level, despite the prevailing strong bearish sentiment at this juncture. The Solana market’s performance on January 30 underscores the robust bearish sentiment surrounding these price zones, as evidenced by the prevalent inverted hammer pattern throughout that trading day. Currently, the prevailing signal from crypto indicators suggests a consolidation trend, notwithstanding the indication of high market volatility signaled by the considerable bandwidth of the Bollinger Bands.

Solana (SOL/USD) Seeks Stability Above the $100 Price Level

SOL/USD 4-Hour Chart Outlook

Based on the 4-hour chart analysis, we observe a newly formed support level near the resistance point, approximately at $100.8. Despite the prevailing bearish sentiment surrounding this resistance level, which has somewhat curtailed the bull market’s momentum in recent trading sessions, maintaining a strong foothold at this level could potentially pave the way for a breakthrough. Should the bulls manage to sustain control, there is a possibility that the resistance barrier may soon yield to the bullish momentum, potentially leading the market to revisit its previous highs.

Trade crypto coins on BYBIT!

Uniswap (UNI/USD) Trade Slants Northward, Facing Barriers

Uniswap Price Prediction – February 8

A chain of up-rising gravitational forces has been in place as the Uniswap trade slants northward across points from around $5.50 to now bargain around $6.35 or thereabouts, facing barriers around the axis of the upper Bollinger Band.

Crypto trade staking processes would be patiently executed at this moment, given the rate at which the price is now increasing. On a sustained positive consolidation move, however, a sharp rebounding velocity will provide the majority of the succeeding price movements. The size of investors’ portfolios will increase during that outpouring of assumptions.

UNI/USD Market
Key Levels:
Resistance levels: $7, $7.50, $8
Support levels: $5.50, $5, $4.50

UNI/USD – Daily Chart
The UNI/USD daily chart reveals that the crypto-economic trade slants northward to bargain around the upper Bollinger Band, facing barriers.

The stochastic oscillators have had their blue part stretched into the overbought region to signify that powerful forces to back further moves could soon be turning in the opposite direction. The Bollinger Band trend lines are placed strategically around the points of $6.50 and $5.50. A fearful emergence of a bullish candlestick against the higher point will potentially breakout at the key resistance point of $7.
Uniswap (UNI/USD) Trade Slants Northward, Facing Barriers

Technically speaking, will it be best to jump on board any upward move in the UNI/USD market at the upper Bollinger Band trend line?

For long-position pushers to drive alongside any sudden rebound, any moment from now may lead to more positive upswings as the UNI/USD trade slants northward, facing barriers around the zone of the upper Bollinger Band.

Trade movers in long positions will need to adopt the technique of using a false downward move to relaunch a longing order in that direction if they want to stay relevantly positive on the current pattern. Buyers will need to exercise patience while establishing a new position in the process of discovering items that deviate from that projection.

Since the market has been technically inclining toward a possible decline, a timely selling entry may soon come through. Shorting entries can be timely obtained, while a 1-hour chart complements a 4-hour chart whenever they are positioned at higher levels afterward.
Uniswap (UNI/USD) Trade Slants Northward, Facing Barriers
UNI/BTC Price Analysis
In contrast, the Uniswap trade has been trying to hold positions against the worth of Bitcoin, facing barriers around the middle Bollinger Band.

The stochastic oscillators have been striving to shift the blue part upward near the line of 80. The Bollinger Band signs continue to build in a way that indicates certain downward forces have not yet fully ended. However, the basic cryptocurrency tends to resist significant attacks from the countering instrument.
\
Note: Cryptosignals.org is not a financial advisor. Do your research before investing your funds in any financial asset or presented product or event. We are not responsible for your investing results.


You can purchase Lucky Block here. Buy LBLOCK

$SPONGE (SPONGE/USD) Poised for a Resurgence – Seizing Opportunity at $0.000035

The current market conditions of SPONGE/USD suggest the potential for a significant rebound, with the price hovering around $0.000035. This presents an opportune moment for investors to strategically assess their positions as the market shows signs of potential resurgence. The fact that the market has reached $0.000035 implies a notable milestone, as it mirrors the starting point of $SPONGE’s value last year. This suggests a possible shift in market sentiment towards the upside, warranting consideration for investment opportunities. Consequently, investors may find it advantageous to capitalize on this dip to optimize their returns, given the potential for substantial gains.

Key Market Dynamics:

  • Resistance Levels: $0.0010, $0.0011, and $0.0012.
  • Support Levels: $0.00040, $0.00035, and $0.00030.

 $SPONGE (SPONGE/USD) Poised for a Resurgence – Seizing Opportunity at $0.000035

In-Depth Technical Analysis for $SPONGE (SPONGE/USD)

The Relative Strength Index (RSI) has continued to present a crypto signal that have persisted below the 30 level for some time now, indicating prolonged bearish sentiment in the market. However, there have been slight upward shifts in recent times as bulls gradually gather momentum. This suggests a potential reversal in the oversold conditions of the SPONGE/USD pair, with a probable upward movement in price levels. Particularly noteworthy is the $0.000035 price level, which has emerged as a crucial support zone in the market. Additionally, the Moving Average Convergence and Divergence (MACD) indicator is displaying indications of a bullish shift. Previously negative histograms have transitioned to faded red with diminishing height, and a subsequent transition into a green histogram signals the accumulation of bullish momentum.

 $SPONGE (SPONGE/USD) Poised for a Resurgence – Seizing Opportunity at $0.000035

Insights from the 1-Hour Perspective:

Upon analyzing the smaller timeframe, it becomes evident that the narrow price channel has persisted, merging with the flat price action. This prolonged period of stagnation in the market could signify a buildup of bullish momentum, hinting at an imminent transition towards a bullish market sentiment. This observation is supported by the Bollinger Bands, which illustrate a narrow price channel indicative of consolidating price action. Given these observed patterns, anticipating a significant price movement in the upcoming trading sessions is reasonable.

Another factor contributing to the potential bullish surge in the market is the transition of the SPONGE/USD market from the Ethereum chain to the Polygon chain. This shift explains the recent sharp decline in price, dropping to the market’s initial price of $0.000035. Consequently, as the SPONGE market becomes fully established on Polygon, the price is likely to experience a substantial increase. Therefore, purchasing now could yield significant gains in the future.

The formal discontinuation of $SPONGE V1 has occurred, and V2 has been released on Polygon!

Invest in the hottest and best meme coin. Buy Sponge ($SPONGE) today!

Dash 2 Trade Price Predictions for Today, February 8: D2TUSD Price Retracement Will Surge Higher

Dash 2 Trade Price Forecast: D2TUSD Price Retracement Will Surge Higher (February 8)
D2TUSD is facing a new correction to resume its upward rally and the price retracement will most likely surge higher. The coin now sends a clear bullish crypto signal trading above the EMAs. Amid the selling pressure the coin gave a bullish breakout from the $0.00601, suggesting the buyers are making a recovery attempt. Thus, if the crypto’s price sustains above the $0.00727 high level, the potential rally could propel the crypto price toward the $0.01000 upper resistance level and beyond.

Key Levels:
Resistance levels: $0.00700, $0.00800, $0.00900
Support levels: $0.00500, $0.00400, $0.00300

D2T (USD) Long-term Trend: Bullish (4H Chart)
Dash 2 Trade rebounded after its massive drop. The momentum on the higher timeframe (4H) is bullish. This is clear as we can see the prices trading above the moving average lines indicating an uptrend. So it seems likely that the bulls are determined to take over and push us higher.
Dash 2 Trade Price Predictions for Today, February 8: D2TUSD Price Retracement Will Surge Higher
The bullish pressure at the $0.00600 supply level in the past few hours has made the coin remain above the supply trend levels in its recent high.

After completing the low-dips by the sell traders at the $0.00597 low value, the bulls moved the D2TUSD price up to a $0.00601 high level above the supply levels as a pullback as the 4-hour chart resumes today. This is a result of more concerns from the buy investors.

Thus, a possible breakout from the mentioned supply will accelerate the buying momentum and push the prices of Dash 2 Trade higher to hit the previous high at $0.00727 level, bolstering buyers for a sustainable rally.

Additionally, as a result of an upward momentum shown by the price indicator, the bullish race might touch the $0.01000 resistance level sooner in its long-term outlook.

D2T (USD) Medium-term Trend: Bullish (1H Chart)
Despite the interference of short-term traders in the price flow, the 1-hour chart market of D2TUSD shows a bullish race. The coin buyers are making several attempts to bounce off the support to gain more strength.
Dash 2 Trade Price Predictions for Today, February 8: D2TUSD Price Retracement Will Surge Higher
The price of Dash 2 Trade can now be seen progressing upward above the moving averages. This shows that buyers are currently gaining more strength in the market.

In the previous session, the coin price was ranging above the two EMAs which were glued together, but additional buying pressure pushed the price above the critical level from the $0.00597 value to the $0.00610 resistance level above the moving averages.

This will however give the buy traders the tendency to further ladder up the trend. To push the price above the supply zone more buyers’ participation is a prerequisite.

Notably, with buyers clustering around the market now means that the D2TUSD’s price will still go up further. Therefore we can expect the upward rally to reach the $0.01000 trend line soon in its medium-term outlook.

Want a coin that has a huge potential for massive returns? That coin is Dash 2 Trade. Buy D2T now.