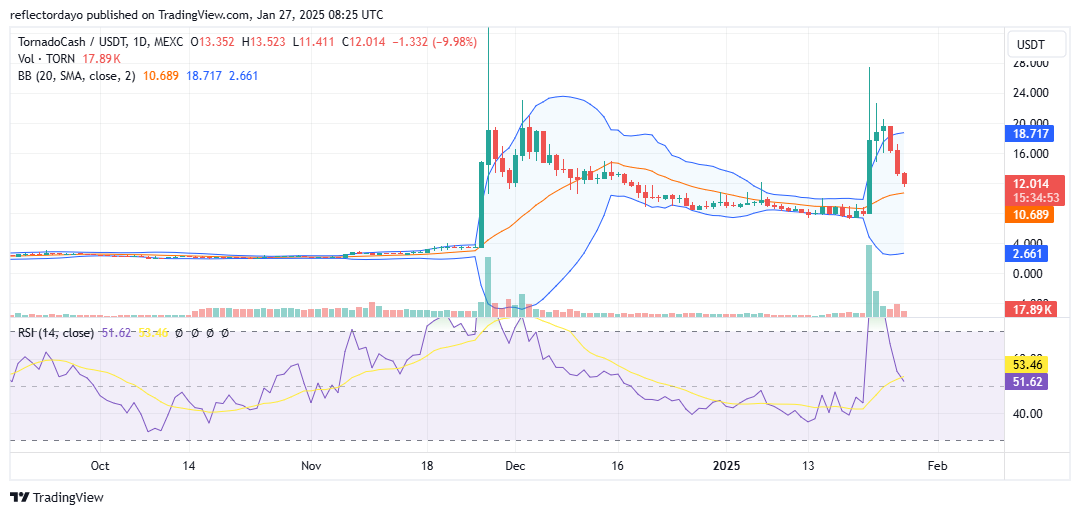
Prior to the recent surge in Tornado Cash market activity, the asset had experienced a prolonged period of stagnation, trading consistently around the $1.00 mark. This state of market inactivity persisted throughout much of 2024.
The current market excitement was ignited by the emergence of a Marubozu candlestick pattern in late November. This pattern, characterized by a large body spanning multiple price levels, signaled a significant price breakout. The initial bullish move following this pattern propelled Tornado Cash to a high of $14. However, this initial surge appears to have been driven by a relatively small volume of investors, as evidenced by the limited volume bar associated with the trading session in late November. Nevertheless, this pronounced market movement marked the beginning of the current period of heightened market activity.
Tornado Cash Market Data
- TORN/USD Price Now: $12.075
- TORN/USD Market Cap: $62.4 million
- TORN/USD Circulating Supply: 5.25 million TORN
- TORN/USD Total Supply: 9.9 million TORN
- TORN/USD CoinMarketCap Ranking: #555
Key Levels
- Resistance: $16, $20, and $24
- Support: $10, $9, and $8.
Tornado Cash Market Through the Lens of Indicators
On November 28th, following the emergence of the initial strong candlestick, trading volume witnessed a dramatic increase. However, this surge in trading activity primarily resulted in heightened volatility, characterized by periods of significant buying and selling pressure. The Tornado Cash market experienced extreme price swings on that day, rapidly ascending to a high of $40, which subsequently triggered a wave of profit-taking, leading to a sharp price decline.
Following this period of intense market activity in the crypto signal, the price consolidated within a range between $16 and $20. Initially, expectations were for a bullish rebound from this range. However, as the struggle between buyers and sellers continued, bearish sentiment gradually gained dominance, causing a gradual price decline to around $8.
At this level, buyers demonstrated renewed strength, and a significant price surge ensued. However, this time, the price failed to reach the previous high, peaking at $28. Currently, the market is experiencing a further decline. Given the high volatility associated with the preceding bullish moves, significant corrections are to be expected.
Within the ongoing correction, a potential area of bullish interest can be observed around the $12 price level. A break below this support level could potentially lead to a retest of the $8 level. However, most traders are likely to prefer entering bullish positions at higher price levels.
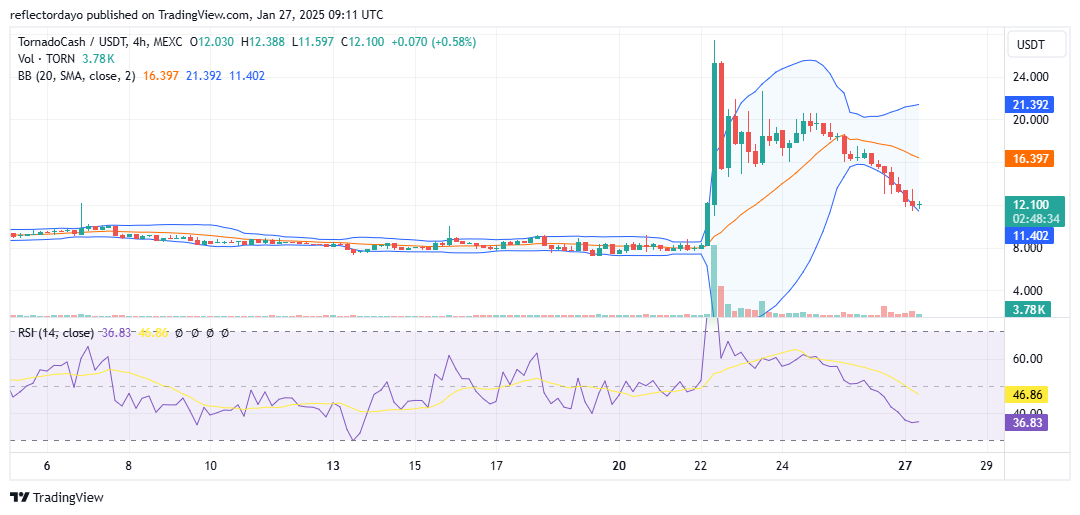
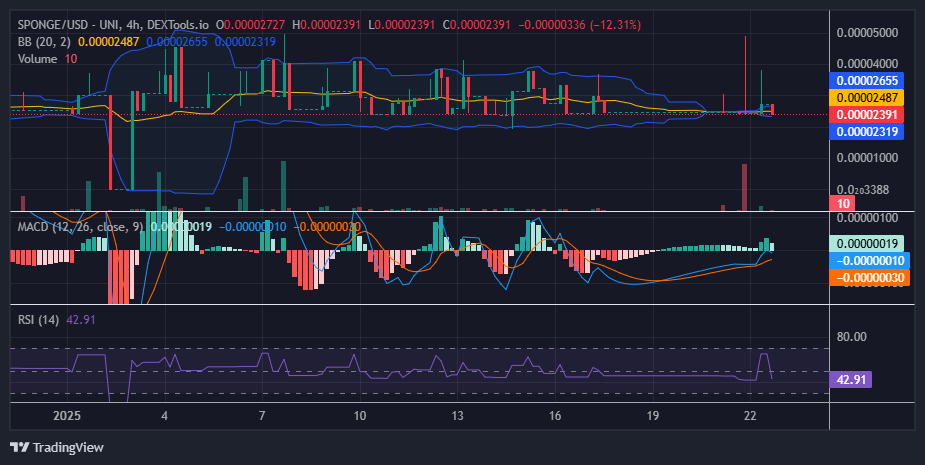
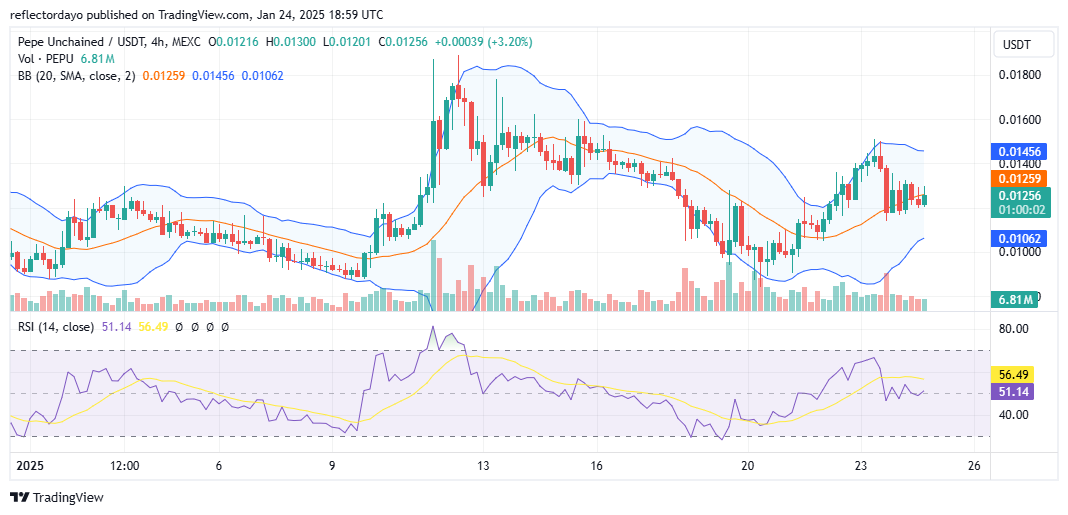
TORN/USD Price Prediction: 4-Hour Chart Analysis
While significant price volatility is expected within this volatile market environment, it is reasonable to anticipate a resurgence of bullish sentiment at a higher support level compared to the previous support level of $8. In this instance, the higher support level is situated at $12.
Over the past three trading sessions, bullish sentiment has been evident around the $12 level, consistently rejecting downward price pressure. Although the market has demonstrated resilience and strength, it remains under significant bearish influence.
A potential scenario is the market entering a consolidation phase around the $12 level. This consolidation period could effectively diminish bearish momentum and potentially pave the way for the next market direction.
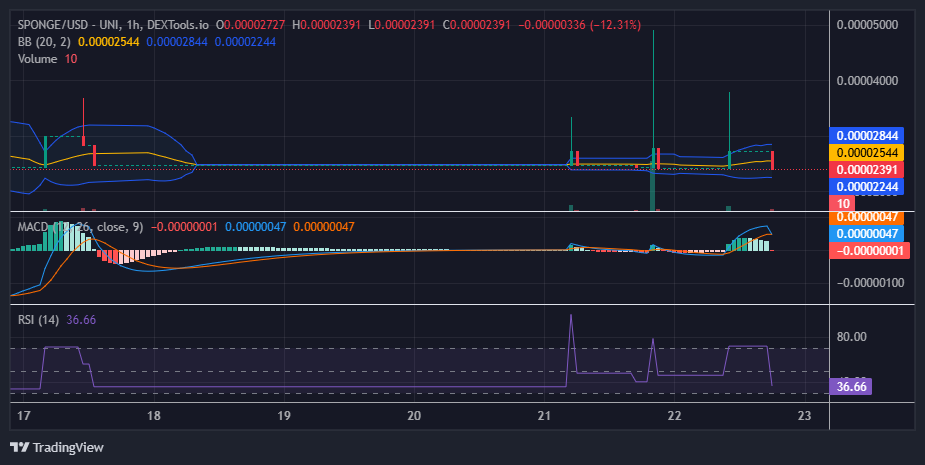
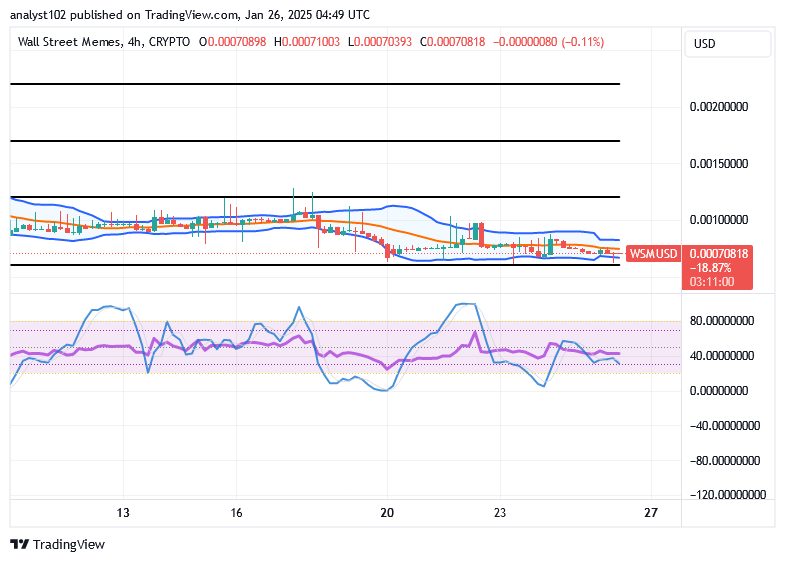
 The bearish pressure at the $0.0012 low mark in the last trading session has sustained the token’s bearish momentum in its recent low. Nevertheless, the Scotty Ai bulls are preparing for a new bullish pattern as the selling pressure will soon be exhausted.
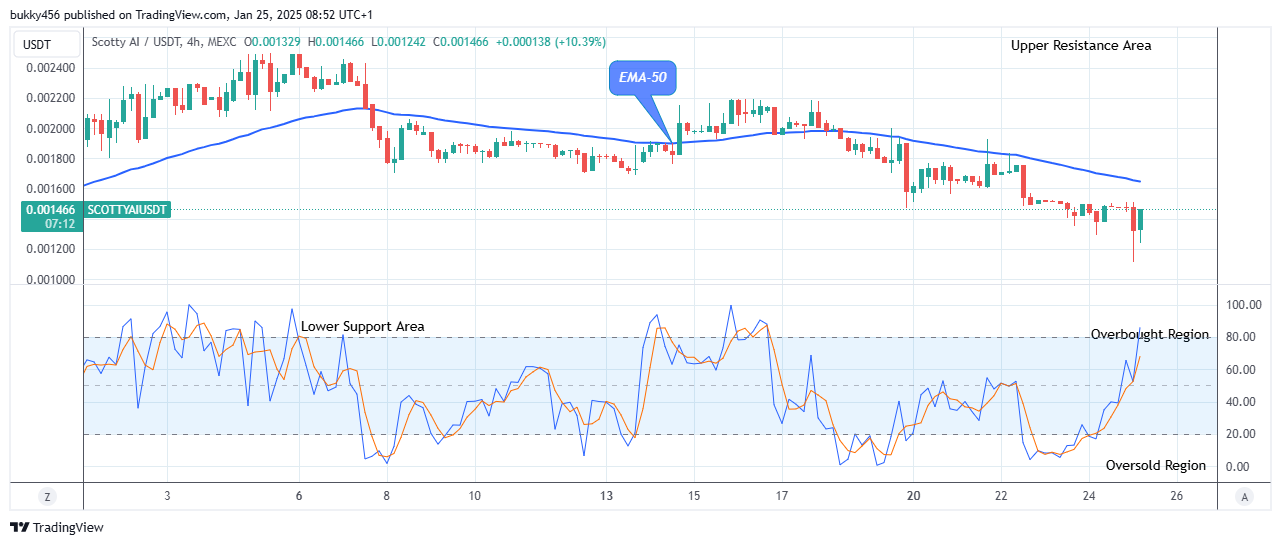 The sustained bearish pressure at a $0.0011 support value in the last action has made the token price trade below the supply trend levels in its recent high.
 The price bars can be seen below the moving averages, due to the high inflow from the sell traders. However, there is about to be a turnaround for the D2TUSD buy traders.
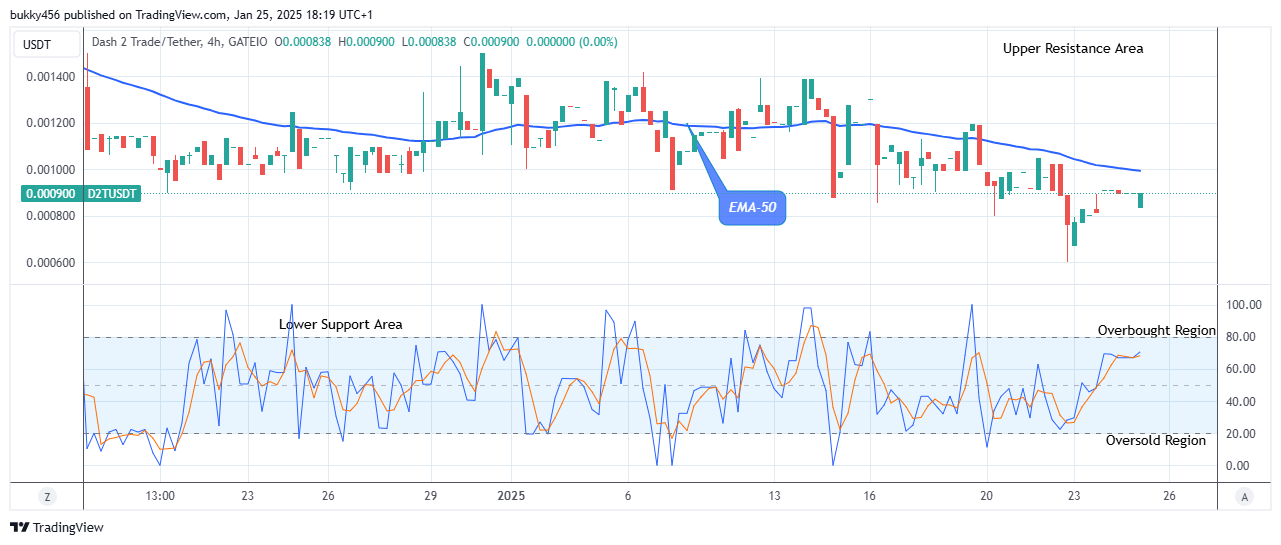 A rise to a $0.000900 high level by the bulls shortly after the 4-hourly chart opens today affirms the returns of the long traders into the market.