Top Trending Coins for Today, January 26: TRUMP, LTC, STP, JUP and VINE

The altcoin market is once again demonstrating its characteristic volatility, with prices swinging wildly. This week, we’re spotlighting a selection of cryptocurrencies that have experienced significant price surges within the past 24 hours. These coins have captured the attention of investors and traders alike, highlighting the dynamic and often unpredictable nature of the altcoin landscape. Let’s delve into the specifics of each coin and explore the factors contributing to their recent price movements.

OFFICIAL TRUMP (TRUMP)

Major Bias: Bullish

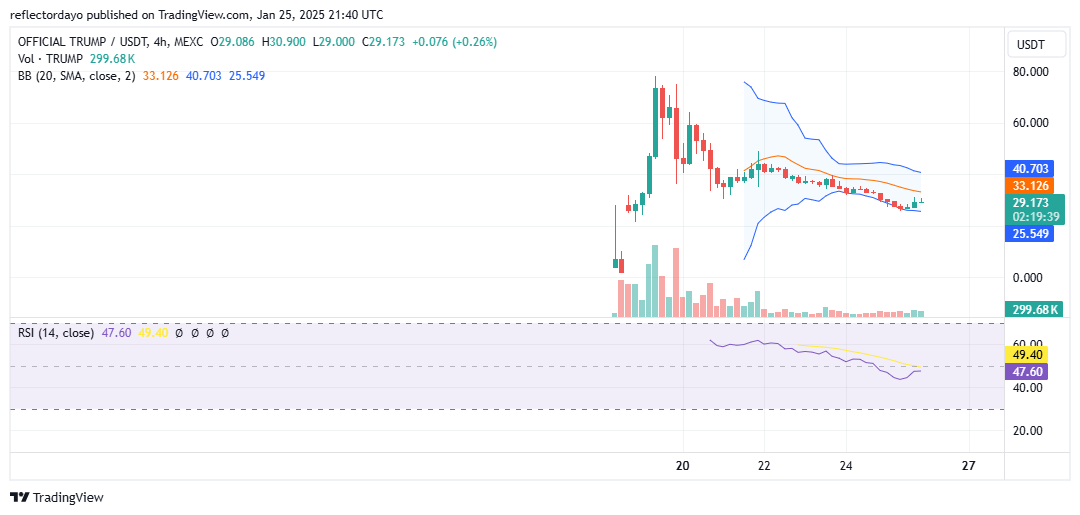
The past seven days have been a period of extreme volatility for the OFFICIAL TRUMP market. This unprecedented surge and subsequent price swings catapulted the coin to the top of today’s trending coins list. Fundamental factors significantly fueled the bullish run, as previously observed in last week’s trending coin analysis.

Following a rapid ascent from around $4.00, the price surged dramatically, reaching a peak near $80. However, the 19th witnessed a volatile trading session, characterized by a significant bearish candlestick. This marked the beginning of a bearish trend, with prices gradually declining. At one point, the market appeared poised to find support at $40, but the bears gained the upper hand, driving the price down to $30.

The current market outlook at the $30 price level suggests the potential for further downward movement. The most recent trading session featured a gravestone doji, a bearish candlestick pattern that indicates a potential reversal of the recent upward trend.

Current Price: $29

Market Capitalization: $6 billion

Trading Volume: $5 billion

Top Trending Coins for Today, January 26: TRUMP, LTC, STP, JUP and VINE

Litecoin (LTC)

Major Bias: Bullish

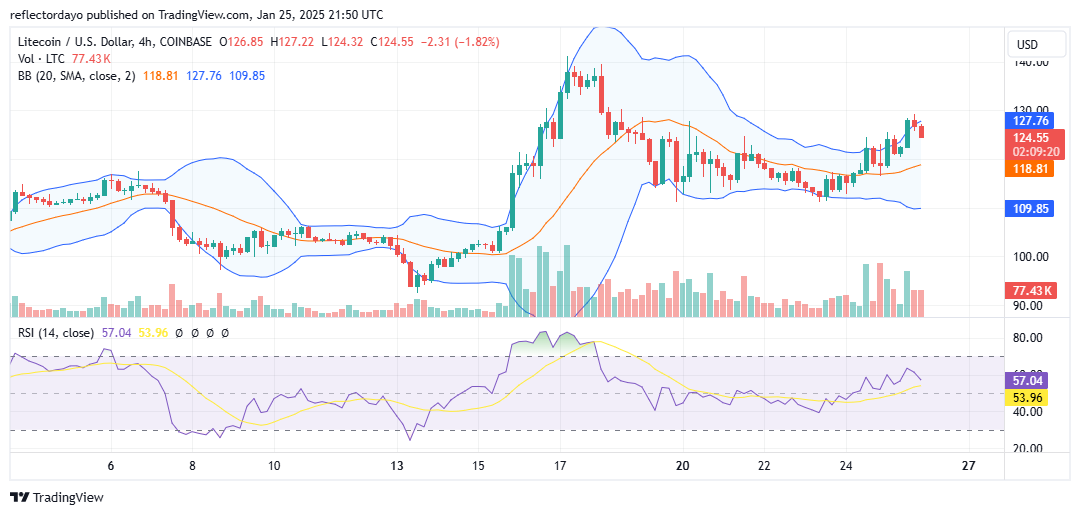
Litecoin (LTC) secures the second position on our trending cryptocurrencies list this week, demonstrating a notable 7.21% price surge within the past 24 hours. This significant gain, considering its current price point, is further amplified by a 0.48% increase over the past seven days. With a substantial market capitalization of $9.43 billion and a robust trading volume of $1.4 billion, LTC continues to command attention in the cryptocurrency market.

Today’s trading activity initially painted a picture of bullish momentum in the LTC market, evident in the strong green candle on the price chart. This upward movement pushed the market towards a crucial psychological resistance level at $130.00. Encouragingly, the price remained comfortably above all key Moving Average (MA) lines, indicating sustained upward pressure. However, some profit-taking activity emerged as the price approached and reached the $130 level, leading to a subsequent price decline.

Based on these technical indicators and the current market dynamics, a successful breach of the $130.00 resistance level appeared increasingly probable, potentially opening the door for further price appreciation in the near term. Now that the price is declining, a higher support level is crucial to maintain upward pressure on the price.

Current Price: $124

Market Capitalization: $9.4 billion

Trading Volume: $1.4 billion

Top Trending Coins for Today, January 26: TRUMP, LTC, STP, JUP and VINE

STP (STPT)

Major Bias: Indecision

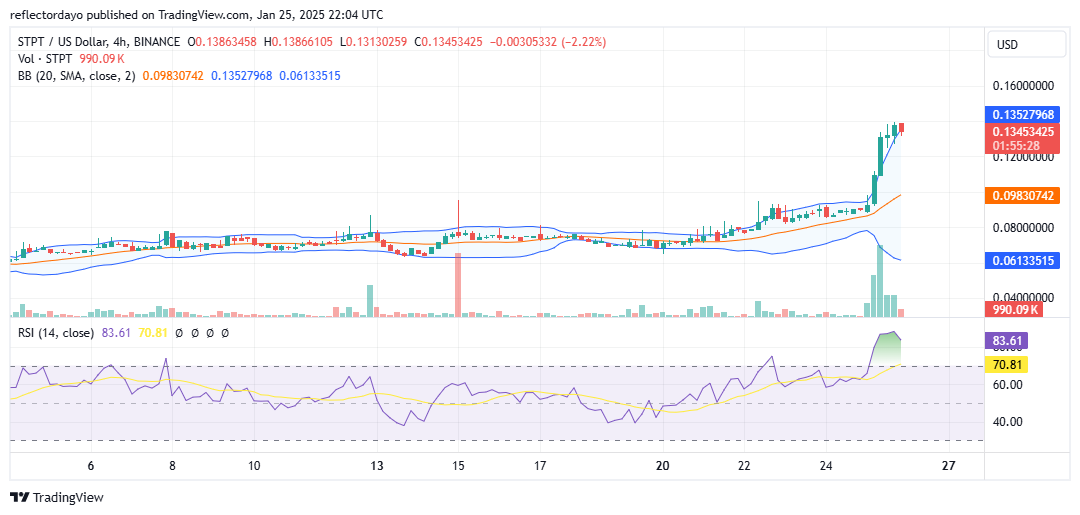
The SPT token ranks third among trending cryptocurrencies this week, showcasing a 52.10% price surge in the last 24 hours, second only in gains among the trending coins. This follows a 94.76% increase over the past seven days, driven by strong bullish momentum. The token holds a $262 million market cap and $714 million trading volume.

After a steady climb since January 21st, volatility spiked in the last 24 hours, breaking key resistance levels. A minor retracement is underway, likely from profit-taking in overbought conditions, but SPT remains above the $0.1300 support and key Moving Averages. Bulls may find a re-entry point around $0.12.

Current Price: $0.135

Market Capitalization: $262 million

Trading Volume: $714 million

Top Trending Coins for Today, January 26: TRUMP, LTC, STP, JUP and VINE

Jupiter (JUP)

Major Bias: Bullish

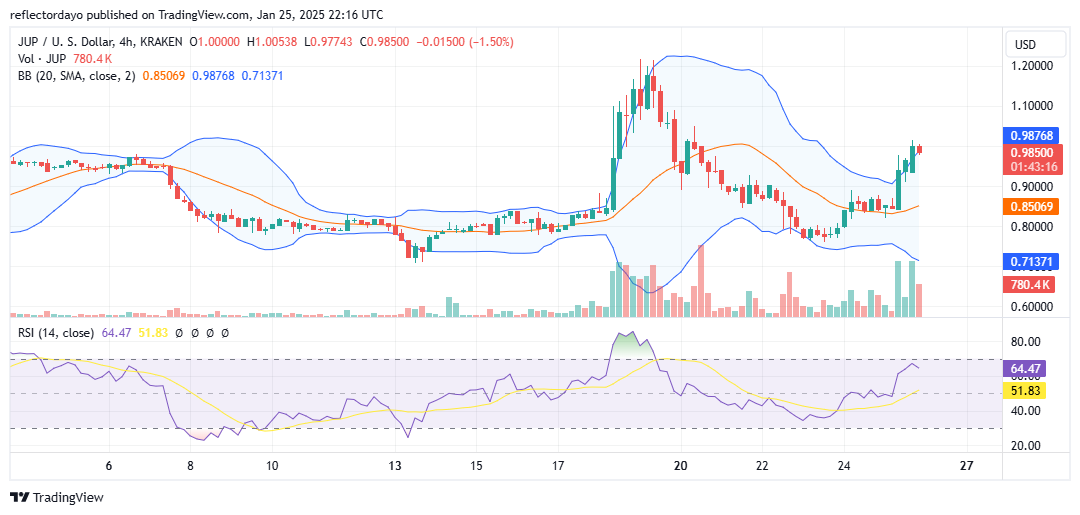
Jupiter (JUP) secures the fourth position on this week’s list of trending cryptocurrencies, exhibiting dynamic price action. Within the past 24 hours, JUP has surged by an impressive 16.45%, demonstrating significant bullish momentum. However, a modest 6.85% dip over the past seven days suggests a potential period of consolidation. JUP currently boasts a substantial market capitalization of $1.70 billion and a robust trading volume of $715 million.

The current upward price retracement can be attributed to the previous session’s strong rebound from the crucial $0.8000 support level. Building on this momentum, today’s trading activity witnessed a more pronounced price surge, propelling JUP beyond the psychologically significant $1.00 mark. The market is currently engaged in a test of the 100-day Moving Average (MA) line, a key resistance level that will determine the near-term trajectory of JUP’s price.

Current Price: $0.98

Market Capitalization: $1.7 billion

Trading Volume: $715 million

Top Trending Coins for Today, January 26: TRUMP, LTC, STP, JUP and VINE

Vine Coin (VINE)

Major Bias: Bullish

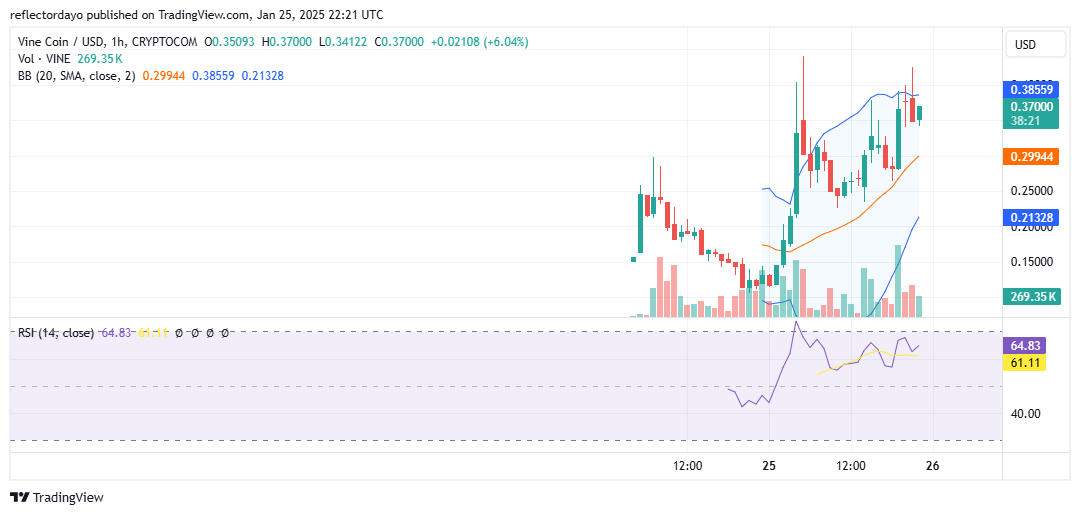
Vine Coin wraps up this week’s list of trending cryptocurrencies with a strong debut. Despite limited price history, the newly launched token has surged 234.74% in the last 24 hours and 113.02% over the past week, reflecting robust bullish sentiment. It already boasts a $396 million market cap and $1.2 billion trading volume, highlighting significant investor interest.

Currently analyzed on a 1-hour timeframe, the latest red candle signals a temporary price dip, though it remains above all key Moving Averages and the $0.3000 mark. Downward pressure is easing near the $0.3500 support level, where buyers and sellers are balanced. Renewed bullish momentum could drive further gains, fueled by early market speculation.

Current Price: $0.37

Market Capitalization: $396 million

Trading Volume: $1.2 billion

Top Trending Coins for Today, January 26: TRUMP, LTC, STP, JUP and VINE

Trade crypto coins on BYBIT!

IMPTUSDT Price: Bears Are Overcoming Bulls

Price will decline towards south

IMPT (IMPTUSDT) Price Analysis – January 25

If sellers add additional assets, the important support level of $0.0049 might be broken downward, and the lows of $0.0047 and $0.0045 might be reached. When buyers acquire momentum, the $0.0052 resistance level may be broken higher, and the $0.0055 and $0.0058 levels of IMPTUSDT may then be tested.

IMPTUSDT Market

Key Levels:

Resistance levels: $0.0052, $0.0055, $0.0058

Support levels: $0.0049, $0.0047, $0.0045

IMPTUSDT Long-term Trend: Bearish

Sellers are in charge of IMPT. The price peaked at the resistance level of $0.0067. The price remains constant at the same level for several days. As the bears gained strength, the price broke through the $0.0065 and $0.0058 support levels. It pulled back and retested the $0.0055. The price tested the $0.0049 support level on January 9 after breaking through the $0.0052 support level. Although the price fell, it is currently trying to break below the previously specified level.

IMPTUSDT Price: Bears Are Overcoming Bulls

The daily chart indicates that sellers are in control of the market. The price movement has produced a double top pattern on the daily chart. At this moment, the price is reducing. If sellers add additional assets, the important support level of $0.0049 might be broken downward, and the lows of $0.0047 and $0.0045 might be reached. When buyers acquire momentum, the $0.0052 resistance level may be broken higher, and the $0.0055 and $0.0058 levels may then be tested. When the QQE MOD’s histogram is more than zero, it signals a buy.


IMPTUSDT Medium-term Trend: Bearish

According to the 4-hour chart pattern, IMPT is bearish. The bears have been putting pressure on the cryptocurrency’s performance on the 4-hour chart. After the breakthrough in long-term consolidation. The price continues going down. The $0.0065 resistance level was investigated on December 12. The sellers’ pressure prevented the gain, and it is currently testing the $0.0049 level.

IMPTUSDT Price: Bears Are Overcoming Bulls

It appears that sellers are in control because the price is trading below the Hull suite crypto signal. When the QQE MOD dips below the zero level, it represents a sell signal.


Buy IMPT token on Exchanges!: IMPT (IMPT) https://impt.io/investors/#buy-impt

$SPONGE (SPONGE/USD): Gearing Up for a Breakout

The SPONGE/USD market finds itself in a tightly compressed range, resembling a coiled spring ready to unleash its energy. Consolidating near the $0.000024 mark, the market reflects a volatility squeeze—a scenario that often precedes significant price movements. Recent bullish attempts to break free from the horizontal price action have highlighted the underlying tension in the market.

Despite subdued movements, buyers have shown notable persistence, defending the $0.000024 support level with determination. This firm defense not only emphasizes their commitment to an upward bias but also suggests they are quietly accumulating momentum for a potential rally.

Key Levels to Watch:

  • Resistance: $0.00005, $0.000055, $0.000060
  • Support: $0.000020, $0.0000195, $0.000019

$SPONGE (SPONGE/USD): Gearing Up for a Breakout

$SPONGE (SPONGE/USD) Technical Analysis

The Bollinger Bands, an indicator of market volatility, have narrowed significantly, highlighting a phase of intense market indecision. This “squeeze” hints at a brewing tug-of-war between bullish and bearish participants, with neither side seizing control. The market now waits for a decisive catalyst to tilt the balance.

Earlier in the week, SPONGE/USD bulls attempted a breakout, but bearish pressure quickly pushed prices back down. Repeated breakout attempts have since faced rejection at progressively lower highs, creating a series of descending peaks. Despite this crypto signal, buyers have held their ground at the $0.000024 level, signaling the potential for a fresh upward move.

$SPONGE (SPONGE/USD): Gearing Up for a Breakout

$SPONGE (SPONGE/USD) 1-Hour Chart Observations

The MACD (Moving Average Convergence Divergence) indicator suggests an underlying bullish trend, as the MACD line remains above the zero level. However, the indicator shows early signs of a potential bearish crossover, highlighting the growing influence of sellers. Even so, the bulls’ resilience in maintaining their position underscores their determination to counter bearish pressures.

Previous sharp price movements caused the Bollinger Bands to widen, increasing market volatility. Yet, despite this turbulence, the $0.000024 support level has remained firm. This persistent defense points to strong buying interest, increasing the likelihood of a bullish breakout from this critical zone.

In summary, $SPONGE/USD appears poised for a significant price move as it navigates through this phase of consolidation. The outcome will likely hinge on whether the bulls can sustain their momentum and overcome the formidable resistance levels ahead.


Join the SPONGE community and be part of the next big crypto sensation! Buy Sponge ($SPONGE) today!

Tamadoge (TAMA/USD): Bulls Regain Momentum as $0.0008 Faces Intense Pressure

The recent bearish run in the Tamadoge (TAMA/USD) market pushed the price deep into lower levels, driven by intense selling pressure. The decline continued until the price found pivotal support around the $0.00050 level. Initially, traders began buying at this level, but bullish momentum was sluggish. However, the momentum eventually gained strength, causing the price to surge rapidly.  

In a short period, the Tamadoge price recovered to approximately $0.0008. This level has been significant in previous trading sessions, serving as a strong bullish support that held the market above it for an extended period. Given its historical importance as support, it is reasonable to expect substantial resistance at this level as the market stages its recovery.

Key Levels

  • Resistance: $0.0008, $0.00085, and $0.0009
  • Support: $0.00065 $0.0006, and $0.00055

Tamadoge (TAMA/USD): Bulls Regain Momentum as $0.0008 Faces Intense Pressure

TAMA/USD Price Analysis: Indicators Point to a Shift

Although bears have established a strong hold around the $0.0008 price level, significant pressure is currently being applied to this zone. A review of the 4-hour chart reveals a strong bullish candlestick, indicating robust buyer activity driving the market’s recovery. The bullish momentum has been notable, evidenced by the rapid price surge toward $0.0008.

While the repeated rejection of price at this level could reinforce it as a key resistance, the resilience of the price action remains remarkable. The recent surge in buying pressure has also increased crypto signal volatility, as highlighted by the widening of the Bollinger Bands’ bandwidth. This volatility has bolstered the bears’ defense at $0.0008, explaining the continued rejection at this level.

However, the bulls have demonstrated strength by forcing the price to bounce from a higher support level. This sustained buying pressure is now challenging the bears’ dominance at $0.0008, increasing the likelihood of a potential breakout.

Tamadoge (TAMA/USD): Bulls Regain Momentum as $0.0008 Faces Intense Pressure

Tamadoge Short-Term Outlook: 1-Hour Chart

From the perspective of the 1-hour chart, the bullish momentum has become more evident. Currently, the price is attempting to break and sustain above the $0.0008 level. As it stands, the bullish price action is pushing through key bearish resistance lines.

Although the price is now positioned above $0.0008, this does not necessarily indicate that the bears have completely relinquished their hold on this level. The Relative Strength Index (RSI) shows that the price has entered the overbought region, which could lead to indecision among traders. Despite this, the bulls appear to have the upper hand for now.

Buy TAMA/USD!

Buy Tamadoge

POL (ex-MATIC) Price Prediction: POL/USDT Assumes a Subdued Look Below Key Levels

POL (ex-MATIC) Price Prediction (January 25):

Price action in the POL (ex-MATIC) token remains below key technical landmarks, highlighting the dominance of downward forces. This bearish sentiment may continue to favor sellers in the market.

POL/USDT Long-Term Trend: Bearish (Daily Chart)

Key Price Levels:

Resistance: $0.5000, $0.5500, $0.6000

Support: $0.4000, $0.3500, $0.3000

POL (ex-MATIC) Price Prediction: POL/USDT Assumes a Subdued Look Below Key Levels

The POL (ex-MATIC) market initially experienced a bullish breakout, as indicated by a symmetrical triangle pattern. However, the current price candle for the ongoing session has formed below all the Guppy Multiple Moving Average (GMMA) lines. The size of the candle is relatively small, but its red color signals bearish dominance. Moreover, the Stochastic Relative Strength Index (RSI) lines are trending slightly downward and are now testing the 20 level of the indicator, suggesting increasing bearish momentum.

POL (ex-MATIC) Price Prediction: Bears Poised for More Wins

On the daily chart, the POL (ex-MATIC) market presents a discouraging outlook for bullish traders. The earlier bullish breakout has been overpowered by strong selling pressure, forcing the price below the GMMA lines.

The Stochastic RSI lines continue to edge downward, nearing the oversold region, reinforcing the presence of bearish sentiment. The red price candle positioned below the GMMA lines further supports the expectation of additional price declines. This setup indicates that the bears remain firmly in control.

POL (ex-MATIC) Price Prediction: Bears Strengthen Their Hold (4-Hour Chart)

The 4-hour chart for POL (ex-MATIC) reinforces the bearish sentiment. The latest price candle is red and situated below all the GMMA lines, mirroring the daily chart’s behavior. This alignment between timeframes strengthens the bearish outlook. Additionally, the Stochastic RSI lines are descending sharply toward the 50 level, signaling to intensify bearish momentum.

POL (ex-MATIC) Price Prediction: POL/USDT Assumes a Subdued Look Below Key Levels

This suggests that the price may soon test a more critical support level around $0.4000. In summary, current technical indicators on both the daily and 4-hour charts point to a continuation of bearish activity, with a possible retest of lower support levels in the near term.

Get POL (ex-MATIC) here. Buy POL 

Dash 2 Trade Price Prediction for Today, January 25: D2TUSD Ready for the Next Upbeat Trend

Dash 2 Trade Price Forecast: D2TUSD Ready for the Next Upbeat Trend (January 25)

The D2TUSD market is ready for the next upbeat trend after updating the lows as usual. The currency pair is rising, witnessing a major correction to break up the $0.00390 resistance level if all support levels hold. The coin price may likely surge to retest the previous high at the $0.00390 level and perhaps rise as high as the $0.01000 upper resistance mark, resulting in a greater opportunity to buy the asset.

Key Levels:
Resistance levels: $0.00091, $0.00092, $0.00093
Support levels: $0.00065, $0.00064, $0.00063

D2T (USD) Long-term Trend: Bearish (Daily Chart)

In its long-term view, Dash 2 Trade is in a bearish trend. The price is preparing for the next upbeat trend as it begins its new correction below the EMA-50, suggesting bearish momentum.
Dash 2 Trade Price Prediction for Today, January 25: D2TUSD Ready for the Next Upbeat Trend
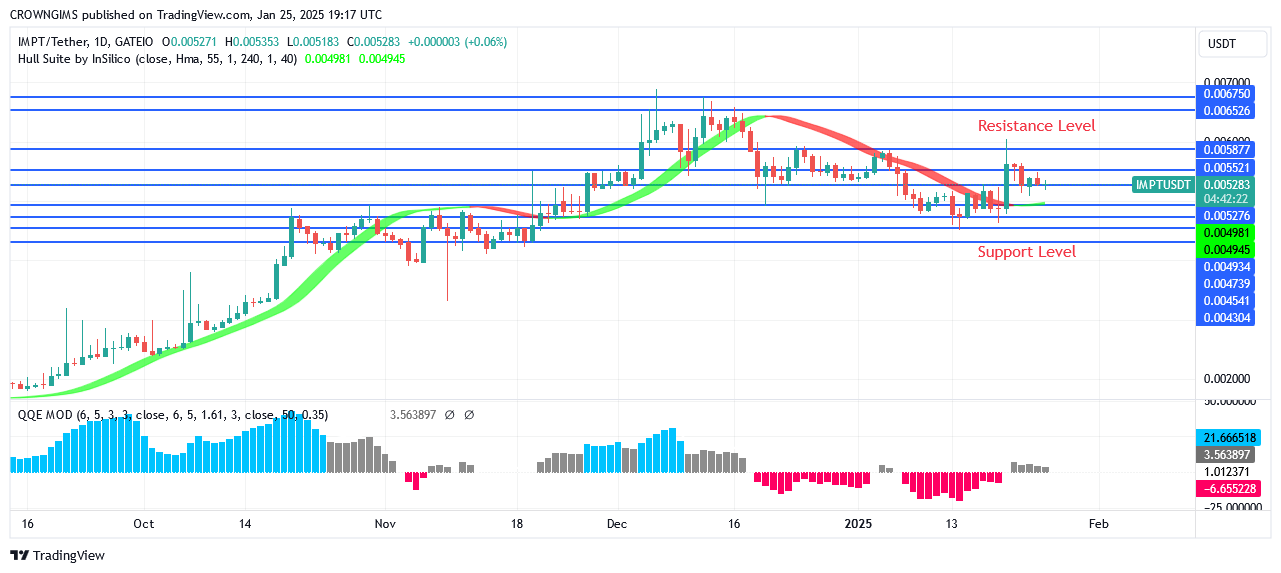
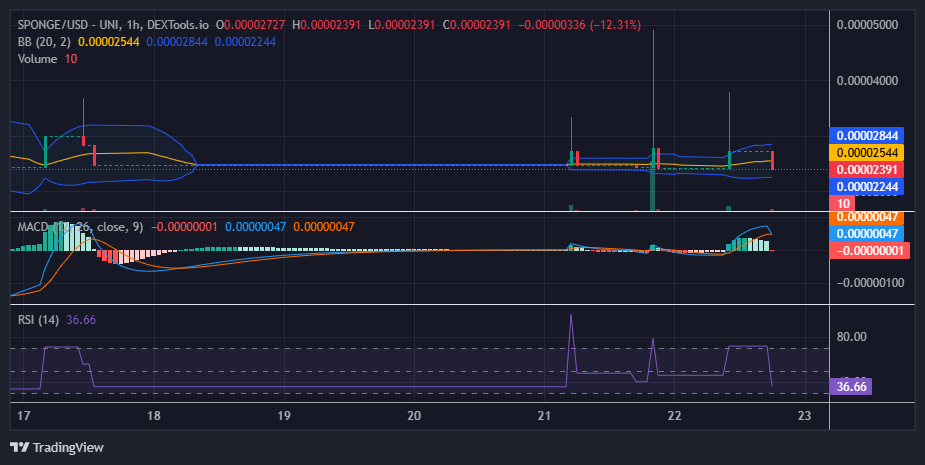
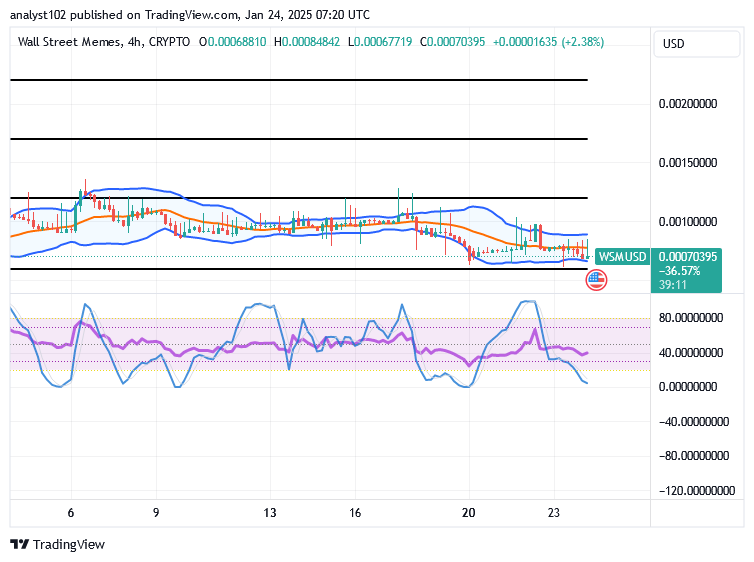
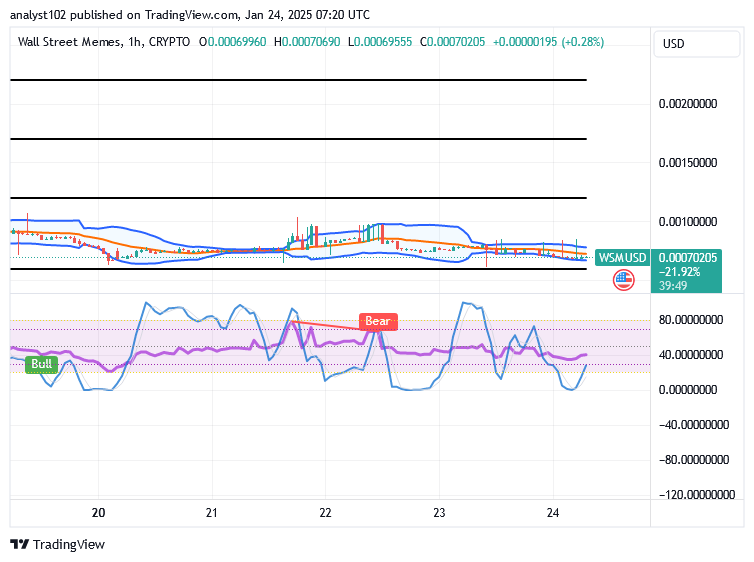
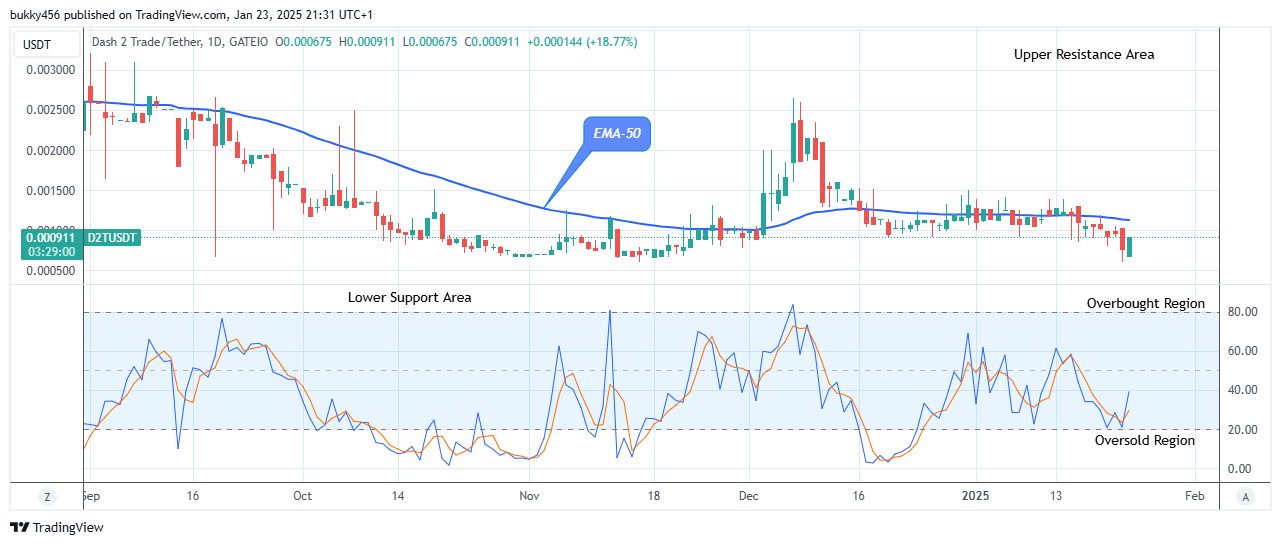
The crypto price has fallen below the supply trend lines due to the bears’ pressure at the $0.000600 low in the past few days, but it now appears like the bulls are ready for the next upbeat trend and drive us upward.

At the time of writing this article, the price of D2TUSD responded to the shift in the market structure and is currently below the moving averages at the $0.00091 resistance value as the daily chart opens today. Meanwhile, traders who buy the coin during the bearish market will also make gains in the future.

Thus, if the rebounds materialize, the crypto price is expected to test resistance zones and aim for the $0.00390 target.

Additionally, the daily stochastic suggests an uptrend, indicating a bullish continuation of the upward trend. As a result, the bulls may continue the current rally to hit the $0.01000 resistance trend line or higher in the long-term forecast.

D2T (USD) Medium-term Trend: Bearish (4H Chart)

Dash 2 Trade market remains bearish on the medium-term outlook. This is clear as the prices are trading below the EMA-50.
Dash 2 Trade Price Prediction for Today, January 25: D2TUSD Ready for the Next Upbeat Trend
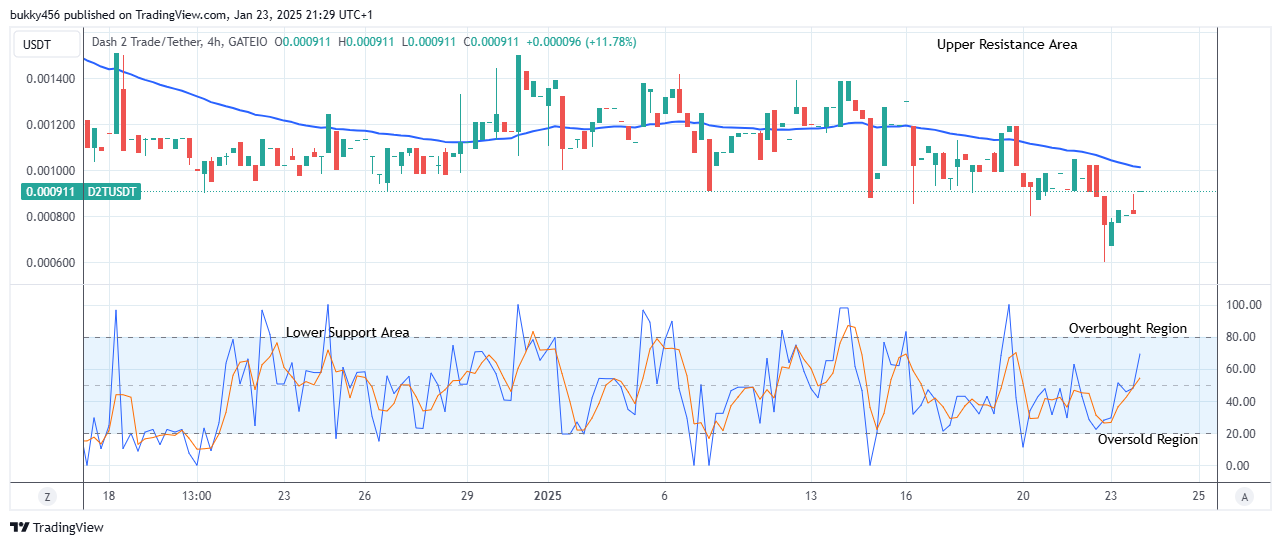
The sustained bearish at the $0.000815 support value in the last session has enhanced the coin price to remain low in its recent price.

The price of D2TUSD is advancing towards the resistance of the $0.00091 value below the EMA-50, signaling a possible bullish breakout as the 4-hourly chart opens today.

Hence, if the bulls increase their confidence in the Dash 2 Trade investment, the coin market trend could see another upbeat trend by hitting the $0.00150 high level, resulting in an intraday gain for the coin buyers.

Notably, the market is trending upward as shown by the daily stochastic, indicating that the market value of the Dash 2 Trade will continue to rise. In light of this, it is anticipated that the bulls will swing the coin price upward and may eventually hit the $0.01000 supply value in the coming days in its medium-term perspective.

With Dash 2 Trade’s new offering, Bundles, you can purchase pre-curated token collections arranged by category straight from your preferred exchange in a few easy steps.

Introducing Bundles!📊


Bundles is a new product by Dash 2 Trade that allows you to buy pre-curated collections of tokens organised by category directly from your favourite exchange, in just a few simple steps.

Check it out for yourself!👇https://t.co/YyZQVMKAjv pic.twitter.com/j05AWMgWyX

— Dash 2 Trade (@dash2_trade) May 31, 2024

Want a coin that has a huge potential for massive returns? That coin is Dash 2 Trade. Buy D2T now.

Wall Street Memes (WSM/USD) Market Holds Basis, Hiking Moves

Wall Street Memes Price Prediction – January 24

Price actions that have surfaced to the downside of the indicators have continued to make headway toward letting the WSM/USD market bulls regain decent entries at lower ends, as the present financial condition shows that the crypto-economic market holds basis, hiking moves.

Given that selling forces have been unable to breach below the lower region of the Bollinger Bands on several occasions, the events leading to hiking advances exhibit the features of promissory rising signals. You will potentially lose money if you keep trying to sell heavily along with the lower section of the indications.

WSM/USD Market
Key Levels
Resistance levels: $0.0012, $0.0017, $0.0022
Support levels: $0.0007, $0.0005, $0.0003

WSM/USD – 4-hour Chart

The WSM/USD market 4-hour chart showcases that the crypto-economic market presently holds basis, hiking moves.

The systemic positioning patterns displayed by the trend lines of the Bollinger Bands have allowed the WSM/USD traders to take appropriate, decisive action with regard to longing position orders. A warning note against obtaining better bargains in the direction of further dips in the stochastic oscillators was raised when it was discovered that they had veered southward into the oversold zone.
Wall Street Memes (WSM/USD) Market Holds Basis, Hiking Moves

As the price of the WSM/USD market stays at $0.00070395, should the long-position pushers continue to execute more orders?

The hovering style market motions that the WSM/USD market has been exercising have been to allow buyers to stage a comeback steadily in the near term, as the crypto-economic market holds basis, hiking moves.

Buyers only need to have their positions on a long-term basis in the hopes of seeing significant bounce-offs over time. Technicalities have been used to give the market a significant dip-driven bargain session so that better buying entry may be made in the meantime.
Wall Street Memes (WSM/USD) Market Holds Basis, Hiking Moves

WSM/USD 1-hour chart

The 1-hour chart reveals that the WSM/USD market holds basis, hiking moves between the trend bounds of the indicators.

The stochastic oscillators have so far been able to veer south into the oversold area, suggesting that the sellers in the WSM/USD market have reached a significantly decreased zone that may signal the end of future drops. The Bollinger Bands indicators are positioned to show that the low-pushing pace setting is under pressure to support further losses.

Bitcoin has more above $100,000.

Leader: What’s stopping you from working?

Me:

Buy and stake WSM now!: Wall Street Meme (WSM)

Riding the Wave: Is Lucky Block (LBLOCK) Gearing Up for a Breakout?

Lucky Block (LBLOCK) has demonstrated a remarkable recovery, as seen on the daily and 4-hour charts. Currently trading at $0.00001551, LBLOCK has surged by 4.09% in the last session, reflecting renewed buying interest.

The Parabolic SAR indicator signals a potential bullish trend, with the dots appearing below the price candles. This suggests growing momentum in favor of buyers. Simultaneously, the MACD histogram showcases a positive shift as the MACD line moves above the signal line, accompanied by rising green bars, a clear indicator of bullish sentiment.

Riding the Wave: Is Lucky Block (LBLOCK) Gearing Up for a Breakout?"
LBLOCKUSDT – 4H CHART

Can Lucky Block Sustain Its Upward Momentum?

On the 4-hour chart, the price is approaching resistance at $0.00002489, a crucial level to watch for continued upward movement. A successful breakout above this level could propel LBLOCK to test the $0.00002986 resistance zone. Meanwhile, the immediate support rests at $0.00001166, safeguarding the token from significant downside risks.

Riding the Wave: Is Lucky Block (LBLOCK) Gearing Up for a Breakout?"
LBLOCKUSDT – DAILY CHART

The 1-day chart further highlights the token’s resilience, with its low at $0.00001000 reinforcing the strength of the support zone. The consistent rise in trading volume indicates increasing participation, potentially laying the groundwork for sustained growth.

Lucky Block’s current trajectory signals optimism, making it an attractive prospect for both short-term traders and long-term holders. Should this bullish momentum persist, LBLOCK could continue to surprise the market with steady gains.

You can purchase Lucky Block here.  Buy LBLOCK.

Trump’s Memecoins Spark Debate on Ethics and Risks

Prior to his swearing-in as the 47th President of the United States, Melania Trump and Donald Trump introduced memecoins called TRUMP and MELANIA. In defense of the coins, David Sacks, the recently appointed AI and Crypto Czar, compared them to stamps or baseball cards.

In response, lawmakers Jacob Auchincloss and Elizabeth Warren are of the opinion that the tokens expose investors to fraud and lead to conflicts of interest. However, in the shortest period, the tokens have become very popular in the cryptocurrency market; in one day, TRUMP saw $5.9 billion in trading volume.

Trump’s Memecoins and Their Controversy

David Sacks, former PayPal executive and current AI and Crypto Czar, has seen no ethical concerns with these meme coins; he stated that they are collectible items for people wanting to celebrate Trump’s presidency.

Trump’s Memecoins Spark Debate on Ethics and Risks

However, critics like U.S. Senator Elizabeth Warren and Rep. Jacob Auchincloss strongly disagree with this view. In a letter to various federal agencies, they highlighted concerns about Trump’s dual role as a coin promoter and policymaker, saying it creates a conflict of interest. They also warned of potential investor harm and foreign influence.

Sen. Warren and Rep. Auchincloss urged regulators to assess the risks posed by these tokens.

Rising Popularity Amid Concerns

Despite the ongoing controversy, these coins have received popularity, especially among retail investors. TRUMP and MELANIA drew new traders, particularly the inexperienced with Solana-based cryptocurrencies.

Trump’s Memecoins Spark Debate on Ethics and Risks

Although the values of both tokens appear to drop at debut, TRUMP’s $5.9 billion daily trading volume has piqued the interest of traders in the meme coin. This increased popularity has generated concerns about whether these tokens are merely collectibles or speculative investments that pose hazards to consumers.

Sacks’ Role and Future of Digital Assets

In an interview with Fox Business, Sacks, an appointed developer of AI and crypto rules for the United States, has shrugged down the worries about Trump’s coins.

He added that talks are still going on to establish a national digital currency reserve. Despite the fact that no specific steps had been taken, he also underlined the significance of investigating the idea in order to strengthen the US position in digital markets.


In order to place winning trades with us via Bybit, you can open an account here.