Lido DAO (LDO/USD) Targets $2.10 Resistance Level

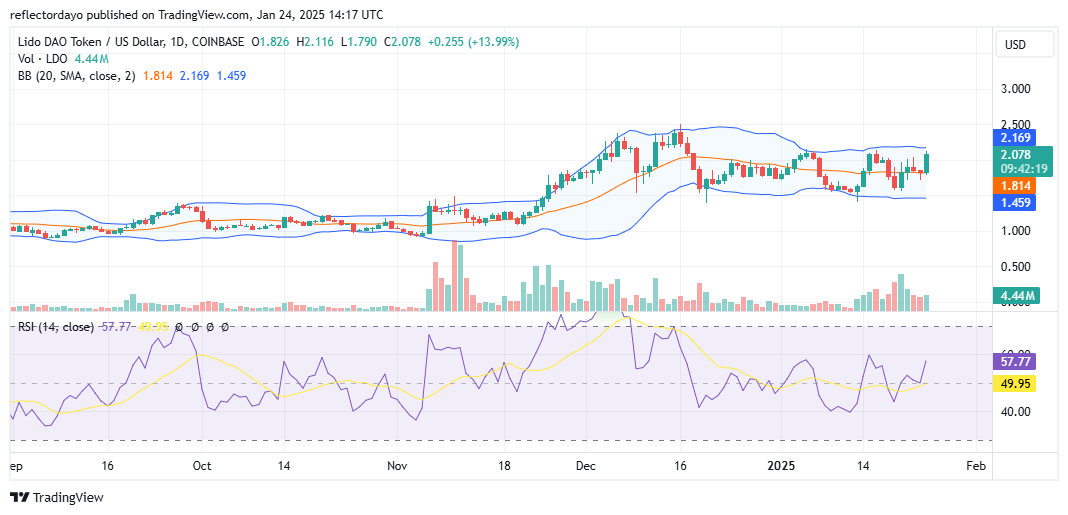
The Lido DAO market has been trading within a fixed price range of $1.50 to $2.10. Price action has consistently moved within this channel. Notably, in today’s trading session, the price is making a significant push toward the resistance level at $2.10. The bullish performance today has recorded an impressive gain of approximately 20%.

Could this suggest that the market is gearing up for a breakout from the horizontal range of $1.50 to $2.10? A closer analysis of key indicators and a comparison across multiple timeframes could provide valuable insights.

Lido DAO Market Data

  • LDO/USD Price Now: $2.078
  • LDO/USD Market Cap: $1.85 billion
  • LDO/USD Circulating Supply: 896 million LDO
  • LDO/USD Total Supply:  1 billion LDO
  • LDO/USD CoinMarketCap Ranking: #61

Lido DAO (LDO/USD) Targets $2.10 Resistance Level

Key Levels

  • Resistance: $2.20, $2.50, and $3.00
  • Support: $1.80, $1.50, and $1.00.

The Lido DAO Market Through the Lens of Indicators

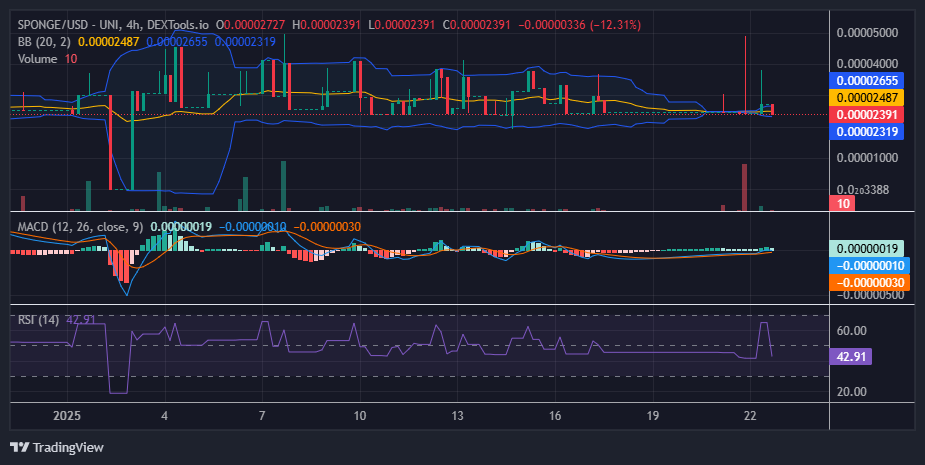
Analyzing the recent market developments, particularly the trade volume trends, a noticeable increase in trading activity was observed from the start of the year, accelerating around January 13. The histograms of volume indicators showed consistent daily growth from that date. Between January 18 and 21, the trade volume histograms were especially pronounced. Despite this, the market has remained confined within its established price range.

A key bullish signal was observed when the crypto price action crossed above the 20-day moving average, establishing a new support level around $1.80. While the bulls are currently applying pressure on the $2.10 resistance level, a rejection at this point may not undermine bullish momentum entirely. As long as the price remains buoyant above the $1.80 support level, buying pressure will likely concentrate in the upper section of the range, increasing the likelihood of a breakout.

Lido DAO (LDO/USD) Targets $2.10 Resistance Level

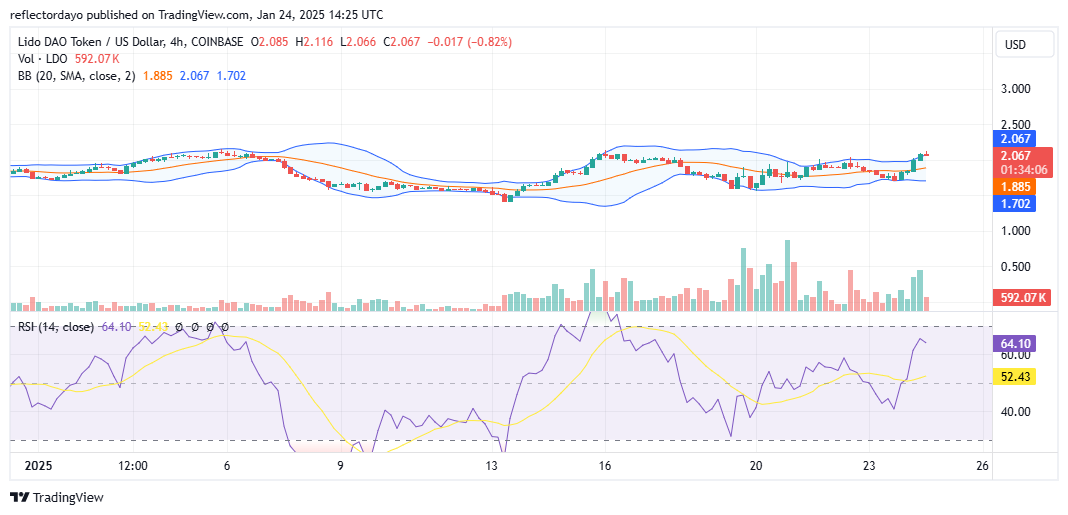
LDO/USD Price Prediction: 4-Hour Chart Analysis

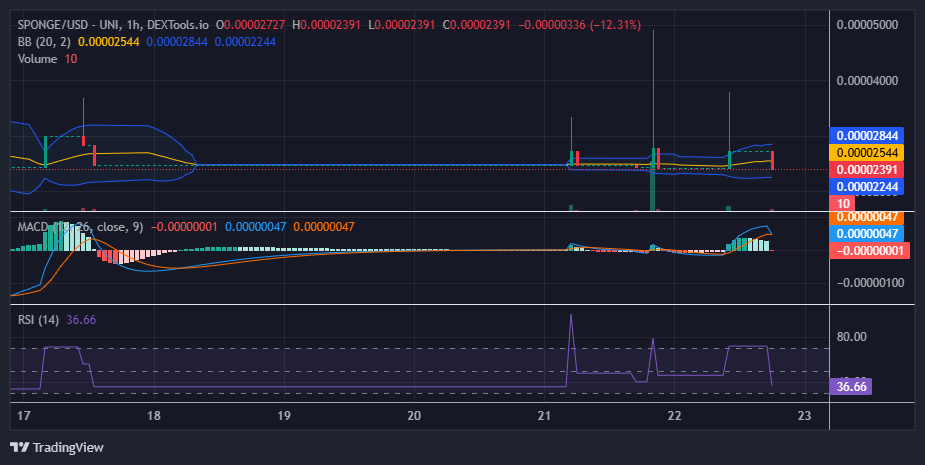
Zooming in on the smaller timeframe reveals that the bears are demonstrating notable strength around the resistance level. While they are gathering momentum at this point, they have yet to decisively reject the price. However, the most recent candlestick suggests that bearish pressure might be increasing. Additionally, the trade volume indicator shows a sharp decline in the height of the latest histogram, indicating reduced activity.

The decline in trade volume reflects a standoff between buyers and sellers. Despite this indecision occurring near the resistance level, the current Lido DAO market structure still favors the bulls. However, if the price were to fall back below the $1.80 support level, the consolidation phase is likely to persist.

Trade crypto coins on BYBIT!

UNUS SED LEO (LEO/USD) Market Demonstrates Bullish Potential For Continued Upward Movement

UNUS SED LEO Price Prediction – January 24

LEO/USD Market demonstrates the bullish potential for continued upward movement. The price is currently aiming to break through the $9.730 resistance.

The Relative Strength Index (RSI) is 61.88, indicating strong bullish momentum. The price trades above key support levels, suggesting buyers are in control. Additionally, the imminence of a break of structure (BOS) highlights increased demand; more buyers are likely to surge soon.

LEO/USD Market Key Levels:

Resistance levels: $9.730, $10.710, $11.500
Support levels: $7.940, $6.500, $5.390

LEO/USD – Daily Chart

The daily chart for LEO/USD shows that the market is set for another upward breakout.

LEOUSD has formed a consistent uptrend since breaking the $9.000 resistance level. The price has retested the $9.620 area, validating it as support. The previous order block around $7.940 provided a solid base, further strengthening the bullish trend.

UNUS SED LEO (LEO/USD) Market Demonstrates Bullish Potential For Continued Upward MovemenWhat is the projection for LEOUSD market?

If bullish momentum persists, LEOUSD is likely to target $10.710. A breakout above $10.710 may drive the price towards $11.500, the next significant resistance. Downside risks are limited as long as the $9.000 support holds firm.

UNUS SED LEO (LEO/USD) Market Demonstrates Bullish Potential For Continued Upward Movemen
LEO/BTC Price Analysis

The RSI at 43.47 indicates weakening bullish momentum, supporting the bearish sentiment. The price has broken below key support at 0.00008870 BTC, confirming a break of structure (BOS).

A descending trendline highlights sustained downward pressure, with lower highs forming consistently. If selling pressure persists, the next support target lies at 0.00008260 BTC, with a potential decline toward 0.00007000 BTC.

UNUS SEO LEO (LEO) Current Statistics
The current price: $9.700
Market Capitalization: $8,980,000,000
Trading Volume: $913,900

Place winning LEO trades with us. Get LEO here

QCP Capital Executes Groundbreaking Trade with BUIDL Tokenized Collateral

QCP Capital, a division of the QCP Group, has successfully completed the first derivatives trade secured by BlackRock’s BUIDL tokenized fund in partnership with Securitize Credit. This milestone marks a significant advancement in integrating blockchain-based assets into traditional financial systems, especially for institutional players.

Launched in March 2024, BlackRock’s BUIDL—formally known as the BlackRock USD Institutional Digital Liquidity Fund—offers a blend of blockchain technology’s efficiency and the stability of conventional finance. Operating across blockchain networks such as Ethereum, Aptos, and Polygon, the fund provides investors with stable-value tokenized shares pegged to $1 each. Designed specifically for institutional investors, BUIDL features a $5 million minimum investment requirement and includes benefits such as instant settlement, on-chain dividend tracking, and round-the-clock liquidity.

QCP Capital Executes Groundbreaking Trade with BUIDL Tokenized Collateral

QCP Capital Facilitates Yield-Enhancing Trade with BUIDL Collateral

Leveraging its role as a designated market maker for BlackRock’s BUIDL, QCP Capital enabled a groundbreaking trade executed by Securitize Credit. The transaction involved a bitcoin (BTC) basis trade secured by BUIDL collateral, reportedly driving yields significantly higher. By combining BUIDL’s native 4.25% yield with QCP’s tailored trading strategies, annualized returns exceeded 14%. This innovative approach demonstrates the potential of tokenized assets like BUIDL to deliver enhanced yields while maintaining a risk profile comparable to traditional stablecoin collateral.

This trade underscores a broader shift in the digital finance sector, with tokenized treasuries emerging as a compelling alternative to stablecoins for institutional collateral. Unlike stablecoins, BUIDL combines regulated, yield-generating functionality with liquidity and security, making it an attractive option for entities aiming to optimize returns without increasing risk.

QCP Capital Executes Groundbreaking Trade with BUIDL Tokenized Collateral

Securitize Credit Advances Blockchain Adoption in Structured Finance with BUIDL

Securitize Credit’s participation highlights the growing integration of blockchain technology into structured finance. By incorporating BlackRock’s BUIDL tokenized fund into its trading portfolio, the firm demonstrates the practical utility of tokenized assets, effectively bridging the gap between decentralized finance (DeFi) and traditional investment models.

As the tokenized asset ecosystem continues to grow, QCP Capital is actively exploring innovative uses for BUIDL, including its potential as a fixed-yield instrument via interest rate swaps. This progression reflects a broader shift in institutional finance, where blockchain-driven efficiencies are unlocking new opportunities for optimizing risk and return management.

Cardano (ADA/USDT) Traders Battle for Market Dominance

Cardano Long-term Analysis: Bullish

The market for Cardano against the Tether has experienced mixed sentiment, with the bulls and bears contesting for dominance. This picture shows the ongoing struggle in the market as the price flattens out despite over 1 billion traded volumes for the week.

Recently, ADA/USDT has seen a breakout from a prolonged downtrend after hitting $1.3700 in previous sessions. However, the ongoing sideways movement reflects indecision or a potential buildup as ADA/USDT sees a slight gain of 0.81% this week.

The Bollinger Bands on the chart signal that the pair is stabilizing, indicating possible upward pressure. However, caution is needed as the market traders battle for dominance.

Currently, Cardano trades at $1.0010, awaiting a move to either side.

Cardano (ADA/USDT) Traders Battle for Market Dominance
ADAUSDT-Weekly Chart

Technical Indicators

Major Resistance Levels: $1.1000, $1.3700, and $1.5000

Major Support Levels: $1.0000, $0.9508, and $0.7493

Cardano Technical Analysis

The analysis of Cardano against the Tether on the weekly timeframe shows a market that is consolidating, awaiting a potential break in either direction.

Recent price actions between the upper segment of the Bollinger Bands indicate traders are battling to move the price in their favor. However, the bands suggest the pair may be in the buildup phase, awaiting an uptrend due to the slight uptick in price.

On the other hand, the Stochastic signals market lacks momentum as the lines move to the front directionless. However, the appearance of the blue line underneath the orange indicates bearish pressure may be increasing.

To this end, for upside movement, the price must break above mid-band towards $1.0000 with the oscillator’s lines changing direction towards the North.

ADA/USDT Analysis: Which Side is Dominating?

On the daily chart, ADA/USDT is consolidating below the mid-band of the Bollinger band with a minor gain of 1.41% for the day. However, the tight Bollinger Bands signal decreasing volatility as $1.1200 acts as the immediate resistance.

The volume and Stochastic oscillator suggest bullish traders may soon dominate as the oscillator’s lines operate in the oversold region. However, with the increase in volume and change in the direction of the Stochastic RSI, ADA/USDT may break above $1.0120; otherwise, the price may dip towards $0.8870 soon.

Cardano (ADA/USDT) Traders Battle for Market Dominance
ADAUSDT-Daily Chart


You can purchase crypto coins here. Buy LBlock

$SPONGE (SPONGE/USD) Coiling for a Breakout

The $SPONGE market is currently locked in a tight range, mirroring the tension of a spring under immense pressure. The market has been consolidating around $0.000024. This demonstrates a condition of volatility squeeze, which typically precedes a breakout. Recently, there have been attempts for the bullish price to break out, evidenced by recent spikes from the horizontally moving price action, or flat price action.

Despite the muted price action, the bulls have shown remarkable resilience, staunchly defending the critical support level at $0.000024. This unwavering support demonstrates their commitment to maintaining an upward trajectory and suggests they are accumulating strength for a potential surge.

Key Market Dynamics:

  • Resistance Levels: $0.00005, $0.000055, $0.000060
  • Support Levels: $0.000020, $0.0000195, $0.000019

$SPONGE (SPONGE/USD) Coiling for a Breakout

$SPONGE (SPONGE/USD) Technical Analysis

The Bollinger Bands, a key indicator of market volatility, have converged significantly, reflecting a period of intense indecision. This “band squeeze” underscores the fierce battle between bullish and bearish forces, with neither side gaining a decisive advantage. The market appears to be poised on a precipice, awaiting a catalyst to break this stalemate.

A couple of sessions ago, the $SPONGE bulls attempted to sustain a breakout, but this was quickly rejected by bearish sentiment. Subsequent attempts to break out were met with rejection at lower price levels, resulting in a series of descending peaks. Despite this mounting pressure on the bulls’ position at the $0.000024 price level, they have maintained their ground, suggesting a potential for another sustained upward price move.

$SPONGE (SPONGE/USD) Coiling for a Breakout

$SPONGE (SPONGE/USD) 1-Hour Chart Observations

The Moving Average Convergence Divergence (MACD) indicator continues to signal a bullish undercurrent, as the MACD line remains above the zero level, despite showing early signs of a bearish crossover. This suggests that while bearish pressure is mounting, the bulls are demonstrating remarkable resilience, holding their ground against the encroaching bearish forces.

Earlier market activity, characterized by a series of small but sharp price spikes, caused the Bollinger Bands to widen significantly, resulting in increased market volatility and heightened oscillations. Despite this period of heightened uncertainty, the bulls have successfully defended the critical $0.000024 support level. This unwavering defense suggests a strong commitment to maintaining an upward trajectory and raises the possibility of a bullish bounce from this key support level.

Buy SPONGE/USD!

Join the SPONGE community and be part of the next big crypto sensation! Buy Sponge ($SPONGE) today!

Scotty The Ai Price Prediction: SCOTTYAIUSD Price to Swing up, Breakout Imminent

Scotty The Ai Price Prediction – January 24

Today, Scotty The Ai price is about to swing up, and a breakout is imminent to resume its bullish race. The coin is trying hard not to remain and fall heavily to the downside. Therefore, if the bulls could trigger their forces, the price would close above the $0.0210 supply trend line. Its breakout will trigger the buying pressure and offer a good buy entry opportunity.

Technical indicators:
Key Resistance Levels: $0.0019, $0.0020, $0.0021
Key Support Levels: $0.0011, $0.0010, $0.000 9

SCOTTYAI/USD Long-term Trend: Bearish (Daily Chart)

Scotty, The Ai price will swing up, and a breakout is imminent as the bulls remain determined to push the pair to the resistance level in their long-term view.
Scotty The Ai Price Prediction: SCOTTYAIUSD Price to Swing up, Breakout Imminent
The price is below the EMA-50 line, indicating downward momentum and the high impact of sellers in the market. The bulls are also trying and will not allow the support level to stay.

The bears’ pressure at the $0.0014 support value in the past few days has contributed to its bearishness in its recent price level.

The Scotty Ai price swings up to a $0.0018 high level below the EMA-50 as the daily chart opens today suggesting that further breakout is imminent. The bulls suggest a possible bullish expansion, which may lead the price of SCOTTYAIUSD to a $0.0210 supply level.

Hence, with the price pointing upwards on the daily stochastic, a swing up and further breakout is imminent. As a result, the buy investors might drive the Scotty Ai price up and may hit the $0.0300 supply level in the upcoming days in its higher time frame.

SCOTTYAI/USD Medium-term Trend: Bearish (4H Chart)

On the medium-term chart, SCOTTYAIUSD price swing up and a possible breakout is imminent, as the bulls poised for further increase in value of the token.
Scotty The Ai Price Prediction: SCOTTYAIUSD Price to Swing up, Breakout Imminent
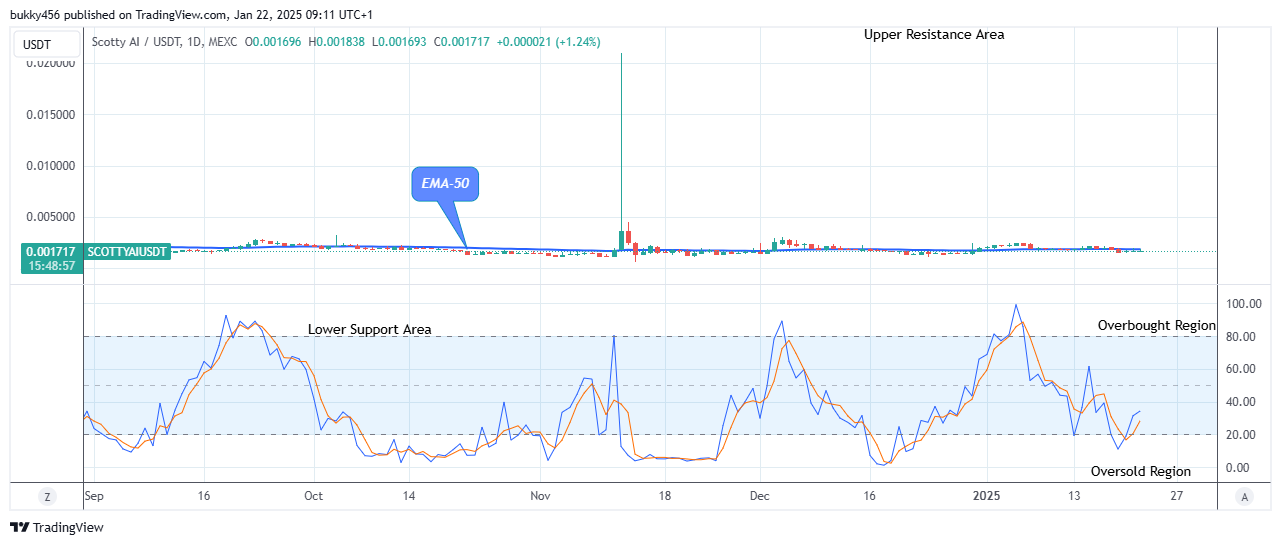
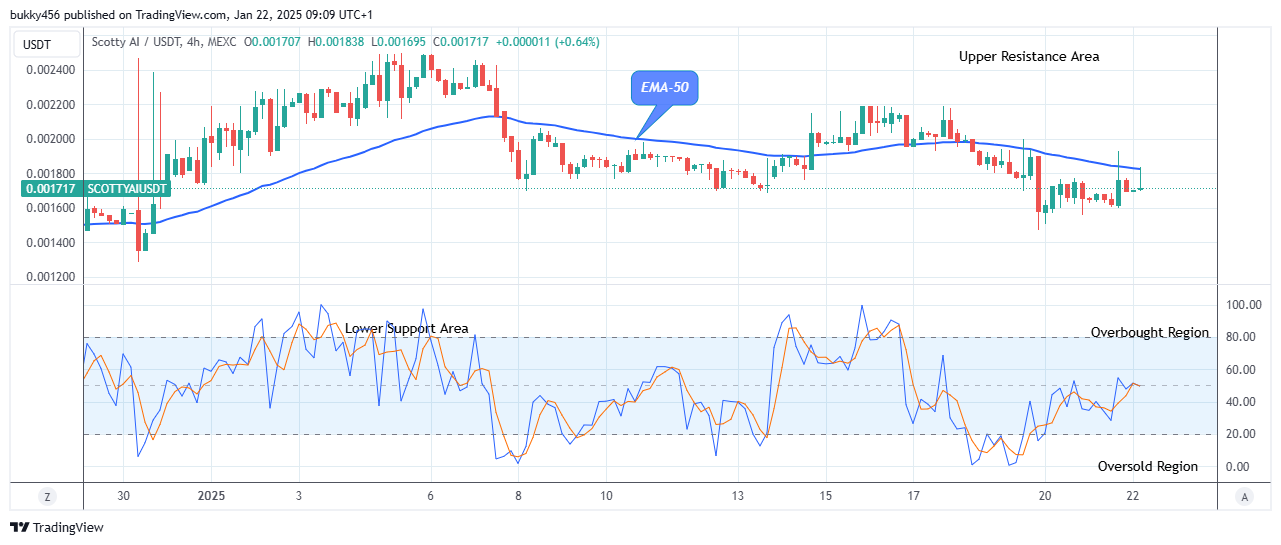
The coin is trading below the EMA-50, indicating a bearish trend. However, the market is presently facing resistance at the recent high due to the returns of the bulls into the market.

Meanwhile, Scotty The Ai price action which increases from the $0.0017 level to the $0.00182 resistance level below the moving averages as a retracement move, affirms the presence and the impact of the bulls in the market. Hence, a breakout is imminent.

Thus, closing the 4-hourly session above the $0.0029 will put the trade more on the buy side, as potential future gains are guaranteed.

Furthermore, the SCOTTYAIUSD pair pointing up on the daily stochastic suggests that a breakout is imminent, suggesting a possible recovery of the $0.0300 supply level in the coming days in the medium term.


ScottyAI is an innovative blockchain initiative that is revolutionizing digital finance.


$SCOTTY claim is now live! Stake your claimed tokens below to earn rewards!

Dash 2 Trade Price Predictions for Today, January 24: D2TUSD Sitting at $0.00794 High Mark, Aiming to Rally

Dash 2 Trade Price Forecast: D2TUSD Sitting at $0.00794 High Mark, Aiming to Rally (January 24)

Despite the minor downturn experienced, the D2TUSD pair aims to rally, with investors increasingly shifting the coin value for a major breakout toward the upper channel. The crypto price will likely turn positive sooner, following a recent correction, suggesting buyers are making a recovery attempt. Therefore, a bullish break above the $0.00390 high mark will encourage the buy investors to make a longer correction, and this might reach a high at $0.01000 in the upper supply trend line, signaling a long-term bullish breakout.

Key Levels:
Resistance levels: $0.000750, $0.000800, $0.000850
Support levels: $0.000600, $0.000550, $0.000500

D2T (USD) Long-term Trend: Bearish (Daily Chart)

The D2TUSD pair is sitting at $0.000794, aiming to rally following a recent correction with bulls seemingly regaining momentum in its long-term outlook. The price bar is trending below the moving average line, confirming its bearishness.
Dash 2 Trade Price Predictions for Today, January 24: D2TUSD Sitting at $0.00794 High Mark, Aiming to RallyThe interference of short-term traders to the $0.000600 low level in the previous action has contributed to its bearish momentum in its recent low.

Today, the Dash 2 Trade pair is poised to rally as the bulls corrected a $0.000794 resistance level below the EMA-50 as a pullback as the daily chart begins with intraday gains.

Such lower price rejection indicates buyers are defending this level and attempting to return the token price to the higher side.

Hence, with sustained investors’ enthusiasm, the D2TUSD price could reach as high as the $0.000390 peak barrier, offering strong resistance to the crypto price.

Also, Dash 2 Trade is showing more upside possibilities as we can certainly expect more strength from the coin and this may likely get to a $0.01000 upper resistance mark in the coming days in its long-term outlook.

D2T (USD) Medium-term Trend: Bearish (4H Chart)

D2TUSD rebounded after its downside moves. The coin aims to rally as it trends towards the resistance level in its medium-term time frame. The market shows that the price may soon reach its peak value following the recent breakout.
Dash 2 Trade Price Predictions for Today, January 24: D2TUSD Sitting at $0.00794 High Mark, Aiming to Rally
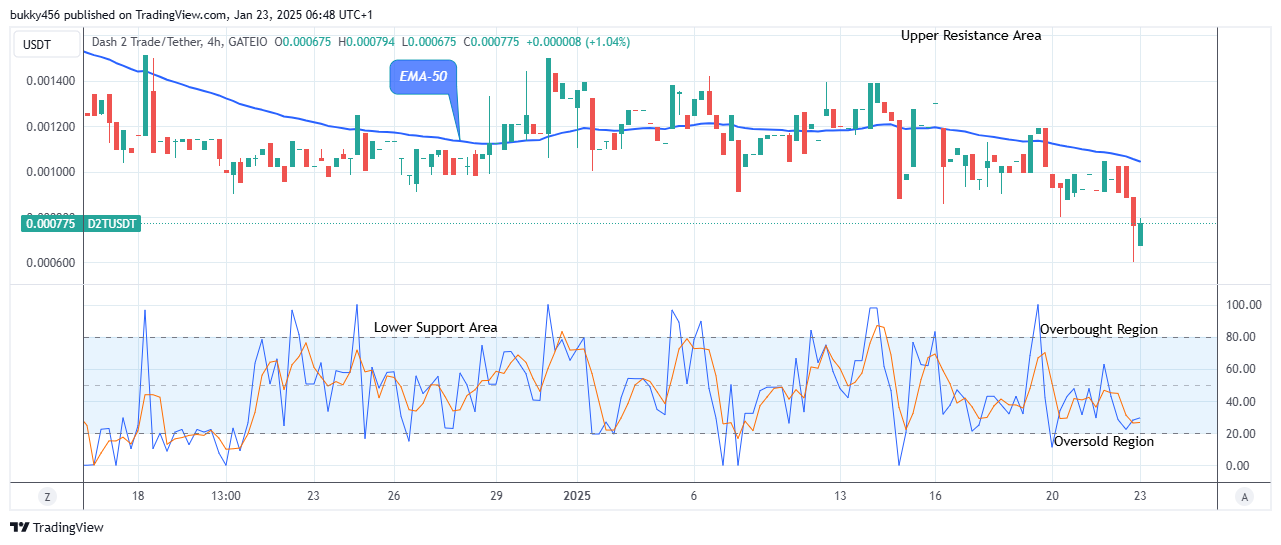
The bears’ pressure at the $0.000600 low point in the last session has dropped the crypto’s price to below the resistance level in its recent high.

Dash 2 Trade price movement to a $0.000794 high level below the EMA-50 as the daily chart commences today is a pullback that will enable bulls’ recovery to foster a higher price, resulting in an intraday gain for buyers.

In addition, the momentum indicator shows that the price of D2TUSD will still bounce up, so we expect the price distribution to reach the $0.01000 supply level and beyond in the coming days in its medium-term outlook.

Finally, one of our most eagerly awaited features is available! Let Dash 2 Trade handle the labor-intensive tasks: Our platform keeps an eye on the market for you.

Want a coin that has a huge potential for massive returns? That coin is Dash 2 Trade. Buy D2T now.

Solana (SOL) Price Prediction: SOL/USDT Maintains Position Above $240

Solana (SOL) Price Prediction (January 24):

The Solana market has established a solid base at the $240 price level. Since surpassing this threshold, trading activity has generally remained above this key level. Recent market behavior also reflects activity above crucial technical levels, which could support further price growth as the session progresses.

SOL/USDT Long-Term Trend: Bearish (Daily Chart)

Key Price Levels:

Resistance: $250.00, $270.00, $290.00

Support: $240.00, $220.00, $200.00

Solana (SOL) Price Prediction: SOL/USDT Maintains Position Above $240

On the daily chart, the latest price candle is positioned significantly above all the Moving Average (MA) lines, even though the candle appears red. The Stochastic Relative Strength Index (RSI) lines show a downward movement toward the 80 mark, with a slight sideways trajectory just below this level.

Solana (SOL) Price Prediction: Bearish Momentum Slows Above $240 Threshold

Observing Solana’s price activity above the $240 level reveals increased volatility, particularly in the last five sessions, where prices approached the $300 mark, nearly setting a new all-time high. However, bearish pressures prevented this milestone, causing a pullback. Despite this, subsequent sessions have maintained a position above the $240 level.

Trading activity continues above all MA lines, signaling that the upward correction remains intact. However, the retracement towards $240 shows reduced momentum. Additionally, the Stochastic RSI lines have merged, suggesting that bearish forces are encountering resistance, preventing significant downward movement.

Solana (SOL) Price Prediction: SOL/USDT Holds Above a Key Level (4-Hour Chart)

On the Solana 4-hour chart, price action remains above all MA lines. The latest price candle is positioned just above the 20-day MA line, which itself lies above the other MA lines. Meanwhile, the Stochastic RSI lines are in the oversold region but are showing an upward trajectory.

Solana (SOL) Price Prediction: SOL/USDT Maintains Position Above $240

Technically, the position of price action above all MA lines and the upward trajectory of the Stochastic RSI in the oversold region strongly indicate the market is still in an uptrend. These factors suggest the potential for upward momentum to propel the market toward the $260 and $270 resistance levels.

Get Solana (SOL) here. Buy SOL 

ApeCoin (APE/USD) Trends Bearish

Price Analysis: ApeCoin Spiked Bullishly but Quickly Reversed Into a Sustained Bearish Trend

Apecoin market experienced a significant structural shift marked by the emergence of a strong bullish candle in mid-October. This event altered the overall price dynamics, transitioning the market into a bullish phase.

APEUSD Key Levels

Demand Levels: $0.850, $0.580
Supply Levels: $1.200, $1.560

ApeCoin (APE/USD) Trends Bearish

Following this shift, prices began to trend higher, consistently climbing until they reached the $1.970 supply level. At this point, price action began to decline, initially appearing as a standard retracement within the bullish trend.
However, the retracement soon evolved into a broader bearish trend as the bullish trendline was decisively breached. This marked the end of the bullish phase and confirmed the shift to bearish momentum. After the break of the bullish trendline, the market witnessed a retest of this former support, which now served as resistance. This retest solidified the bearish trend, setting the stage for further downside movement.

The bearish trend gained additional validation with a recent bearish break of structure on the daily timeframe. This break eliminated any immediate potential for a bullish recovery, with the daily Moving Average indicator signaling bearish conditions as the price remains below the indicator.

On the 4-hour timeframe, price action offers a closer examination of the ongoing bearish momentum. Following the bearish break of structure, price is now gravitating toward a Fair Value Gap (FVG) within the 4-hour chart,as overall price suggest further declines.

ApeCoin (APE/USD) Trends BearishMarket Expectation

Despite some signs of bullish momentum attempting to emerge near the $1.200 level, it is anticipated that this level will act as resistance, limiting any upward movement. The market is expected to form new lower lows, reinforcing the bearish narrative in the near term.

You can purchase Lucky Block here.  Buy LBLOCK

Note: Cryptosignals.org is not a financial advisor. Do your research before investing your funds in any financial asset or presented product or event. We are not responsible for your investing results