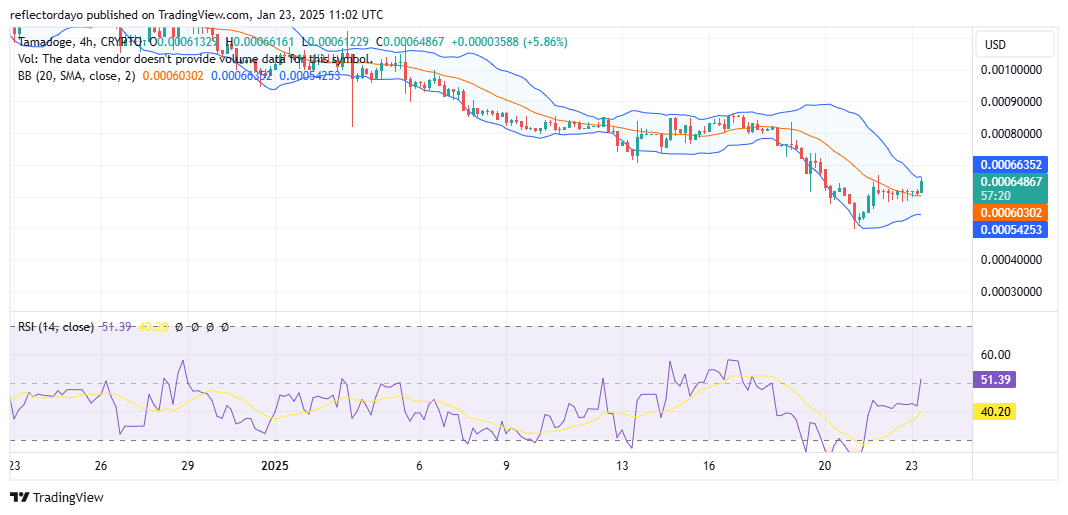
After a sharp TAMA/USD price decline that plunged below the critical $0.0008 support and extended to the $0.0006 level, a potential bottom appears to have formed around $0.0005, signaling a potential bullish reversal.
A key milestone was achieved with the successful breach of the immediate resistance at $0.0006, indicating a resurgence of buying pressure. This is further evidenced by the emergence of bullish candlesticks on the 4-hour chart, demonstrating strong upward momentum as buyers drive the price higher.
Key Levels:
- Resistance: $0.00085, $0.0009, $0.00095
- Support: $0.0007, $0.00065, $0.0006
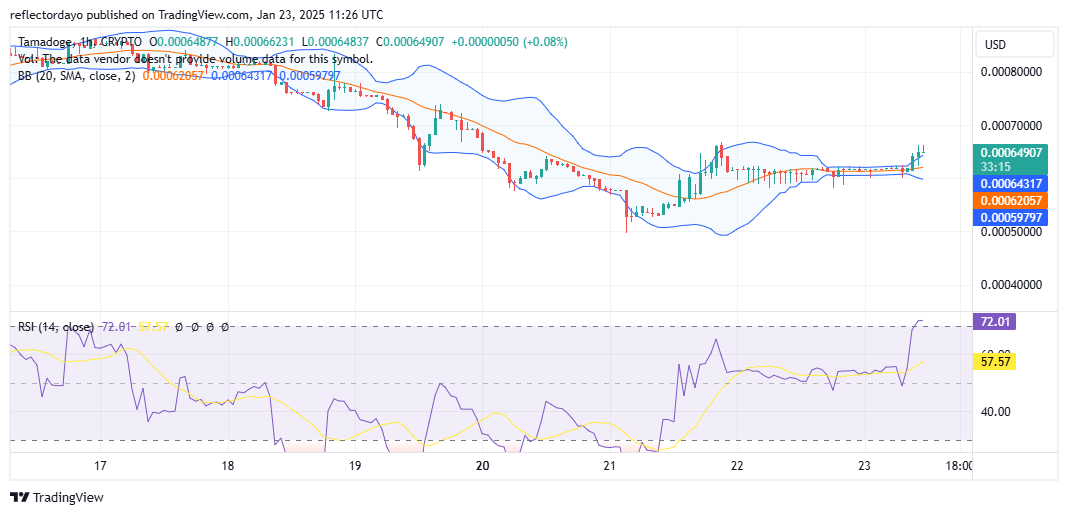
TAMA/USD Price Analysis: The Indicators’ Point of View
While the bullish trend gains momentum, a pocket of resistance has emerged around the $0.00065 level. This is evident in the upper shadow of recent bullish candlesticks, suggesting a temporary pause in the upward movement. However, the TAMA/USD bulls have demonstrated strength by successfully breaking through the consolidation phase near the $0.0006 level, showcasing their dominance despite facing resistance at $0.00065.
A sustained bullish push in the upcoming 4-hour trading session could be crucial. Overcoming the $0.00065 resistance level is key, as it could attract significant buying interest and fuel further upward momentum.

Tamadoge Short-Term Outlook: 1-Hour Chart
The recent bullish run within a short timeframe has exhibited strong momentum, pushing price action into overbought territory according to technical indicators. This has resulted in increased market volatility, leading to rapid price swings. Despite this choppy market condition in Tamadoge, bullish sentiment remains dominant.
The $0.00065 price level represents a significant resistance level. The bulls have demonstrated resilience around this point, increasing the likelihood of a successful breakout and attracting further bullish momentum to propel the price higher.
Buy Tamadoge!
There’s no mobile runner out there quite like #TamadogePursuit! 🏃♂️
1️⃣ Sign up – start with 20 free credits for a boost!
2️⃣ Climb up the leaderboards.
3️⃣ Win $TAMA rewards!Play Now! 👇
📱Android: https://t.co/Of8SYALRzL
📱 iOS: https://t.co/IthvqovwAH pic.twitter.com/84HNqob9Rf— TAMADOGE (@Tamadogecoin) September 10, 2024

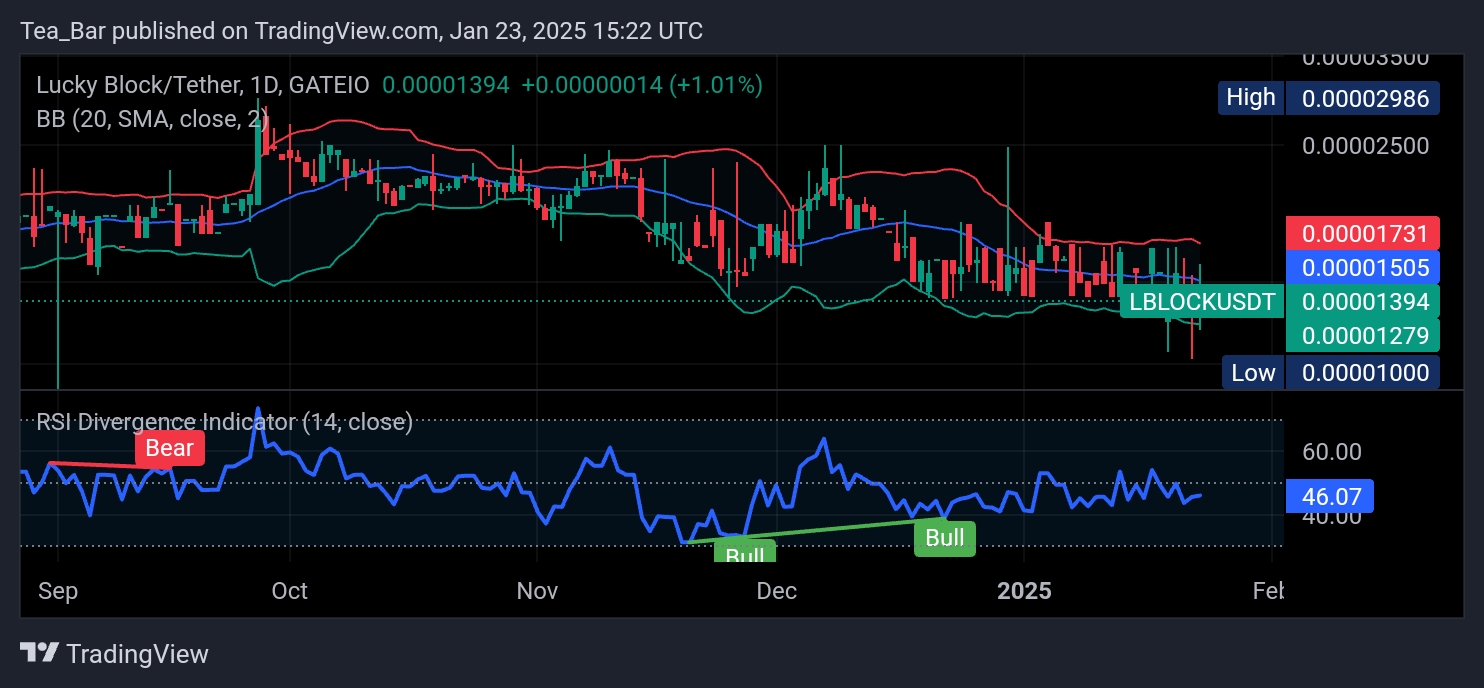 LBLOCKUSDT – Daily Chart
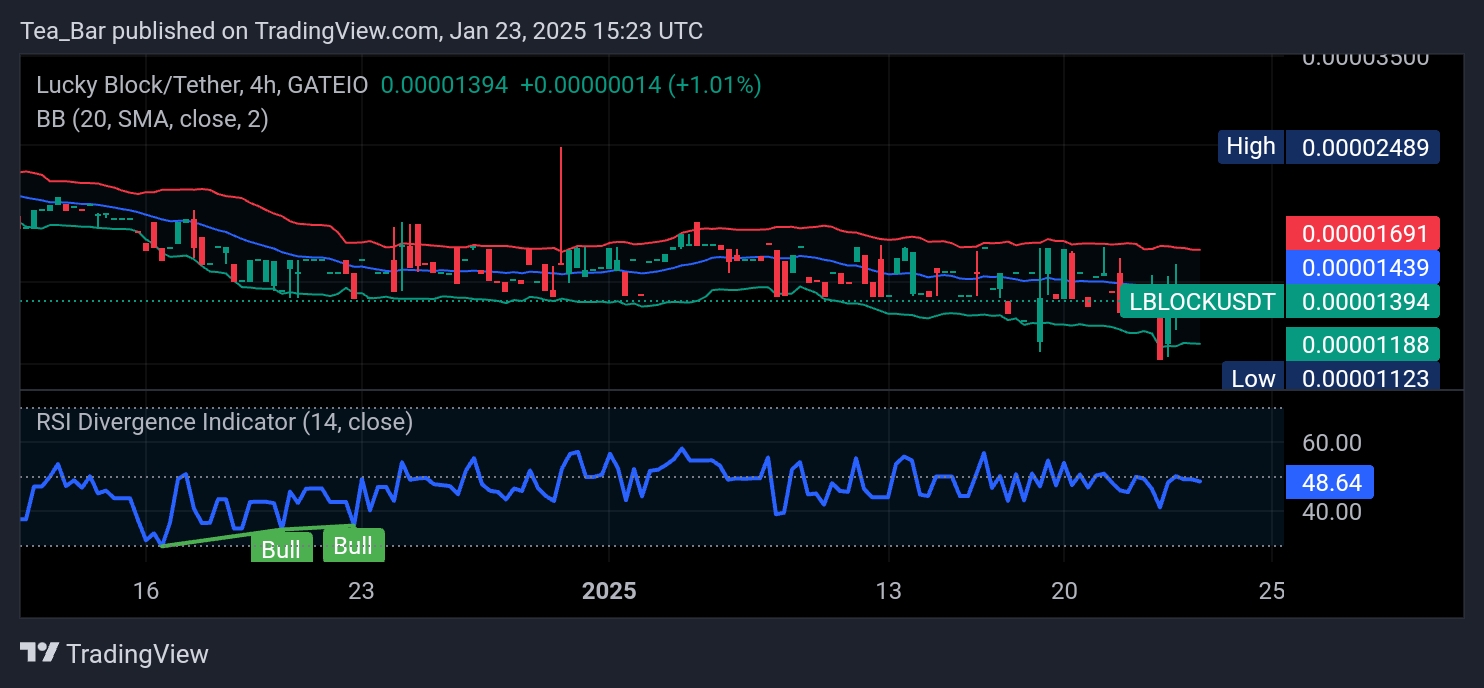

 What is the projection for the AVAXUSD market?
 LBLOCK/USD – Four-Hour Chart