Saga and ElizaOS Change the Game for AI and Blockchains

Saga, a Layer-1 platform that helps create separate blockchains, has joined forces with ElizaOS to give AI agents the ability to launch their blockchains. This teamwork combines Saga’s easy-to-expand system with ElizaOS’s knowledge of AI, opening new doors for integrating AI and blockchain. It makes it simple for AI agents to start their blockchains, offering better performance, flexibility, and exciting chances in areas like creative AI, market predictions, and handling digital assets.

Rebecca Liao, the CEO of Saga, shared how this move isn’t just a small step forward but a major change. She explained that Saga’s system gives AI agents everything they need to succeed, from space to work to better security and features.

Driving Innovation in AI and Blockchains

AI agents using ElizaOS can easily launch their Layer-1 blockchains on Saga’s platform. These blockchains are independent and easy to customize, allowing AI agents to work more freely and handle tasks that fit their needs. This ability makes exciting ideas, like using AI in games or analyzing markets in smarter ways, possible.

Saga and ElizaOS Change the Game for AI and Blockchain

At the same time, Saga’s system lets AI agents work together in shared, safe spaces without worrying about extra transaction costs. This cooperation encourages creative growth as AI agents learn and work as a team, leading to breakthroughs in gaming, entertainment, and smart applications.

Growing a Stronger Community

ElizaOS also helps developers by giving them tools, advice, and ways to connect with others. Already, over 400 projects are using Saga’s platform for areas like gaming and AI, and this partnership is set to make it even better by giving developers more chances to build and grow.

Looking ahead, Saga and ElizaOS are planning events like coding challenges and support programs to help bring fresh ideas to life. The goal is to build a lively network where AI and blockchain create amazing things together. This partnership shows how technology can change and improve how we do things, setting the stage for a future full of possibilities.


In order to place winning trades with us via Bybit, you can open an account here.

Uniswap (UNI) Price Prediction: UNI/USDT Moves Further South

Uniswap (UNI) Price Prediction (January 23):

The Uniswap market has just breached a medium-term support level at $12.74. Technically, this indicates strong bearish momentum. Current technical indicators suggest that sellers are firmly in control, strengthening the downtrend and driving the market further south.

UNI/USDT Long-Term Trend: Bearish (Daily Chart)

Key Price Levels:

Resistance: $15.00, $17.50, $20.00

Support: $12.00, $10.00, $8.00

Uniswap (UNI) Price Prediction: UNI/USDT Moves Further South

The most recent price candle on the daily chart reveals continued selling pressure. As a result, the price has fallen below the $12.74 threshold. Price activity remains beneath all the Moving Average (MA) lines, underscoring bearish dominance. Additionally, the Stochastic Relative Strength Index (RSI) lines have dropped below the 20 level, signaling oversold conditions. The downward trajectory of the RSI lines suggests that bearish momentum may persist.

Uniswap (UNI) Price Prediction: UNI/USDT Eyes the $12.00 Price Level

On the daily chart, Uniswap shows a bearish setup. Over the past five sessions, sellers have gained dominance, pushing the price below the 20- and 50-day MA lines. As of today, selling pressure has intensified, resulting in the breach of medium-term support at $12.74.

The market now lies between the four MA lines visible on the chart. Meanwhile, the RSI lines continue descending deeper into the oversold region, with the lead line breaking below the 20 level. This setup suggests further price declines are likely.

Uniswap (UNI) Price Prediction: UNI/USDT Remains Under Selling Pressure (4-Hour Chart)

On the 4-hour chart, price action continues to trend lower. Recent price candles are of similar size, reflecting steady selling pressure. The ongoing session’s price candle remains red, with price activity staying below all MA lines on the chart.

Uniswap (UNI) Price Prediction: UNI/USDT Moves Further South

The Stochastic RSI lines are now at the lower end of the oversold region. This aligns with the bearish outlook from the daily chart. Given that price action on the shorter time frame remains below all MA lines and the RSI remains oversold, the market is likely to target the $12.00 support level soon.

Get Uniswap (UNI) here. Buy UNI

Scotty The Ai Price Prediction: SCOTTYAIUSD Price Retracement May Surge above $0.0210 Resistance Level

Scotty The Ai Price Prediction – January 23

In the past 24 hours, Scotty The Ai pair, struggling to remain positive is imminent, targeting the resistance. Its price retracement may surge above the resistance area, driving the coin price to an intraday high of $0.0016 with the potential to break critical resistance levels. However, with high buying pressure and positive market sentiment, the price retracement may break above the $0.0210 peak barrier level, providing the foundation for an upward trajectory.

Technical indicators:
Key Resistance Levels: $0.0020, $0.0022, $0.0024
Key Support Levels: $0.0012, $0.0011, $0.0010

SCOTTYAI/USD Long-term Trend: Bearish (Daily Chart)

Scotty The Ai price retracement may surge above the resistance line as it shows resilience and potential for further upward movement in its higher time frame.
Scotty The Ai Price Prediction: SCOTTYAIUSD Price Retracement May Surge above $0.0210 Resistance Level 
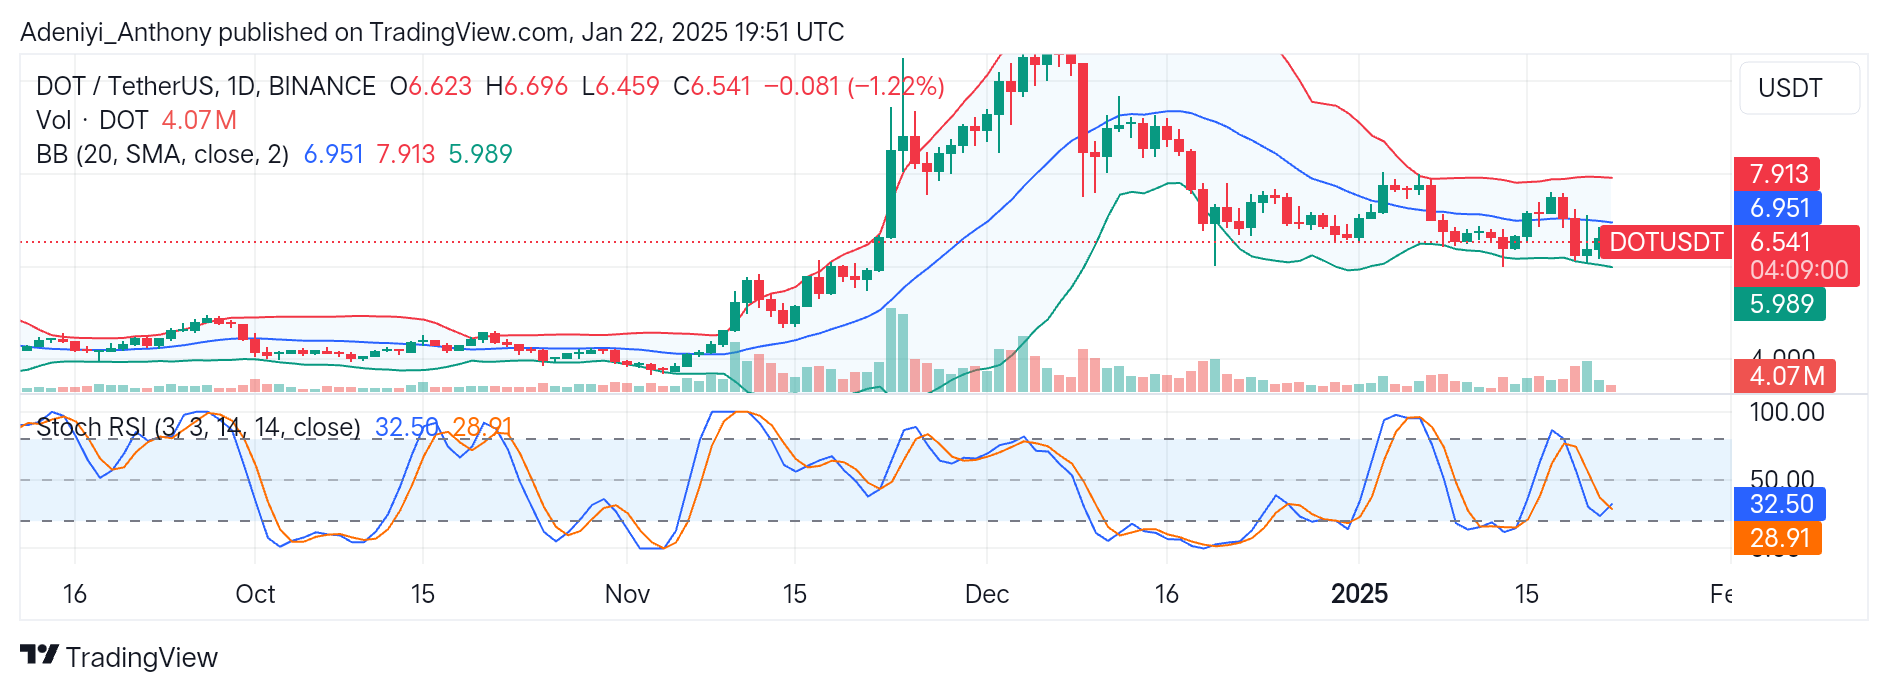
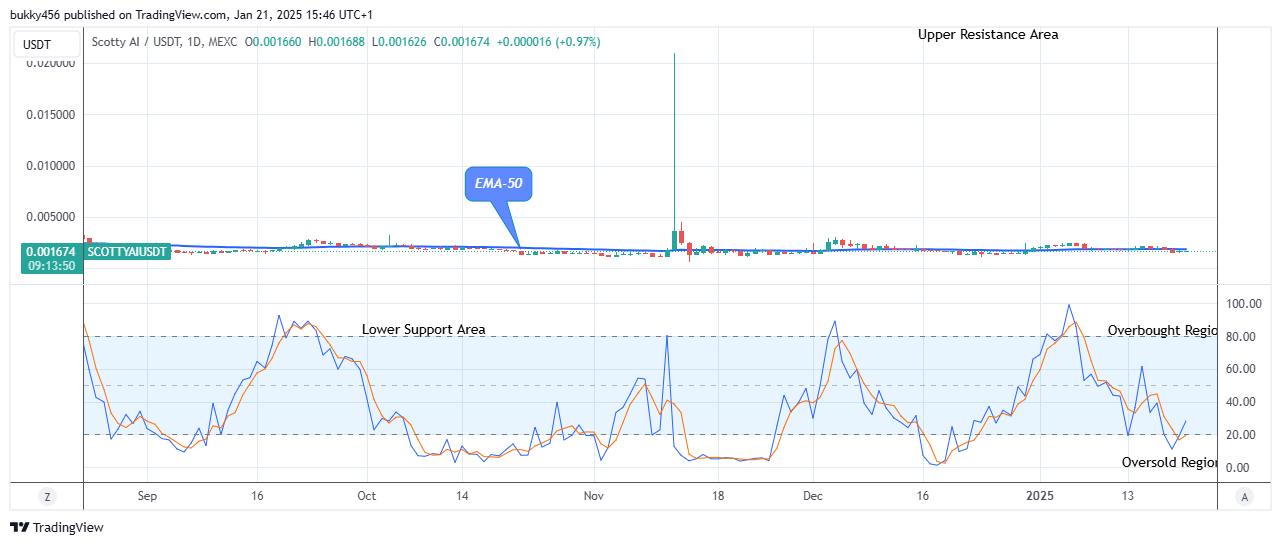
The price responded to the shift in the market structure and is currently trading below the moving averages, suggesting a bearish trend.

The momentum by the short traders at a $0.0014 low mark in the previous action has contributed to its bearish status in its recent price level.

The SCOTTYAIUSD price retracement to a$0.0016 high level below the EMA-50 as the daily chart opens today may surge above the resistance levels.

Thus, a bullish breakout past the $0.0029 high level may surge the price of Scotty The Ai to the $0.021 peak barrier as the bulls anticipate further growth.

In addition, the underlying sentiment regarding the Scotty Ai pair suggests an uptrend continuation. Its price retracement may surge to hit the $0.0210 resistance level in the days ahead, in the higher time perspective.

SCOTTYAI/USD Medium-term Trend: Bearish (4H Chart)

On the medium-term chart, Scotty The Ai price retracement may soon reach the resistance levels as the bulls continue to show potential for more growth. The price seems to have pulled back a little, but the overall trend is still bearish in its medium-term outlook.
Scotty The Ai Price Prediction: SCOTTYAIUSD Price Retracement May Surge above $0.0210 Resistance Level 
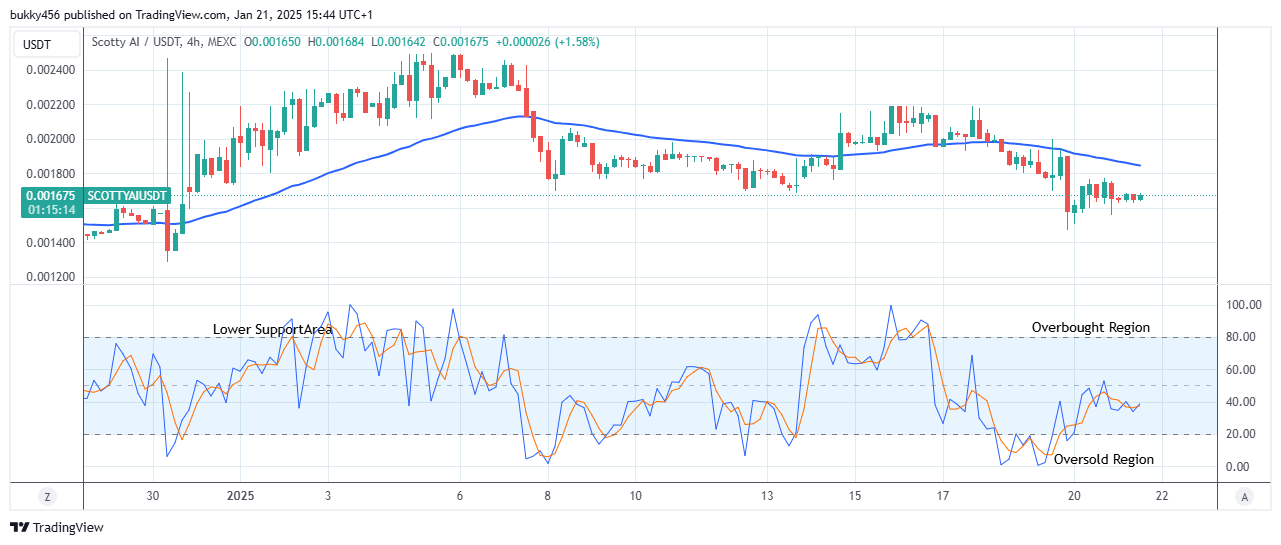
The bears’ sustained pressure at a $0.0014 low value in the past few hours has dropped SCOTTYAIUSD’s price beneath the supply trend lines in its recent high.

Today, the Scotty Ai price retracement at the $0.0016 supply mark below the EMA-50, is an indication that the bulls are actively buying the coin at the moment, giving the coin more strength to push higher.

However, a retracement from the $0.0016 current high could see the SCOTTYAIUSD pair finding support at the $0.0024 peak level before attempting another rally.

Additionally, more upsides are certain, as the price indicator shows that the Scotty The Ai price is in an uptrend. In light of this, the price retracement may surge to hit the $0.0210 high level soon, as the market is poised for more growth in its medium-term outlook.

$SCOTTY is a meme + AI revolution, not just another memecoin! This is what makes it unique

$SCOTTY isn’t just another memecoin—it’s a Meme + AI revolution! Here’s what makes it special:


🐾 Meme Magic: Leveraging viral meme culture to capture attention and hearts.
🤖 AI Innovation: Cutting-edge AI integration, bringing utility beyond memes.
📈 Rug-Free &… pic.twitter.com/rGHIlAZt69

— Scotty The Ai (@ScottyThe_Ai) December 15, 2024

$SCOTTY claim is now live! Stake your claimed tokens below to earn rewards!

Decentraland (MANAUSD) Poised for a More Pronounced Bearish Trend

Price Analysis: Manausd’s Recent Shift From a Bullish Rally to a Bearish Trend Highlights Key Supply and Demand Levels, With a Potential Breach of $0.4550 Signalling Further Downside Risk

MANAUSD has experienced a notable shift in market structure, transitioning from a bullish to a bearish trend in early December 2024. This transition was triggered by a bearish break of structure on the daily timeframe, marking the end of the prior bullish momentum. During the bullish phase, prices climbed towards the $0.7420 supply zone, which acted as a strong resistance level, capping further upward movement. The subsequent rejection at this supply zone initiated the bearish trend, which has since been reinforced by the structural breakdown observed on the daily chart.

MANAUSD Key Levels

Demand Levels: $0.4550, $0.3300
Supply Levels: $0.5930, $0.7420

Decentraland (MANAUSD) Poised for a More Pronounced Bearish Trend
Following the bearish break of structure, price action has displayed a series of key technical developments. Notably, a head-and-shoulders pattern emerged near the daily Bearish order block, further solidifying bearish sentiment and supporting expectations of continued downward movement. This pattern is a classic reversal indicator, adding weight to the anticipation of sustained bearish momentum.

On the 4-hour timeframe, the bearish trend is evident as the price continues to trade below the 4-hour Moving Average. This alignment of lower timeframes with the broader daily trend underscores the strength of bearish control. Until significant bullish catalysts emerge, the trend in this timeframe is expected to persist, potentially influencing the higher timeframe structure.

One critical level to monitor is the $0.4550 demand zone. This level has demonstrated resilience in retesting prices but appears increasingly vulnerable to being breached. A decisive break below $0.4550 would not only validate the bearish trend but also signal a more pronounced continuation of downward pressure. Such a breach could open the door to lower support levels and further bearish extensions in the market.

Decentraland (MANAUSD) Poised for a More Pronounced Bearish TrendMarket Expectation

The market suggests a firmly entrenched bearish trend. Key levels such as the $0.7420 supply and $0.4550 demand zones play pivotal roles in shaping future price action. It is advised to remain cautious, particularly if the price breaks below the critical $0.4550 level. This would likely confirm a more aggressive bearish continuation.

You can purchase Lucky Block here. Buy LBLOCK

Note: Cryptosignals.org is not a financial advisor. Do your research before investing your funds in any financial asset or presented product or event. We are not responsible for your investing results.

IMPTUSDT Price: Bulls Are Taken Over Market

Price will soar towards moon soon

IMPT (IMPTUSDT) Price Analysis – January 23

If sellers add additional assets, the important support level of IMPTUSDT at $0.0049 might be broken downward, and the lows of $0.0047 and $0.0045 might be reached. When buyers acquire momentum, the $0.0052 resistance level may be broken higher, and the $0.0055 and $0.0058 levels may then be tested

IMPTUSDT Market

Key Levels:

Resistance levels: $0.0052, $0.0055, $0.0058

Support levels: $0.0049, $0.0047, $0.0045

IMPTUSDT Long-term Trend: Bullish

Buyers are in charge of IMPT. The price peaked at the resistance level of $0.0067. The price remains constant at the same level for several days. As the bulls gained strength, the price broke through the $0.0045 and $0.0047 resistance levels. It pulled back and retested the $0.0047. The price tested the $0.0049 resistance level on January 9 after breaking through the $0.0047 resistance level. Although the price fell, it is currently trying to break above the previously specified level.

The daily chart indicates that buyers are in control of the market. The price movement has produced a double bottom pattern on the daily chart. At this moment, the price is retracing. If sellers add additional assets, the important support level of $0.0049 might be broken downward, and the lows of $0.0047 and $0.0045 might be reached. When buyers acquire momentum, the $0.0052 resistance level may be broken higher, and the $0.0055 and $0.0058 levels may then be tested. When the QQE MOD’s histogram is more than zero, it signals a buy.


IMPTUSDT Medium-term Trend: Bullish

According to the 4-hour chart pattern, IMPT is bullish. The bulls have been putting pressure on the cryptocurrency’s performance on the 4-hour chart. After the breakthrough in long-term consolidation. The price continues going up. The $0.0065 resistance level was investigated on December 12. The sellers’ pressure prevented the gain, and it is currently testing the $0.0049 level.

It appears that sellers are in control because the price is trading below the Hull suite crypto signal. When the QQE MOD dips below the zero level, it represents a sell signal.

Buy IMPT token on Exchanges!: IMPT (IMPT)


Travel wisely, explore sustainably, and go green.

Zksync (ZK/USDT) Consolidates Around $0.1573 Critical Level

The market for Zksync against the Tether has been trending downward after previous efforts at recovery in recent sessions. However, ZK/USDT seems to be consolidating near a critical level while selling pressure persists.

Recently, Zksync has shown a bearish sentiment as the price is positioned under the Guppy Multiple Moving Averages while the Stochastic Relative Strength Index signals an extensive oversold condition.

Currently, ZK/USDT is trading at $0.1594 with over 54 million traded volumes for the day.

Zksync (ZK/USDT) Consolidates Around $0.1573 Critical Level
ZKUSDT-Daily Chart

Technical Indicators

Major Resistance Levels: $0.1632, $0.1675, and $0.1700

Major Support Levels: $0.1593, $0.1560, and $0.1530

Zksync Technical Analysis

The analysis of Zksync against the Tether on the daily timeframe shows that the pair is experiencing a short-term consolidation. The price movement and the position of the sets of EMAs show that the pair is currently under strong selling pressure. As the volume bar suggests a decrease in buying interest.

On the other hand, the Stochastic RSI at the bottom of the chart indicates an oversold condition for the pair as the lines operate below the 20-mark level.

To this end, a move above $0.1632 will determine a short-term bullish breakout, while a move below $0.1573 will confirm a bearish continuation.

ZK/USDT Analysis: Expectations

The analysis shows that ZK/USDT is prepared to stabilize around the $0.1593 level during the 4-hour timeframe. However, the slight upward-facing short-period EMAs suggest weak bullish attempts, while the positioning of the GMMAs indicates a confirmed bearish trend.

On the other hand, the oscillator indicates an overbought level with potential reversal to the south in the near term as the lines suspend from the 80-mark level.

To this end, ZK/USDT may hit $0.1643 soon if bullish traders step in; otherwise, continued bearish pressure would push the price below $0.1573 if the Stochastic oscillator’s condition persists.

Zksync (ZK/USDT) Consolidates Around $0.1573 Critical Level
ZKUSDT-4-hour Chart


You can purchase crypto coins here. Buy LBlock

Polkadot (DOT/USDT) Positioned for More Upside Gains

Polkadot Long-term Analysis: Ranging

The market for Polkadot against the Tether has experienced an upward momentum, breaking above previous resistance at around $6.200. The current price movement shows a 5% weekly gain after experiencing a minor dip in previous sessions.

However, the Bollinger bands suggest strong impending volatility in the near session, while the Stochastic oscillator signals a cool-off for the pair. This set-up shows a cautiously optimistic market with expectations of further upward momentum if DOT/USDT maintains its current trajectory.

Currently, Polkadot trades at $6.551 with a 4.87% weekly gain.

Polkadot (DOT/USDT) Positioned for More Upside Gains
DOTUSDT-Weekly Chart

Technical Indicators

Major Resistance Levels: $7.100, $7.500, and $8.000

Major Support Levels: $6.166, $6.000, and $5.500

Polkadot Technical Analysis

The analysis of Polkadot against the Tether on the weekly timeframe shows that the pair suspends above the mid-band at $6.166 while moving close towards the upper band at $10.082. However, the Bollinger Bands indicate increased volatility, signaling further gains, while a rejection at the current level might result in consolidation.

On the other hand, the Stochastic RSI suggests more room for an upward movement if momentum builds. However, to avoid significant sell-offs, the volume bar must be monitored.

To this end, a break above $7.000 would indicate a continued uptrend; otherwise, a break below $6.150 would signal a short-term dip.

DOT/USDT Analysis: What’s Next?

The analysis of DOT/USDT on the daily timeframe shows that the price has retraced by 1.22%. This reflects a neutral sentiment as the bulls and bears fight for market dominance, with price hovering around the lower Bollinger bands, showing a potential breakout ahead.

Also, the Stochastic RSI shows that the pair is in the oversold region, pointing to the North, suggesting a possible rebound in the near term.

To this end, DOT needs more bullish participants to push the price above $6.950 to regain momentum, while a break below $6.000 would indicate further downside.

Polkadot (DOT/USDT) Positioned for More Upside Gains
DOTUSDT-Daily Chart


You can purchase crypto coins here. Buy LBlock

$SPONGE (SPONGE/USD) – A Brewing Storm Before the Breakout?

The SPONGE/USD market is undergoing a phase of intense consolidation, resembling the tension of a coiled spring. After a recent bearish dip, the price has stabilized around the $0.000024 mark, accompanied by a notable decrease in volatility. This “volatility squeeze” is often a classic indicator of an impending significant price movement, signaling the potential for a decisive breakout.

Despite the subdued price action, it is essential to highlight that the critical support level at $0.0000006 remains steadfast, with bulls defending the $0.000023 level. This resilience reflects the bulls’ determination to maintain their upward momentum and signals their unwavering commitment to sustaining a bullish trajectory.

Key Market Dynamics:

  • Resistance Levels: $0.00005, $0.000055, $0.000060
  • Support Levels: $0.000020, $0.0000195, $0.000019

$SPONGE (SPONGE/USD) - A Brewing Storm Before the Breakout?

$SPONGE (SPONGE/USD) Technical Analysis

The Bollinger Bands, a key volatility indicator, have tightened significantly, reflecting the SPONGE/USD market’s current state of indecision. This “band squeeze” highlights a fierce struggle between bullish and bearish forces, with neither side asserting a decisive advantage.

A recent spike in trading activity briefly pushed prices toward the $0.00004 level, accompanied by a notable increase in trading volume. However, as outlined in yesterday’s analysis, this upward momentum has been followed by descending peaks, signaling growing selling pressure. Despite this, bulls are steadfast in defending the $0.000024 level.

Interestingly, the trade volume indicator lacks histogram reflections, suggesting that bears may lack the strength to breach the critical $0.000024 support level. This dynamic in the crypto signal underscores the ongoing tug-of-war, with bulls demonstrating resilience amidst mounting pressure.

$SPONGE (SPONGE/USD) - A Brewing Storm Before the Breakout?

$SPONGE (SPONGE/USD) 1-Hour Chart Observations

The Moving Average Convergence and Divergence (MACD) indicator continues to signal a bullish market bias, despite showing signs of a bearish crossover above the zero level. This suggests that while bearish momentum is advancing, the bulls are demonstrating remarkable resilience by maintaining their position against the pressure.

Earlier market activity, characterized by small price spikes, caused the Bollinger Bands’ bandwidth to expand, resulting in increased market swings and oscillations. Despite this volatility, the bulls have successfully defended the $0.000024 level. A potential bounce from this level remains a hopeful possibility, reflecting the bulls’ determination to sustain upward momentum.

Buy $SPONGE!

Join the SPONGE community and be part of the next big crypto sensation! Buy Sponge ($SPONGE) today!

Pepe Unchained (PEPU/USD) Surges as Buyers Step In

In the previous Pepe Unchained market analysis, the $0.01 level was identified as the key point where bullish momentum began to reconsolidate. Increased buying activity around this area has driven the price action upward, now approaching the $0.014 level. However, it is worth noting that this price surge is accompanied by signs of bearish sentiment, contributing to heightened market volatility. Despite this, the bulls maintain control, which has enabled the market to achieve new higher price levels.

Key Levels to Watch:

  • Resistance: $0.013, $0.014, and $0.015
  • Support: $0.010, $0.009, and $0.008

Pepe Unchained (PEPU/USD) Surges as Buyers Step In

Pepe Unchained Price Analysis from an Indicator Perspective

As the Pepe Unchained price action approaches the critical $0.014 level, market momentum appears to be balancing between demand and supply. Notably, the candlestick for the ongoing 4-hour trading session reflects this equilibrium, characterized by a small body with prominent upper and lower shadows. This crypto signal indicates that both buyers and sellers have been active during the session, with the bulls managing to maintain a slight advantage.

Optimistic traders may face challenges at the $0.014 level, as this price point is a significant area of interest. During the previous bearish trend, the market stalled around this level, with bulls attempting to hold their ground before the market moved downward. As a result, $0.014 could act as a formidable resistance. However, if the bulls can defend the $0.012 level effectively, they may build the momentum needed to challenge and potentially break above $0.014.

Pepe Unchained (PEPU/USD) Surges as Buyers Step In

Short-Term Outlook for PEPUUSD: 1-Hour Chart

The bullish recovery is further highlighted in smaller timeframes, where the price steadily rises from the $0.01 threshold, edging closer to the critical $0.014 level. Notably, resistance emerged at $0.0135 as some investors opted to take profits at this level, prompting a temporary correction. However, the bulls swiftly intervened at $0.012, preserving the ongoing recovery.

The significance of the $0.0135 level is evident, as it played a crucial role in previous trading sessions, which explains the resistance encountered there. Breaking through this level is essential for the market to advance toward the $0.014 target. For this to happen, the bulls must maintain firm support at $0.012. Such a stronghold could stabilize market volatility, reducing bearish pressure at the $0.0135 resistance level and paving the way for further upward momentum.

Buy PEPU!

Buy and stake NOW on the L2 for DOUBLE staking rewards! Pepe Unchained (PEPU)