Bitcoin (BTC/USD) Market Shows Signs of Impending Bearish Continuation

Bitcoin Price Prediction – January 16

Bitcoin (BTC/USD) market shows signs of impending bearish continuation. It appears that the price is adhering to a diagonal downward resistance. With the signal line rising above the MACD line and a histogram indicating waning momentum, the Moving Average Convergence Divergence (MACD) indicator exhibits a bearish crossing. With the price trading below the 9-day SMA, now around $95,870, it serves as dynamic resistance and reinforces the negative mood. Furthermore, a negative trend is suggested by the RSI at 43.30, which shows that selling pressure is in control.

BTC/USD Market Key Levels:

Resistance Levels: $100,000, $108,390, $115,000
Support Levels: $85,010, $66,780, $53,500

BTCUSD – Daily Chart

The BTCUSD daily chart reveals an increase in the market’s bearish momentum.

The chart price action reveals a rejection from the $100,000 psychological level, followed by a break of structure (BOS) at $92,000. The lower high formation along the descending trendline reinforces bearish market control.

The support at $85,010 may be tested as the price continues to decline. The recent inability to sustain above $97,050 emphasizes bearish momentum.

Bitcoin (BTC/USD) Market Shows Signs of Impending Bearish Continuation

What is the likely projection of BTCUSD?

Projection-wise, BTCUSD is expected to continue its downward trend toward the $85,010.00 key support level. If this level fails to hold, the next potential target lies around $66,780. The descending trendline and SMA resistance will likely cap any short-term recovery attempts, keeping sellers in control unless a break above $100,000 occurs.

Bitcoin (BTC/USD) Market Shows Signs of Impending Bearish Continuation

BTC/USD – Four-Hour Chart

The BTCUSD pair shows a bearish outlook on the 4-hour chart, with the price rejecting the key psychological resistance at $100,000. The descending trendline reinforces selling pressure, capping recent upward attempts.

MACD’s slight divergence and declining momentum suggest weakening bullish strength. A breakdown below $97,000 could open the path to the next support at $85,000.

Bitcoin (BTC) Current Statistics
The current price: $99,910
Market Capitalization: $2,040,000,000,000
Trading Volume: $69,140,000,000

You can purchase Bitcoin here. Buy BTC

Shiba Inu (SHIBUSD) Poised for a Significant Bullish Trend

Price Analysis: SHIBUSD is Regaining Bullish Momentum, Supported by Key Demand Levels and Rising Indicators

Following the formation of a major low in early August 2024, the SHIBUSD pair began trending bullish, reaching progressively higher price levels. This upward momentum culminated in mid-November 2024 with a significant bullish breakout, as the price swiftly surpassed key demand levels at $0.00002440 and $0.00002980. This surge underscored growing market optimism.

Shiba Inu Key Levels

Demand Levels: $0.00001970, $0.00001500
Supply Levels: $0.00002440, $0.00002980

SHIBUSD Poised for a Significant Bullish Trend

However, by early December 2024, a pivotal shift occurred. The price fell below the daily Moving Average, signaling a bearish trend reversal. This marked a transition to a bearish bias as the market retraced gains, revisiting previously breached demand levels. The downtrend persisted until the price approached the $0.00001970 support zone, where significant buying interest re-emerged. This demand level aligned closely with a bullish trendline, reinforcing its importance as a critical support area.

The $0.00001970 level not only served as a foundation for renewed bullish activity but also marked a turning point as the daily Moving Average shifted to support the upward trend. Prices climbed back above the indicator, signaling a transition to bullish territory. Additionally, the Relative Strength Index (RSI) on the daily timeframe reflected increasing bullish momentum, with rising RSI values confirming heightened buying strength and market participation.

Zooming into the 4-hour timeframe reveals a closer view of recent price action. A notable bullish structure shift has emerged as the price edges toward the $0.00002440 level. Moreover, the presence of a bullish order block at this level is anticipated to trigger further upward momentum, solidifying the onset of a new bullish swing.

SHIBUSD Poised for a Significant Bullish Trend

Market Expectation

SHIBUSD appears to be in the early stages of a bullish swing, supported by technical indicators and key structural shifts. The combination of rising momentum, demand-level strength, and bullish order blocks indicates favorable conditions for continued price appreciation.

You can purchase Lucky Block here. Buy LBLOCK

NoteCryptosignals.org is not a financial advisor. Do your research before investing your funds in any financial asset or presented product or event. We are not responsible for your investing results.

EigenLayer (EIGEN/USDT) Fails to Hold Above $3.477

EigenLayer against the Tether on the daily timeframe has experienced a prolonged downtrend in recent days. After a previous retracement attempt at the mid-band, the pair has failed to break above the $3.477 resistance level.

However, recent price actions show the pair is experiencing a sharp decline, appearing that bearish traders are dominating the market with a 13.36 drop in price from the opening point.

To this end, EIGEN, according to the Stochastic RSI, operates in the neutral zone, suggesting a possible move in either direction.

Currently, EigenLayer is trading at $2.990 with over 5 million trades in volume.

EigenLayer (EIGEN/USDT) Fails to Hold Above $3.477
EIGEN/USDT- Daily Chart

Technical Indicators

Major Resistance Levels: $3.477, $3.530, and $4.212

Major Support Levels: $2.980, $2.741, and $2.600

EigenLayer Technical Analysis

During the daily timeframe, EigenLayer against the Tether has been experiencing a downtrend, as evidenced by the formation of lower highs and lows. However, recent price actions show that price declines further after failing to hold above the mid-Bollinger band.

As evidenced by the appearance of the red candlestick and the price position between the lower segment of the Bollinger bands, the bearish traders dominate the market.

On the other hand, the Stochastic RSI signals the price’s potential to move in either direction, as the lines operate slightly below the 50-mark level.

To this end, if the price fails to hold above $2.980, EIGEN/USDT may see further price dips. Conversely, with the appearance of the oscillator, the pair may retest the $3.477 level if a significant volume of bullish trades occurs.

EIGEN/USDT Analysis: Expectations

On the 4-hour chart, the analysis shows that EIGEN/USDT is trending down, represented by a 1.58% dip in price. The Bollinger bands appear to be shrinking, with the price underneath the lower band. This suggests an impending volatility in the near term.

However, the oversold Stochastic condition indicates a potential rebound is on the horizon if buyers step in. To this end, continuing current momentum would suggest a move towards $2.741, while a break above the lower band would indicate a rebound to $3.281 is possible.

EigenLayer (EIGEN/USDT) Fails to Hold Above $3.477
EIGENUSDT-4H Chart


You can purchase crypto coins here. Buy LBlock

$SPONGE (SPONGE/USD) Bulls Demonstrate Resilience Amidst Recent Volatility

The $SPONGE market recently navigated a period of heightened bearish pressure, driving prices down to a critical support level near $0.000024. This support level, marginally higher than the previous support at $0.000023, proved crucial in stemming the decline. Bulls have been striving to breach the critical resistance level, which has shifted upwards from around $0.00003 to approximately $0.000037. While this upward shift suggests a slight advantage for the bulls, the overall market character remains largely consolidative. A sustained break above the $0.000037 price level is necessary to confirm a bullish trend.

Key Market Dynamics:

  • Resistance Levels: $0.00005, $0.000055, $0.000060
  • Support Levels: $0.000020, $0.0000195, $0.000019


$SPONGE (SPONGE/USD) Technical Analysis

The current Bollinger Bands exhibit a narrowing range between $0.000020 and $0.000037, reinforcing the ongoing consolidation phase. Although price action is currently below the 20-day moving average, this does not necessarily signal a bearish takeover. The $SPONGE market is predominantly consolidating, with the 20-day moving average hovering around $0.000028 and support firmly anchored at $0.000024. While bearish pressure is evident at the $0.000024 support level, the inability of bears to drive prices lower despite weak trading volume histograms suggests a potential for a bullish bounce from this level.

SPONGE/USD 1-Hour Chart Observations

The 1-hour chart reveals a scattered pattern in trading volume histograms, indicative of indecision within the market. This absence of a consistent trend in volume strength is characteristic of consolidation phases, where buyers and sellers engage in a dynamic struggle, resulting in sideways price movement. Despite this indecision, the recurring pattern of strong consolidation periods followed by significant price breakouts suggests a potential for predictable market behavior. Consequently, it is likely that the price will continue to consolidate around its current level before experiencing a potential bounce, potentially targeting the $0.00004 price level.

Buy SPONGE/USD!

Join the SPONGE community and be part of the next big crypto sensation! Buy Sponge ($SPONGE) today!

Pepe Unchained (PEPUUSD) Holds Steady at $0.0137 Amidst Reduced Volatility

The bearish move that began at the $0.018 price level faced significant resistance as strong bullish activity emerged, causing the price to oscillate sharply between $0.013 and $0.018. Over time, the heightened market activity subsided, and Pepe Unchained (PEPUUSD) stabilized around the $0.0137 level.

This crypto signal stabilization, accompanied by a decline in market volatility, suggests that traders remain cautiously optimistic, as bearish momentum has weakened. The pullback from $0.018 found robust support near $0.013, where sustained buying pressure effectively countered the sell-off. Following an intense period of volatility, the market has entered a consolidation phase, with prices steadying around $0.0137.

Key Levels to Watch:

  • Resistance: $0.016, $0.018, and $0.020
  • Support: $0.015, $0.013, and $0.010

Pepe Unchained (PEPUUSD) Holds Steady at $0.0137 Amidst Reduced Volatility

Pepe Unchained Price Analysis from an Indicator Perspective

Technical indicators point to a consolidation phase in the market, with the Bollinger Bands providing a clear illustration of declining volatility. The narrowing of the bands highlights reduced market activity, as the $0.013 level emerges as a strong support zone, offering buoyancy and potential for a rebound.

The trading volume indicator reinforces this observation, as declining histograms suggest waning PEPUUSD market participation. This likely stems from the prolonged tug-of-war during the earlier period of heightened volatility, reflecting indecision about the market’s next move.

A slight bearish bias remains, with the price positioned below the 20-day moving average. However, the resilience shown by the bulls in defending key levels hints at the possibility of a bullish breakout in the near term.

Pepe Unchained (PEPUUSD) Holds Steady at $0.0137 Amidst Reduced Volatility

Short-Term Outlook for PEPUUSD: 1-Hour Chart

On the 1-hour chart, the market shows signs of equilibrium as indecision persists. Recent candlesticks are aligning with the 20-day moving average, indicating a balanced state between buyers and sellers. Trading volume has gradually declined, signaling a temporary lull in activity.

The Relative Strength Index (RSI) further supports this observation, with its line hovering around the midpoint, reinforcing the notion of market equilibrium. This often precedes a strong price movement, with an upward breakout appearing more likely as bulls gain control at the current price level.

Buy Pepe Unchained!

Buy and stake NOW on the L2 for DOUBLE staking rewards! Pepe Unchained (PEPU)

POL (ex-MATIC) Price Prediction: POL/USDT Retreats Below $0.5000

POL (ex-MATIC) Price Prediction (January 18):

POL (ex-MATIC) has recovered from falling below the lower boundary of the symmetrical triangle on the chart. However, its attempt to break through the $0.5000 resistance level was met with selling pressure, causing the market to retreat below the mentioned price level.

POL/USDT Long-Term Trend: Bearish (Daily Chart)

Key Price Levels:

Resistance: $0.5000, $0.6000, $0.7000

Support: $0.4500, $0.4000, $0.3500

POL (ex-MATIC) Price Prediction: POL/USDT Retreats Below $0.5000

The previous session in the POL (ex-MATIC) daily market showed significant bullish momentum with the appearance of a green candle. However, the most recent price candle as of this writing is red, pulling the market back below the $0.5000 mark. Despite this, the price remains above the 20-day and 200-day Moving Average (MA) lines. Additionally, the Stochastic Relative Strength Index (RSI) lines are converging for a crossover above the 70 level, indicating that bullish sentiment could still regain strength.


POL (ex-MATIC) Price Prediction: POL/USDT Could Rise Back Above $0.5000

Price action in the POL (ex-MATIC) daily market has experienced a setback, as reflected in the latest red candle. However, the price remains above most of the MA lines on the chart.

The potential bearish crossover has not yet materialized and could be avoided if buyers regain control near the support formed by the 20-day MA line. This suggests that bullish momentum may still have the potential to recover, but it could require the influence of a strong catalyst to re-establish dominance.

POL (ex-MATIC) Price Prediction: POL/USDT Maintains a Higher Support (4-Hour Chart)

On the 4-hour chart, price action has retraced sharply toward a lower support level, falling below most of the MA lines. However, the price is still holding above a higher support level.

POL (ex-MATIC) Price Prediction: POL/USDT Retreats Below $0.5000

The Stochastic RSI lines are declining sharply into the oversold region, indicating the dominance of bearish momentum. This is further confirmed by price action falling below most of the MA lines. Consequently, the price could approach the $0.4633 mark, where a potential rebound may occur. Any such rebound may require support from a significant market catalyst.

Get POL (ex-MATIC) here. Buy POL 

Scotty The Ai Price Prediction: SCOTTYAIUSD Price Breakout and Bullish Continuation

Scotty The Ai Price Prediction – January 18

The Scotty The Ai market is on the verge of a price breakout and bullish continuation as the bulls are ready to resume the strong uptrend soon. If buyers should trigger their buying pressure and break the $0.021 peak level, the coin price may prolong the correction phase to a $0.028 high level, reflecting a broader cryptocurrency market recovery. Thus, a clear buy signal for the coin holders.

Technical indicators:
Key Resistance Levels: $0.0022, $0.0023, $0.0024
Key Support Levels: $0.0009, $0.0008, $0.0007

SCOTTYAI/USD Long-term Trend: Bullish (Daily Chart)

Scotty, the AI pair is poised for a price breakout and bullish continuation as it just resumed its bullish move in its long-term outlook. The price seems to have pulled back a little, but the overall trend is still bullish in its long-term outlook.
Scotty The Ai Price Prediction: SCOTTYAIUSD Price Breakout and Bullish Continuation
The price is slightly above the EMA-50 line, indicating an upward momentum and the high impact of buyers in the market.

The sustained bullish pressure to a $0.0021 supply level in the past few days has enhanced the Scotty Ai price’s breakout and ensured that it remains above the supply trend levels in its recent correction.

Today, the buy investors rallied upwards to a $0.0020 resistance level slightly above the EMA-50, suggesting an uptrend and a bullish breakout, attempting the $0.021 previous barrier. Thus, more upsides are possible as buyers are seen clustered around, ready to drag the price further.

In addition, under the influence of this market level, the price of SCOTTYAIUSD may experience price breakout and bullish continuation to rise steadily to the previous high of $0.021 level to reach the $0.028 resistance level in the coming days as we watch the crypto market experiencing price breakout and bullish continuation in the long-term perspective.

SCOTTYAI/USD Medium-term Trend: Bullish (4H Chart)

On the medium-term chart, Scotty The Ai indicates a price breakout and bullish continuation as it surges above the resistance line, indicating the bulls’ high impact on the coin. The price bars can be sighted above the supply trend levels, indicating an uptrend.
Scotty The Ai Price Prediction: SCOTTYAIUSD Price Breakout and Bullish Continuation
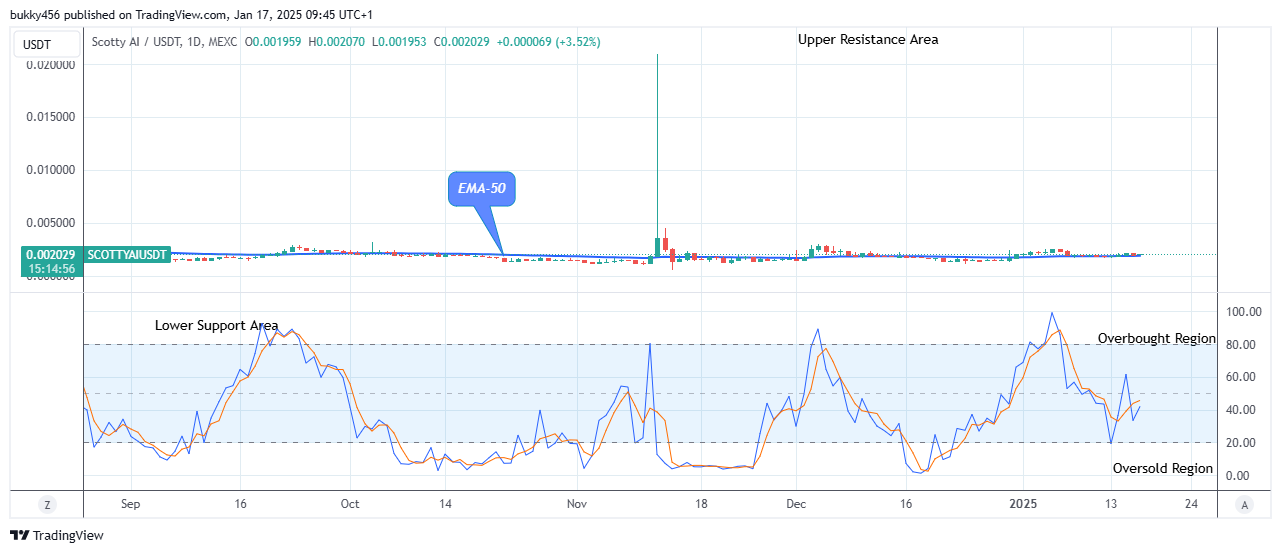
Despite the bears’ influence, the bulls pushed the SCOTTYAIUSD price up to the $0.0019 supply level during the previous session, making it possible for the cryptocurrency to break out and maintain stable upside moves in its recent high.

The bulls corrected the $0.0020 supply value above the moving averages as the 4-hourly chart resumes today, encouraging the buy traders to invest in the crypto, as possible future gains are certain.

Thus, a possible breakout from the current retracement at the $0.0020 neckline will accelerate the buying momentum and push the prices higher to hit the $0.0024 previous resistance level.

Additionally, there is a possibility of a bullish breakout if the bulls should add more effort to their tension in the market as the daily stochastic signal points in an upward direction, indicating an uptrend and a bullish trend continuation. As a result, the next target could be the $0.030 high trend mark soon in the medium-term perspective.

$SCOTTY is a meme + AI revolution, not just another memecoin! This is what makes it unique:

$SCOTTY claim is now live! Stake your claimed tokens below to earn rewards!

Dash 2 Trade Price Predictions for Today, January 18: D2TUSD Preparing for the Next Bullish Rally

Dash 2 Trade Price Forecast: D2TUSD Preparing for the Next Bullish Rally (January 18)

Dash 2 Trade is preparing for the next bullish rally after updating the lows as usual. The crypto has just begun its bullish momentum with a positive performance, touching a daily high of $0.00107 earlier today. Hence, the token price may soar higher and break the $0.00430 high mark if the bullish pressure persists, and the bulls could add more aggression to their buying actions in the market. The target might be the $0.01000 upper resistance value, reflecting a broader cryptocurrency recovery after a downturn, signaling increased buying activity.

Key Levels:
Resistance levels: $0.00107, $0.00108, $0.00109
Support levels: $0.00055, $0.00054, $0.00053

D2T (USD) Long-term Trend: Bearish (Daily)

Dash 2 Trade’s long-term outlook is bearish. In addition, the price is preparing for the next bullish rally as the price trades below EMA-50, indicating that the market is currently in a bearish trend.
Dash 2 Trade Price Predictions for Today, January 18: D2TUSD Preparing for the Next Bullish Rally
The bears’ pressure caused the coin price to drop below the supply trend lines, reaching a low of $0.00096 in yesterday’s session. However, it now seems the bulls are about to take the lead, preparing for the next bullish rally.

The price of D2TUSD responded to the shift in the market structure and is currently below the moving averages at the $0.00107 resistance value as the 4-hourly chart opens today. With this current trend, buyers can pick the token at a lower rate and move the market further.

Hence, should the bulls put additional efforts into their buying motives, the price of D2TUSD could turn positive to retest the previous high of $0.00430, pushing the crypto to the new-high target levels.

Further, continuation to the upsides is likely as the price indicator projects an upward move, implying that the bullish trend will most probably continue, and the pattern might hit the $0.01000 resistance trend line in the upcoming days, resulting in a potential buy signal in its long-term view.

D2T (USD) Medium-term Trend: Bearish (4H)

The currency pair is below the moving averages, suggesting a bearish market sentiment in its medium-term outlook. Thus, the D2TUSD is correcting and will resume its bullishness soon.
Dash 2 Trade Price Predictions for Today, January 18: D2TUSD Preparing for the Next Bullish Rally
The bearish candle at the $0.00095 low value in the previous action has made the coin price trade below the supply levels in its recent correction level.

The market value of Dash 2 Trade jumps up to the $0.00107 high level above the EMA-50 shortly after the commencement of the 4-hourly chart today, indicating that positive sentiment is returning to the market.

Thus, the price of Dash 2 Trade will advance further if the bulls can redouble their efforts and push above the current supply level.

As anticipation builds for the next upcoming surge, the crypto price might surge to retest the $0.00215 peak barrier level, indicating high conviction from coin investors.

Notably, the stochastic oscillator pointing up suggests an uptrend. Thus, we can expect the price of D2TUSD to retest the $0.00215 supply level and increase to a $0.01000 upper supply level in the coming days in its medium-term time frame.

Want a coin that has a huge potential for massive returns? That coin is Dash 2 Trade. Buy D2T now.


Pepe Unchained (PEPUUSD) Stabilizes at $0.0137

Following a bearish market movement after the price peaked at $0.018, we observe the market stabilizing and experiencing reduced volatility around the $0.0137 price level. This suggests that most traders maintain a positive outlook on the market, as the bearish trend failed to extend significantly.

After the bearish price action commenced at the $0.018 peak, a robust support level emerged around the $0.013 zone. This level witnessed a considerable amount of bullish activity, effectively countering the bearish sentiment. Initially, this resulted in heightened volatility as demand and supply forces exerted equal pressure. However, this period of intense volatility has now subsided, with price stabilizing around $0.013.

Key Levels to Watch:

  • Resistance: $0.016, $0.018, and $0.020
  • Support: $0.015, $0.013, and $0.010

Pepe Unchained (PEPUUSD) Stabilizes at $0.0137

Pepe Unchained Price Analysis from an Indicator Perspective

The narrowing of Bollinger Bands, coupled with decreasing candlestick frequency, indicates a decline in Pepe Unchained market volatility, typically signifying the onset of a consolidation phase. Furthermore, diminishing trading volume histograms corroborate this trend. This period of consolidation reflects indecision among traders regarding the market’s direction.

Currently, a slight bearish bias is evident, as price action, while consolidating, has moved below the 20-day moving average. However, the bulls have demonstrated resilience by holding ground against bearish pressure. This resilience may ultimately lead to a bullish rally.

Pepe Unchained (PEPUUSD) Stabilizes at $0.0137

Short-Term Outlook for PEPUUSD: 1-Hour Chart

Analysis of the 1-hour chart reveals ongoing indecision and a tug-of-war in the market. Between 5 pm and 6 pm, a notable spike in trading volume histograms indicated significant activity. However, this period witnessed a balanced struggle between buyers and sellers, resulting in minimal price movement. Subsequently, trading volume subsided, suggesting a potential lull in trader activity. A bullish bounce may be imminent in the coming days.

Buy and stake NOW on the L2 for DOUBLE staking rewards! Pepe Unchained (PEPU)