Dogecoin (DOGE) Price Prediction: DOGE/USDT Retreats Below $0.400 Level

Dogecoin (DOGE) Price Prediction (January 20):

The Dogecoin market recently surged past two key technical price levels. Price action breached the $0.3500 mark and advanced through the $0.4000 resistance level. However, the token’s price has retraced and now stands just above the psychological $0.3500 level.

DOGE/USDT Long-Term Trend: Bearish (Daily Chart)

Key Price Levels:

Resistance: $0.4000, $0.4500, $0.5000

Support: $0.3500, $0.3000, $0.2500

Dogecoin (DOGE) Price Prediction: DOGE/USDT Retreats Below $0.400 Level

As of this writing, the ongoing session has printed minimal gains. Nevertheless, the corresponding price candle is positioned above the $0.3500 threshold. Additionally, the token is trading above the 20-, 100-, and 200-day Moving Average (MA) lines. However, the Stochastic Relative Strength Index (RSI) lines are still descending into the oversold region, indicating lingering bearish sentiment.

Dogecoin (DOGE) Price Prediction: DOGE/USDT Retains Bullish Potential

Price action in the Dogecoin market recently dropped sharply to medium-term support at the $0.3500 level. This support held firm, prompting a minor upward retracement. As a result, the current price of the token now lies above three of the four Moving Average (MA) lines on the chart. Notably, the 50-day MA line is approaching the close of the most recent price candle, along with the 20-day MA.

This indicates that these two MA lines may soon converge below the token’s current price, a development that would strengthen bullish momentum by boosting buyer confidence. Meanwhile, the Stochastic RSI lines remain downward-facing, with the lead line at the 50-threshold level, suggesting the market is in a transitional phase.

Dogecoin (DOGE) Price Prediction: DOGE/USDT Bulls Aim to Extend Dominance (4-Hour Chart)

On the Dogecoin daily chart, price action has rebounded off the $0.3500 baseline. The 4-hour chart further reveals that bullish forces are gaining traction in the new session. The most recent price candle remains green, albeit slightly contracted, and has lifted the token above the 100-day MA line.

Dogecoin (DOGE) Price Prediction: DOGE/USDT Retreats Below $0.400 Level

Moreover, the ongoing session is holding above the $0.3600 level, even as the Stochastic RSI lines continue to descend toward the oversold region. Although the current session places the token’s price between two MA lines, traders might maintain a bullish outlook due to the potential arrival of favorable catalysts in the broader crypto market. As a result, prices could soon reach the $0.4000 resistance level.

Get Dogecoin (DOGE) here. Buy DOGE

COIN (NASDAQ:COIN) Price to Grow More

COIN (NASDQ: COIN) Forecast: January 20

The $COIN price can grow more and see significant gains if investors and analysts continue to show keen interest in the stock market. The stock price is facing the upper resistance level and may likely continue with the high bullish trend, provided buyers don’t give up and increase their momentum pressure in the market. The coin might turn upsides further to a $380.00 high level and beyond, bolstering $COIN’s growth in the stock market amid renewed buying momentum.

Key Levels:
Resistance Levels: $298.00, $299.00, $300.00
Support Levels: $165.00, $164.00, $163.00

COIN Long-term Trend: Bullish (Daily Chart)

Due to mutual growth in market expansion, the $COIN price will grow more as the market shows a promising sign of recovery and remains pressured above the crucial level, implying a significant upward trend in its higher time frame.
COIN (NASDAQ:COIN) Price to Grow More
The sustained order flow by the bulls to the $285.02 supply value in the last session has enabled the stock price to grow and retain its bullish strength in its recent high.

At the time of writing today, the bull race skyrocketed the price of NASDAQ: COIN from $292.00 to a $298.50 high above the moving averages, indicating that the stock price will grow more as the journey proceeds higher on the daily chart. However, buying the shares during this period could prove profitable.

Notably, this sharp dive in the $COIN price accentuates that the excess buying pressure has stabilized, and the price will grow more if the market sentiment doesn’t witness any unfavorable situation.

With this new phase, the NASDAQ: COIN stock market may grow more and see more gains to reach a $380.00 upper high level soon, reshaping the stock market dynamics significantly in its higher time frame.

COIN Medium-term Trend: Bullish (4H Chart)

The NASDAQ: COIN price continues to grow more and gain attention despite the interference from the sell traders on the medium-term outlook. The market price can be seen above the moving averages, implying that buyers are currently gaining more strength in the stock investment.
COIN (NASDAQ:COIN) Price to Grow More
The share have had a series of higher highs and higher lows in the past few hours, which have sustained the bullish impact on the stock market.

However, the current market price of NASDAQ: COIN will grow more as it increases to a $298.92 high level above the EMA-50 as the 4-hourly session opens today, suggesting an improved bullish market sentiment.

Thus, closing the 4-hourly session above the $349.75 barrier will increase the investors’ interest and optimism in the stock, putting the stock
trade more on the buying side.

Next, if additional selling power is prevented, a post-retest rally may drive the $COIN prices high to hit the $380.00 upper resistance soon in its medium-term time frame.

$COIN claim is now live! Stake your claimed tokens below to earn rewards!

BNB (BNB/USDT) Consolidates Near $693.44

BNB Long-term Analysis: Bullish

BNB against the Tether has grown significantly in the weekly timescale, with higher highs and slight dips in previous sessions. However, the current price movement by major indicators suggests that the pair has trouble rising to the north around $693.44.

The indicators on the chart suggest bearish traders may flood the market in the near term. Therefore, caution is advised as the price may move in either direction.

Currently, BNB is trading at $691.30 after a minor 0.29% weekly price dip.

BNB (BNB/USDT) Consolidates Near $693.44
BNBUSDT-Weekly Chart

Technical Indicators

Major Resistance Levels: $693.44, $729.00, and $750.00

Major Support Levels: $682.69, $660.00, and $614.00

BNB Technical Analysis

The analysis of BNB against the Tether reflects a bullish structure with the price holding above the Guppy Multiple Moving Averages (GMMAs), indicating long-term upward strength.

However, the positioning of the lines of the Stochastic RSI suggests a neutral condition as both lines read within the 40-mark level.

From another angle, the declining trading volume shows reduced trading activity, confirming an impending stagnation as prices retrace from $693.44.

To this end, if the price sustains above $690, a breakout above the immediate resistance may be possible; otherwise, a break to the south may be inevitable.

BNB/USDT Analysis: Where From Here?

On the daily timeframe, BNB/USDT is trending downward after experiencing a 2.57% dip in price for the day. The GMMAs, on the one hand, suggest a less volatile market as both sets of EMAs converge, further signaling the pair is acting under selling pressure.

On the other hand, the Stochastic oscillator points downward in a neutral position, indicating that in the short term, the price may dip towards $692.47.

However, with the current participation and outlook, the BNB/USDT market signals indecision among buyers and sellers.

To this end, a break above $693.00 would signal the resurgence of bullish traders in the market. Conversely, a bearish spike in volume would suggest a move to the south.

BNB (BNB/USDT) Consolidates Near $693.44
BNBUSDT-Daily Chart


You can purchase crypto coins here. Buy LBlock

Wall Street Memes (WSM/USD) Price Is Lowly, Pushing for Hikes

Wall Street Memes Price Prediction – January 19

The pushing velocities that depict the representation trade signals between ups and downs in the deals of Wall Street Memes versus the market weight of the US currency have continued to stage between the range-bound zones of $0.0012 and $0.00075, as the base instrument has been found lowly, pushing for hikes in inputs.

Each time that the pairing market tends to shift to the downside of those values, the outcome of the processes has been to produce better longing entries for long-term investors to latch on to. It would be acceptable for sellers to always be cautious of their new position orders in the sideways trading zones, as it has been the true sense of the technical point of the trade as opposed to the bears’ postures.

WSM/USD Market
Key Levels
Resistance levels: $0.0012, $0.0017, $0.0022
Support levels: $0.0007, $0.0005, $0.0003

WSM/USD – 4-hour Chart

The WSM/USD market 4-hour chart mirrors that the crypto-economic price is lowly, pushing for hikes within the zones of $0.0012 and $0.00075.

The indicators have been observed sinking in the oversold area to indicate that the selling force is on the verge of losing out maybe soon after various stochastic oscillator swerving systems have passed through variation points that partially incorporate oversold and overbought areas. It has been noted that the lines of the Bollinger Bands stretch maximum to a lower end against which further candlestick characteristics may not fall stably.
WSM/USD, Wall Street Memes, WSM, Technical Analysis

Then, should the bears in the WSM/USD market try to push over the $0.00075 mark?

It has been overly demonstrated that furthering the efforts to push past the critical support point of $0.00075 will not be in line with technical thinking, as the WSM/USD market’s economy is lowly, pushing for hikes in inputs.

Consistent jerking behaviors to the lower horizontal line at $0.00075 have been present in the current trading signals, creating favorable conditions for strong rebounding forces. It is anticipated that buyers will constantly keep up with the majority of price swings, typically recovering from any given decline before possible long-term uptrend.
WSM/USD, Wall Street Memes, WSM, Technical Analysis

WSM/USD 1-hour chart

The 1-hour chart showcases that the WSM/USD market is lowly, pushing for hikes in inputs.

The hourly setup angle shows that the Bollinger Bands indicators have successfully moved in close proximity to the $0.00075 line. To show that the decreasing force is about to lose, the stochastic oscillators are repositioning at decreased trading zones.

Buy and stake WSM now!: Wall Street Meme (WSM)

ChainLink (LINK/USDT) Prepares for a Potential Breakout

ChainLink Long-term Analysis: Bullish

ChainLink against the Tether maintains a bullish outlook after the recent downside movement, reflecting strong investor interest and potential further gains.

However, recent price action, according to the Stochastic RSI, shows that the pair is consolidating and awaiting a breakout in either direction.

Though the market looks optimistic, fueled by strong rising trading volumes, LINK/USDT must hit above the $25.67 level to confirm a more upside trajectory.

Currently, ChainLink is trading at $22.94 with over 15% weekly gains.

ChainLink (LINK/USDT) Prepares for a Potential Breakout
LINKUSDT-Weekly Chart

Technical Indicators

Major Resistance Levels: $25.67, $28.00, and $30.00

Major Support Levels: $20.16, $17.83, and $16.02

ChainLink Technical Analysis

The analysis of Chainlink against the Tether shows that the pair is experiencing a robust bullish momentum. The Guppy Multiple Moving Averages (GMMAs) on the weekly timeframe suggest an established bullish trend, as the sets of EMAs diverge upward.

On the other hand, the oscillator at the bottom of the chart signals caution, suggesting the market has more room to move in either direction.

To this end, if ChainLink maintains its bullish momentum and breaks above the $24.00 level, it could aim for $28.00 and potentially hit above $30.00. Conversely, if selling pressure increases, the pair’s price could retrace to test the immediate support at $20.16.

LINK/USDT Analysis: What’s Next?

On the daily timeframe, LINK/USDT is experiencing a 4.85% decline in price after reaching a high of $24.60, reflecting some profit-taking actions around the former high.

The GMMAs indicate bullish momentum; however, the pullback could signal a potential pause or retracement towards the immediate support.

On the other hand, the Stochastic oscillator signals an overbought condition for LINK/USDT as both lines lie above the 80-mark level. This may suggest a cool down in the short term.

To this end, LINK could test the $22.35 or $21.85 level in the near term. Conversely, if buyers regain control, the pair could retest $24.60 with an aim at $25.00 soon.

ChainLink (LINK/USDT) Prepares for a Potential Breakout
LINK/USDT-Daily Chart


You can purchase crypto coins here. Buy LBlock

Tamadoge (TAMA/USD) Bulls Regroup At $0.0007

In a surprising turn of events and contrary to expectations, the price of TAMA/USD broke below the critical $0.0008 level, triggering increased bearish sentiment and deepening the downtrend. A significant marubozu candlestick in yesterday’s market illustrated the sharp price drop from $0.0008 to $0.00076. In response, the bulls attempted to recover lost ground by pushing the price upward, but their momentum proved unsustainable. During some of yesterday’s 4-hour trading sessions, the price surged significantly above $0.0008. However, the heightened market volatility caused by the strong bearish move created challenges for the bulls, making it difficult to maintain those gains.

Key Levels

  • Resistance: $0.00085, $0.0009, and $0.00095
  • Support: $0.0007, $0.00065 and $0.0006

Tamadoge (TAMA/USD) Bulls Regroup At $0.0007

TAMA/USD Price Analysis: The Indicators’ Point of View

The breakdown below the $0.00076 level has further increased the TAMA/USD market volatility, which the bears are exploiting to push prices deeper into lower zones. Typically, breaking a major support level like this triggers intensified selling pressure. However, despite the ongoing downward movement, there are signs of emerging bullish activity around the $0.0007 level.

This current market condition presents a compelling opportunity for buyers to capitalize on the dip. Purchasing at this stage could position investors for significant profits if a rebound occurs. In the event of a recovery, the $0.00085 level could serve as the next key target for the market.

Tamadoge (TAMA/USD) Bulls Regroup At $0.0007

Tamadoge Short-Term Outlook: 1-Hour Chart

The last two trading sessions indicate that the bulls are effectively defending the $0.0007 level, rejecting bearish pressure. This activity strengthens the level as a potential formidable support zone. However, the bearish candlesticks in the current trading session highlight the strength of the ongoing bearish momentum.

Repeated rejection of bearish price action at this level would further solidify it as a strong support. One factor contributing to emerging bullish sentiment is the Relative Strength Index (RSI), which signals that the crypto market is heavily oversold. This oversold condition suggests that the market is primed for a potential rally.

Buy Tamadoge!

Buy TAMA today!

$SPONGE (SPONGE/USD) Faces Tight Range, Bulls Await Breakout

The market has recently been confined to a narrow trading range, with prices fluctuating between critical support and resistance levels. The market has successfully established and maintained support at the $0.000024 level while holding steady resistance. However, attempts to break through the resistance zone near $0.000037 have remained unsuccessful. This range-bound movement reflects an ongoing tug-of-war between bulls and bears, with neither side achieving a decisive advantage. A significant breakout above the $0.000037 resistance is essential to signal a potential SPONGE/USD bullish resurgence.

Key Market Dynamics:

  • Resistance Levels: $0.00005, $0.000055, $0.000060
  • Support Levels: $0.000020, $0.0000195, $0.000019

SPONGE (SPONGE/USD) Faces Tight Range, Bulls Await Breakout

$SPONGE Technical Analysis

The Bollinger Bands indicator continues to reflect a steady market condition, as highlighted in the previous analysis. Both support and resistance levels remain stable and unchanged, indicating indecision among traders. Currently, the SPONGE/USD market is trading below the 20-day moving average, although crypto signals have frequently fluctuated around this level. This positioning below the 20-day moving average does not necessarily indicate a bearish trend during this consolidation phase, provided that the price action does not break below the critical support level. The firm support at $0.000024 suggests the potential for a bullish rebound.

SPONGE (SPONGE/USD) Faces Tight Range, Bulls Await Breakout

$SPONGE (SPONGE/USD) 1-Hour Chart Observations

The indicators continue to signal market consolidation, reflecting caution among traders as prices approach key support and resistance levels. This dynamic highlights an ongoing tug-of-war between buyers and sellers, with neither side able to decisively break the major resistance. However, historical patterns suggest that consolidation phases often precede significant price movements. As a result, a breakout from the current range, with a potential target of $0.00004, appears increasingly likely.

Buy $SPONGE!

Join the SPONGE community and be part of the next big crypto sensation! Buy Sponge ($SPONGE) today!

Top Trending Coins for Today, January 18: TRUMP, SOL, ETH, JUP and ONDO

The cryptocurrency market today presents a compelling narrative, with the OFFICIAL TRUMP coin leading the pack due to its unparalleled price action in this trading session. Solana follows closely in the second position, showcasing a strong performance. However, the Ethereum market presents an intriguing divergence, appearing resistant to the upward momentum observed in other trending markets.

To gain a deeper understanding of the forces driving demand and supply in today’s market, let’s delve into a detailed analysis of each of these markets.

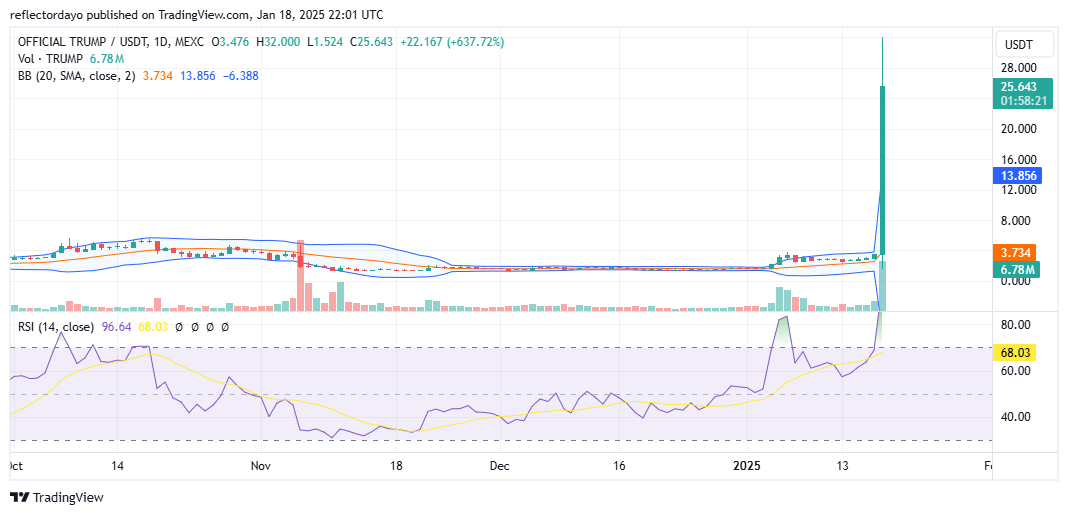
OFFICIAL TRUMP (TRUMP)

Major Bias: Bullish

The OFFICIAL TRUMP market has displayed dramatic and captivating price action in today’s trading session, sparking significant buzz within the crypto community. The market experienced a prolonged consolidation around the $4 price level, with Bollinger Bands tightly contracted—indicative of low volatility and indecision. However, this calm was shattered as the market surged to nearly $30, representing an astonishing 650% gain at its peak.

This meteoric rise triggered a wave of profit-taking and bearish activity, underscoring the crypto signal’s extreme volatility. Bollinger Bands have expanded sharply, signaling a wild rollercoaster of price fluctuations. Despite the correction, the bullish momentum and the underlying fundamentals driving this market remain strong, keeping the market hot and highly speculative.

After months of stagnation, today’s breakout exemplifies how prolonged consolidation can precede explosive price action. Traders should brace for continued volatility as the market unfolds.

Current Price: $26.7

Market Capitalization: $5.3 billion

Trading Volume: $10 billion
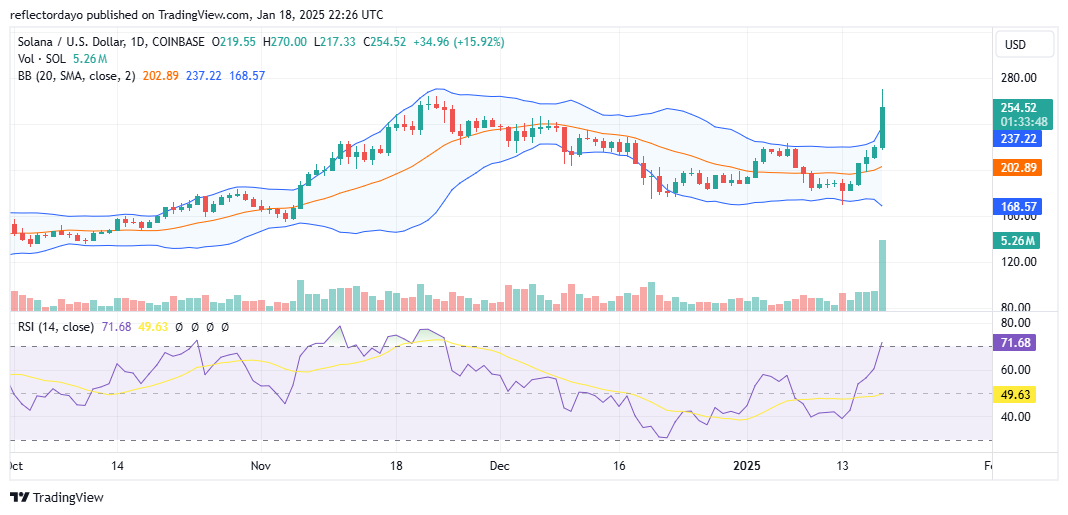
Top Trending Coins for Today, January 18: TRUMP, SOL, ETH, JUP and ONDO

Solana (SOL)

Major Bias: Bullish

The Solana market has demonstrated a trend similar to the OFFICIAL TRUMP market, albeit with less intensity. Ranked second in performance today, Solana’s remarkable surge is likely driven by both technical factors, such as supply and demand dynamics, and fundamental developments. Key catalysts may include recent ecosystem improvements, project launches, and growing interest from institutions and developers.

Technically, the $224 and $240 price levels emerged as significant resistance points but were decisively broken as the price surged to a peak of $270 before profit-taking ensued. The accompanying trade volume histogram highlights robust bullish activity, indicating that buying interest remains high, and market sentiment is heavily biased toward further upward movement.

While the Relative Strength Index (RSI) has entered the overbought region, the substantial trade volume suggests room for continued bullish action, even as the market undergoes a potential correction. Notably, the $240 price level now serves as a strong support zone, likely to sustain market buoyancy despite short-term fluctuations.

Current Price: $254

Market Capitalization: $123 billion

Trading Volume: $21 billion
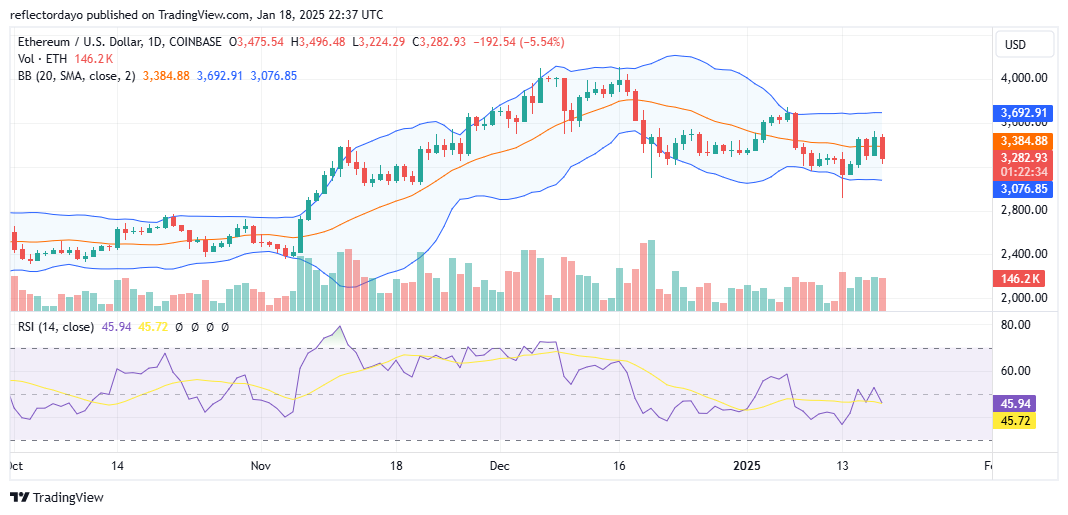
Top Trending Coins for Today, January 18: TRUMP, SOL, ETH, JUP and ONDO

Ethereum (ETH)

Major Bias: Indecision

Surprisingly, the Ethereum market has been consolidating, even as major markets, including Bitcoin, have posted significant gains in recent days. This divergence may be attributed to a combination of factors, including a market focus on Bitcoin, temporary challenges within the Ethereum ecosystem, and Ethereum’s historical tendency for delayed reaction dynamics.

Although this deviation might appear unusual, Ethereum has a track record of catching up to Bitcoin-led rallies. It is likely to experience its own surge once Bitcoin dominance subsides or specific Ethereum-related catalysts emerge.

For much of this week, the Ethereum market has remained below the $3,500 price threshold, reflecting a conservative stance in the broader crypto space. The Relative Strength Index (RSI) suggests market momentum hovering around the indicator’s midpoint, signaling a balanced market sentiment. However, considering the overall bullish behavior of the crypto market, a rise in Ethereum’s price can be anticipated as traders begin accumulating positions.

Current Price: $3,284

Market Capitalization: $394 billion

Trading Volume: $32 billion
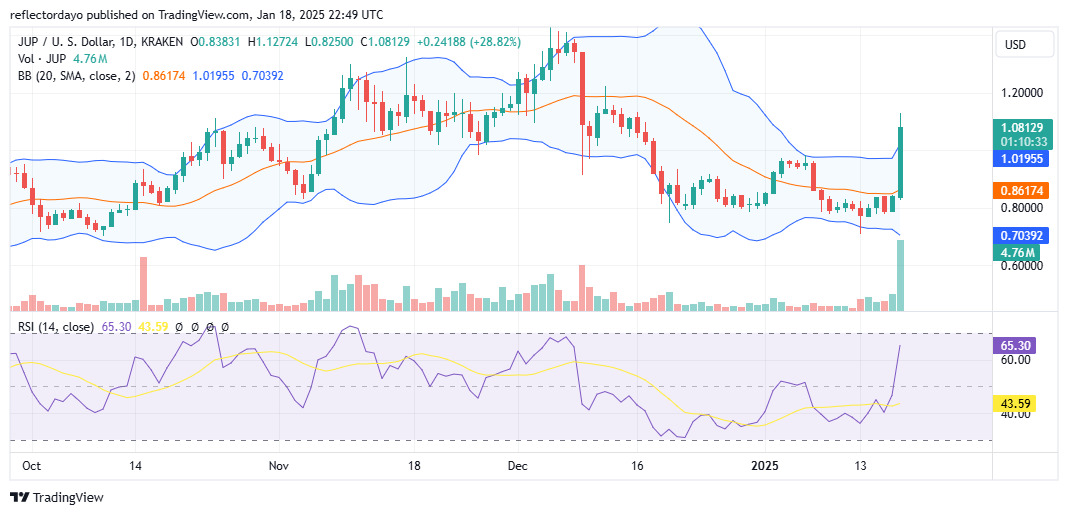
Top Trending Coins for Today, January 18: TRUMP, SOL, ETH, JUP and ONDO

Jupiter (JUP)

Major Bias: Bullish

The Jupiter market is experiencing a price surge reminiscent of Solana’s recent performance. This upward momentum may be attributed to upcoming developments within the ecosystem, building on the strategic project launches introduced over the past year, which have bolstered the market’s impressive performance.

Previously, the market maintained strong support at the $0.80 price level. However, in today’s trading session, a notable shift occurred as bullish momentum surged. This is evident from the large trade volume histogram, which reinforces the credibility of the current bullish candlestick formation.

The market has now broken through a critical resistance level at $1.00, which has been effectively claimed as a significant support level. Should the ongoing correction push prices lower, the $1.00 support is expected to provide stability, with bulls likely stepping in to keep the market buoyant. This level’s resilience underscores the strength of the bullish sentiment driving the Jupiter market forward.

Current Price: $1.0789

Market Capitalization: $1.4 billion

Trading Volume: $1.1 billion
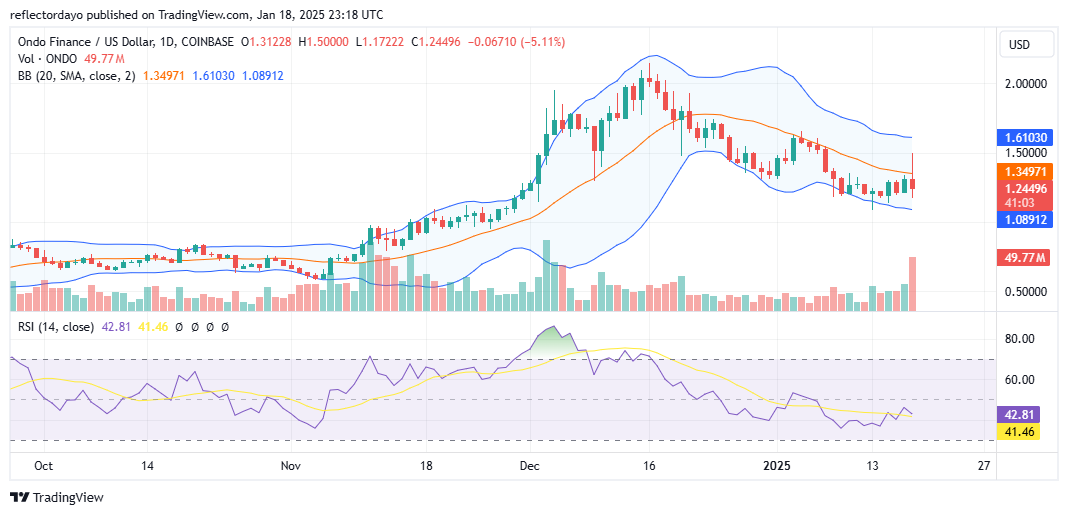
Top Trending Coins for Today, January 18: TRUMP, SOL, ETH, JUP and ONDO

Ondo (ONDO)

Major Bias: Bullish

The Ondo market displayed notable bullish momentum earlier today. The price initially surged from around the $1.19 level, with the $1.50 price point acting as a significant resistance. Despite the strong bullish push, the market failed to break through this resistance, and the price retreated back to the key support level.

The trade volume histogram, however, serves as a testament to the market’s activity and performance in today’s session, highlighting the significant buying interest.

Despite the earlier bullish surge, the Bollinger Bands suggest a downward price channel, indicating that the overall market trend remains bearish. The inability of the bulls to sustain upward momentum, coupled with the rejection at the $1.50 resistance level, may further solidify this price point as a key resistance zone.

Current Price: $1.24

Market Capitalization: $3.8 billion

Trading Volume: $781 million

Top Trending Coins for Today, January 18: TRUMP, SOL, ETH, JUP and ONDO

Trade crypto coins on BYBIT!

Near Protocol (NEAR/USD) Market Approaches Bullish Momentum

Near Protocol Price Forecast – January 17

NEARUSD market approaches bullish momentum based on technical indicators. The price is already nearing a major demand zone at $4.300.

The Relative Strength Index (RSI) on the daily timeframe currently stands at 46.79, slightly below the neutral 50 mark, indicating that the market is transitioning from a bearish to a bullish phase. The Simple Moving Average (SMA) with 9 days is positioned at $5.070, serving as dynamic support for the price. The SMA’s slight upward slope reinforces the potential for a positive price movement as momentum builds. These indicators collectively hint at the possibility of a bullish reversal.

NEAR/USD Market Key Levels:

Resistance levels: $6.490, $8.520, $10.000
Support levels: $4.300, $3.070, $2.450

NEAR/USD – Daily Chart

The daily chart for NEARUSD shows the bearish pressure is waning.

The chart price action demonstrates significant respect for key levels. NEARUSD recently rejected the support zone near $4.300, forming a potential double-bottom pattern, which is a classic bullish reversal signal.

The FVG (Fair Value Gap) zone below the $4.300 level may act as a demand area to attract more buyers. The price has been consolidating just above these support levels, suggesting the accumulation of bullish pressure.

Near Protocol (NEAR/USD) Market Approaches Bullish Momentum

What is the outlook of NEARUSD?

Looking ahead, NEARUSD is projected to retest the $6.490 resistance level, with a potential breakout targeting $8.030, the previous major high. A successful breakout above $6.490 would confirm a continuation of the bullish trend, while a failure to hold above $5.460 could result in a pullback toward $4.870.

Near Protocol (NEAR/USD) Market Approaches Bullish Momentum

NEAR/BTC Price Analysis

Looking ahead, NEARUSD is projected to rally towards the $6.490 resistance level, following a potential retracement to the $4.300 region to gather momentum. A break above $6.490 could open the doors for further bullish continuation, targeting $8.520 and possibly $10.000 in the medium term.

Near Protocol (NEAR) Current Statistics
Current price: $5.220
Market Capitalization: $6,390,000,000
Trading Volume: $334,330,000

Place winning NEAR/USD trades with us. Get NEAR here