Tamadoge (TAMA/USD) Recovers to $0.0008; Poised for a Rebound

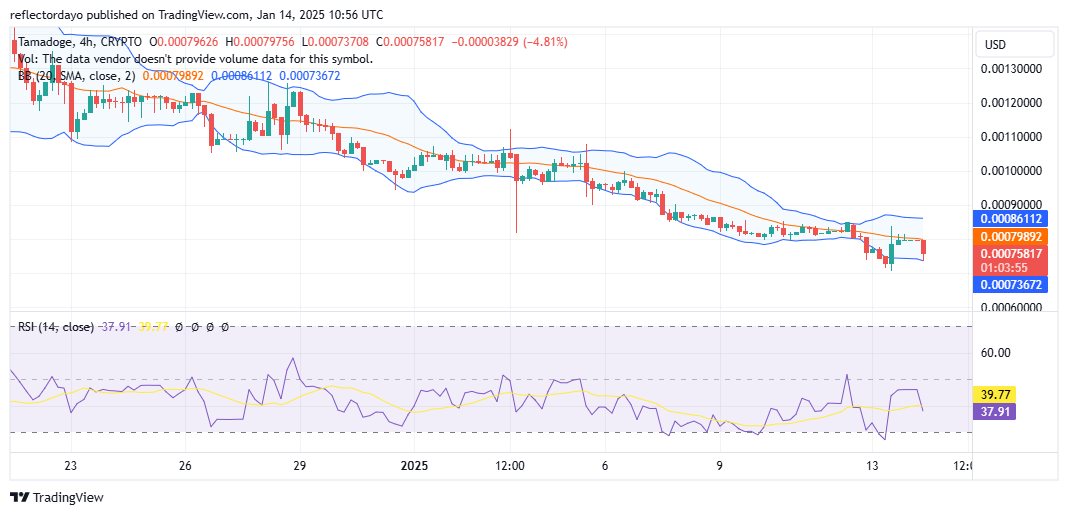
As a result of the recent general cryptocurrency volatility, the TAMA/USD market experienced a decline, breaking below the critical $0.0008 level. The price eventually found support around $0.00073 and subsequently rallied back to the $0.0008 level. While a bearish bias seems to dominate at $0.0008, with some traders opting to sell as the market dipped below this level, this provided a notable opportunity for other investors to buy the dip. This buying activity has contributed to the market’s recovery, bringing it back toward the $0.0008 level.

Key Levels

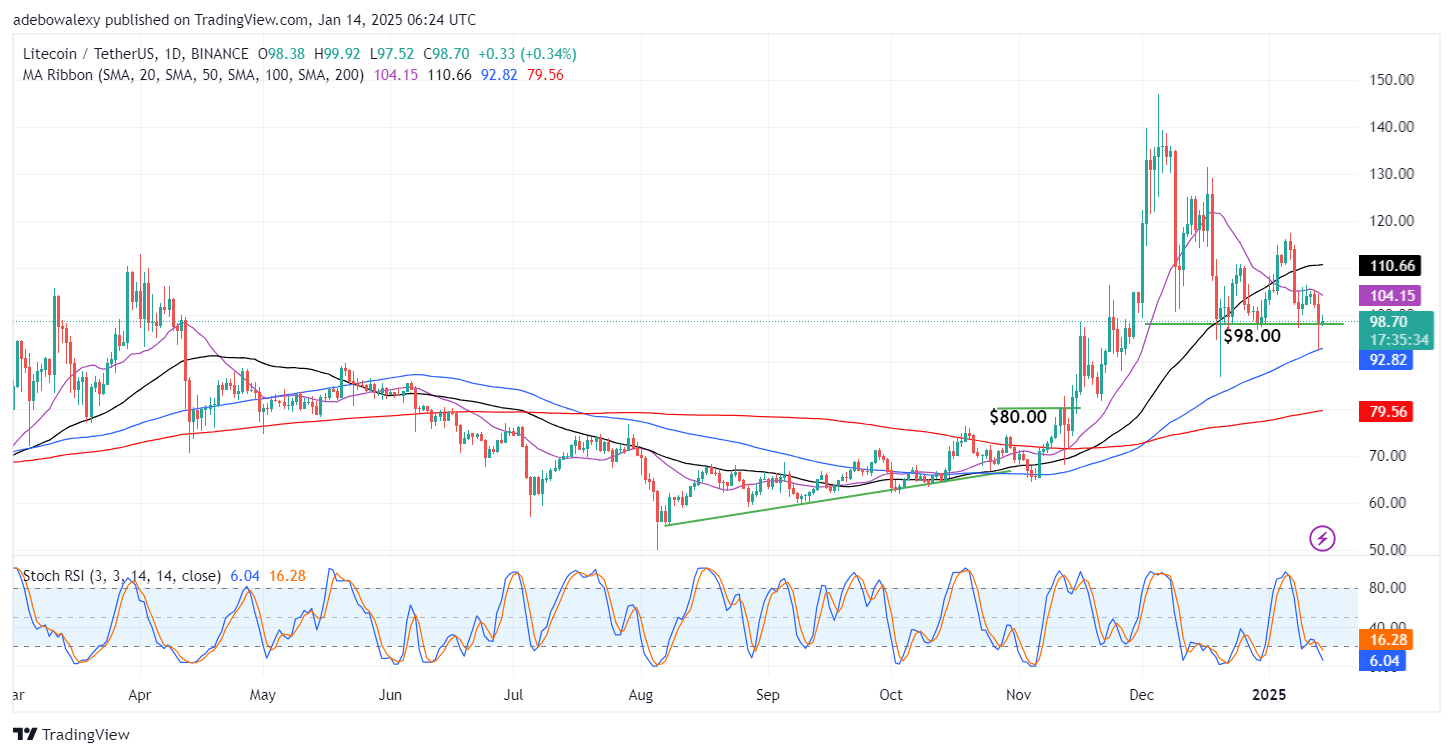
  • Resistance: $0.00085, $0.0009, and $0.00095
  • Support: $0.0008, $0.00075 and $0.0007

Tamadoge (TAMA/USD) Recovers to $0.0008; Poised for a Rebound

TAMA/USD Price Analysis: The Indicators’ Point of View

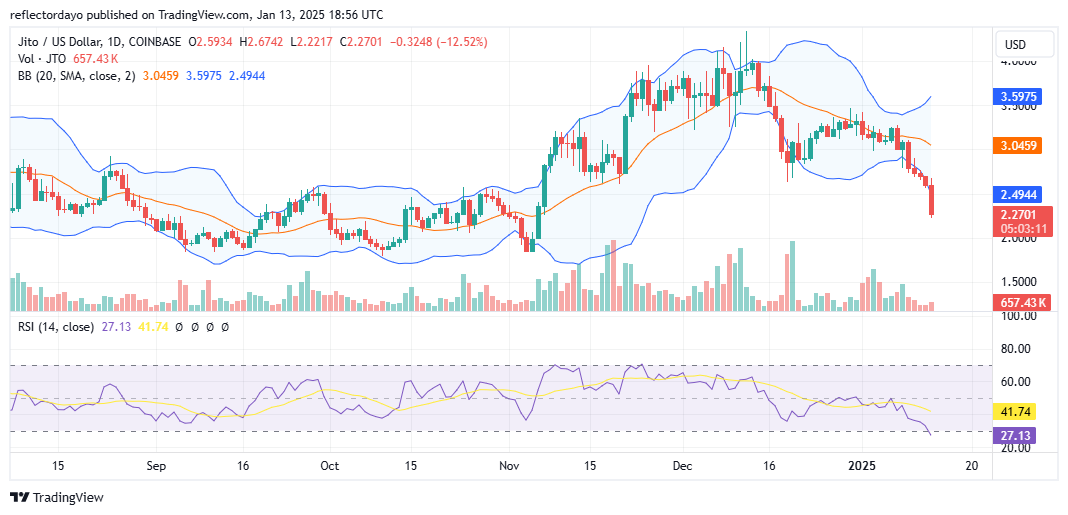
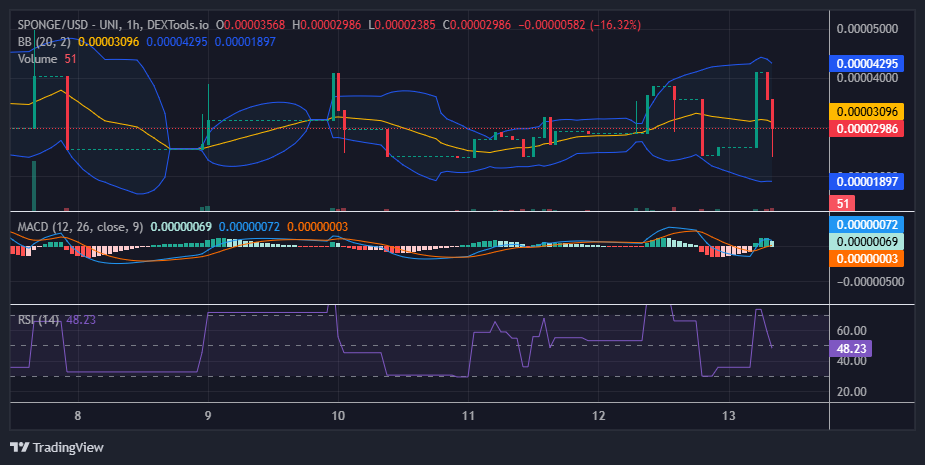
As demand and supply collide around the $0.0008 price level, the strength of the TAMA/USD bulls is becoming increasingly evident, with price action consistently bouncing upward and challenging this level. While the current trading session shows a bearish candlestick, the lower shadow beneath it reflects the bulls’ resilience at these lower price levels, as the price repeatedly rebounds in an effort to reclaim the key $0.0008 level. Observing the Bollinger Bands indicator, which now reflects a consolidating price channel, suggests that the market may continue to consolidate at this level, gradually wearing down bearish sentiment. Once the crypto signal breaks free from this consolidation, it could pave the way for further upward momentum.

Tamadoge (TAMA/USD) Recovers to $0.0008; Poised for a Rebound

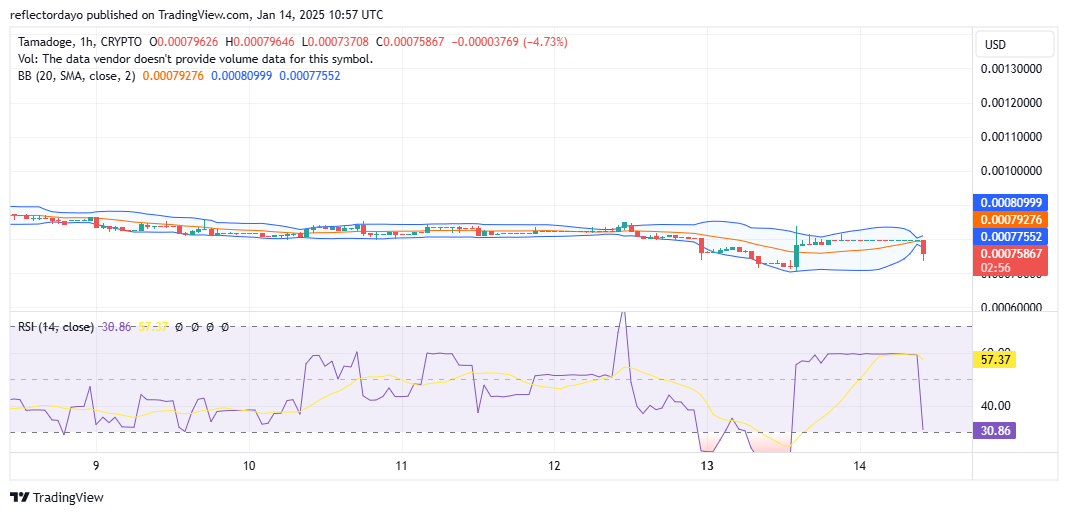
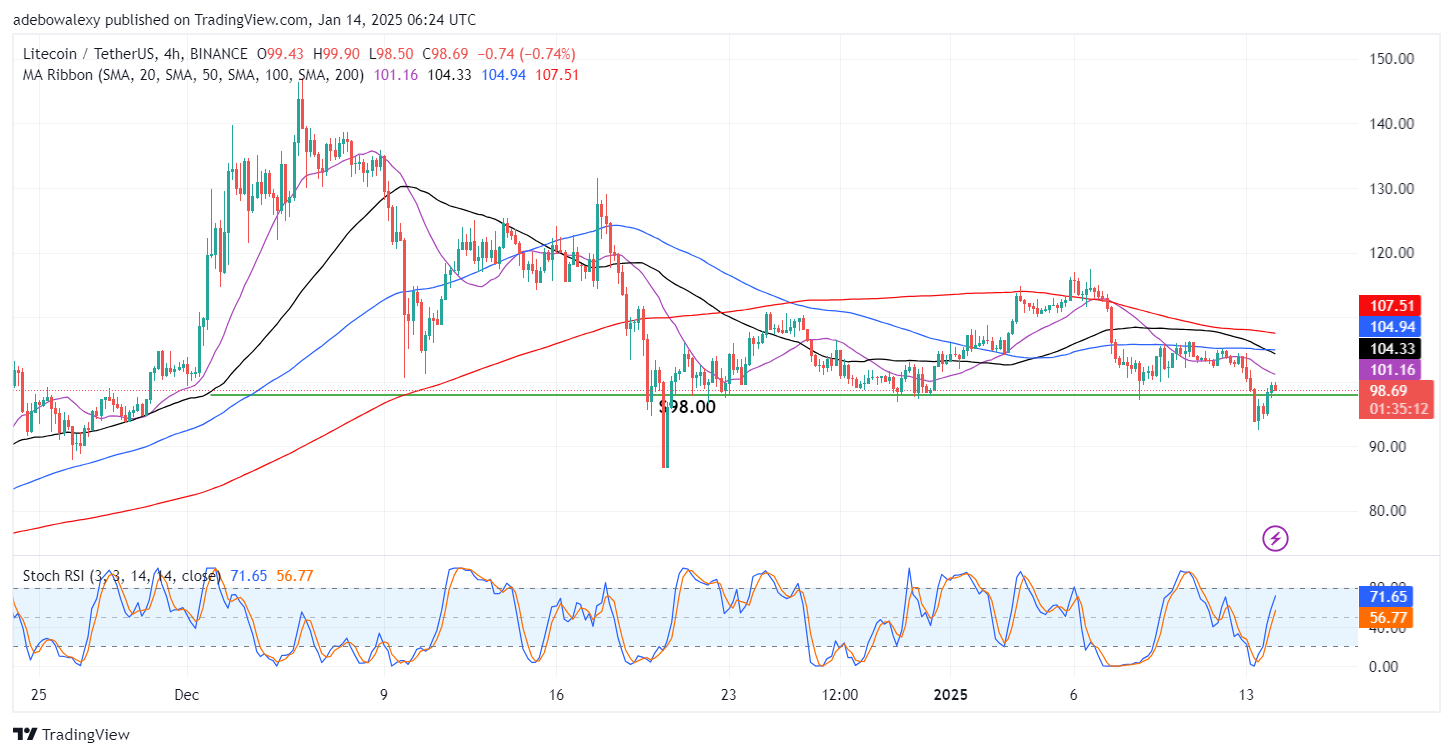
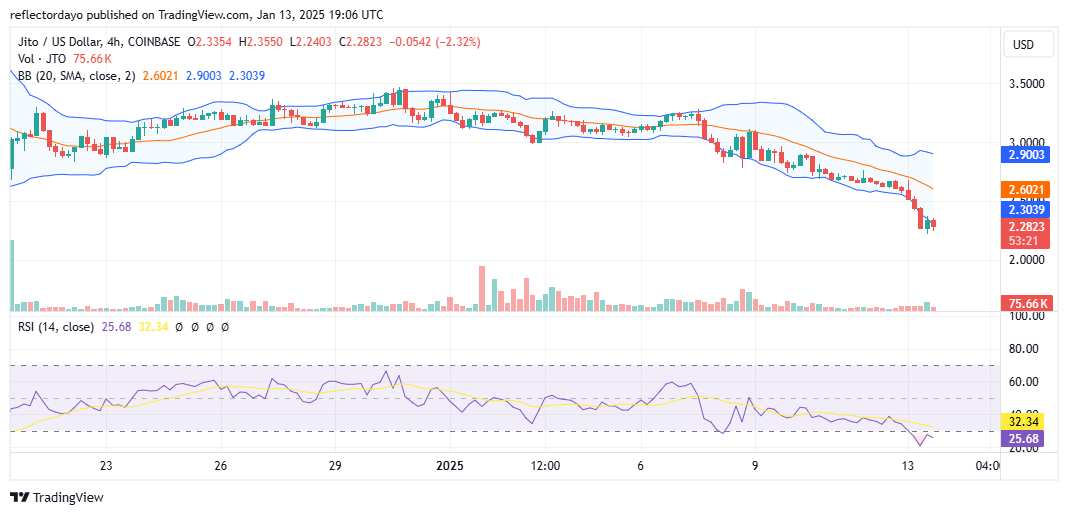
Tamadoge Short-Term Outlook: 1-Hour Chart

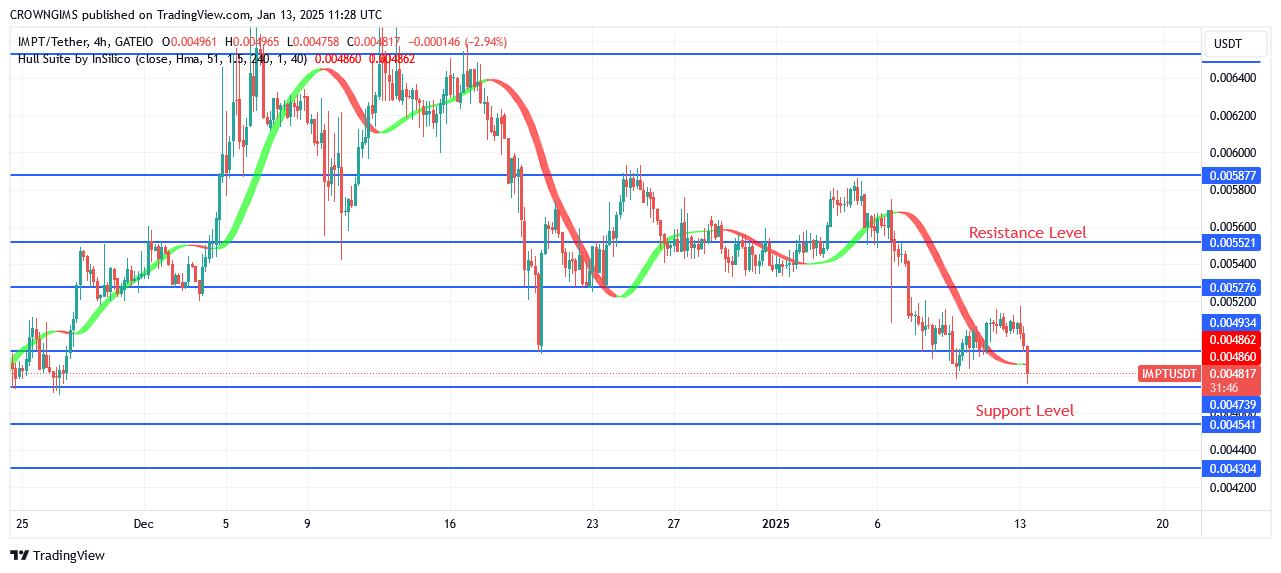
A closer analysis of the 1-hour chart for the TAMA/USD market reveals several trading sessions during which the price remained largely stagnant at $0.0008, following a sharp recovery from below this level. This highlights the significance of the $0.0008 price point for traders in this market. In the current session, bears are attempting to push the price below the $0.0008 level, but this is quickly met with a bullish response, causing a sharp rejection of the lower price. Traders are seizing the opportunity to buy the dip, which is likely to propel the price upward. A break above the $0.0008 level could further strengthen the bullish momentum.

Buy Tamadoge!

Buy TAMA today!

Litecoin Price Prediction: LTC/USDT Market Stays Above the $98 Support Level

Litecoin Price Prediction (January 14):

Despite the significant dip in the Bitcoin market, which represents a major indicator in the crypto market, prices in Litecoin’s daily market remain above the $98 price level. This support zone appears to have become a medium-term support level in the market.

LTC/USDT Long-Term Trend: Bearish (Daily Chart)

Key Price Levels:

Resistance: $100, $110, $120

Support: $90, $80, $70

Litecoin Price Prediction: LTC/USDT Market Stays Above the $98 Support Level

The last price candle on the chart is green as of the time of writing. Although it has contracted downward considerably, it remains above the aforementioned support level. Additionally, the price candle is below the $100 price level. The 20-day and 50-day Moving Average (MA) lines are positioned above the recently appearing price candles. At the same time, the Stochastic Relative Strength Index (RSI) lines are still falling into the oversold region of the indicator.

Litecoin Price Prediction: The $100 Mark Poses a Strong Barrier in the LTC/USDT Market

The last price candle on the Litecoin daily chart is green but appears quite small. Moreover, it has formed below a psychological price level that acts as resistance. Technically, this suggests that market forces are weighing heavily on a potential break above the $100 mark.

Meanwhile, market indicators are not favorably biased at the moment. Consequently, this puts significant pressure on buyers in the session. This pressure is resulting in a bearish contraction, as seen in the last price candle on the chart. Likewise, the downward trajectory of the Stochastic RSI indicator lines suggests that the market may succumb to bearish pressure shortly.

Litecoin Price Prediction: LTC/USDT May Not Progress Too Far Past the $100 Mark (4-Hour Chart)

Even in the Litecoin 4-hour market, price action has rebounded off the $100 resistance level. Additionally, the market is below all the MA lines. Nevertheless, the Stochastic RSI indicator lines are still progressing upward, though the lines seem to be moving more significantly than the price action on the chart.

Litecoin Price Prediction: LTC/USDT Market Stays Above the $98 Support Level

Furthermore, the 50-day and 100-day MA curves are crossing above the price action, indicating that downward forces are strengthening. Technically, indications from this market suggest that upside forces may soon be exhausted, even if price action eventually breaks through the $100 price level. Bullish traders should target the $110 price level for short-term gains.

Get Litecoin here. Buy LTC

Dash 2 Trade Price Prediction for Today, January 14: D2TUSD Anticipates an upside Reversal

Dash 2 Trade Price Forecast: D2TUSD Anticipates an upside Reversal (January 14)

Today, the D2TUSD market structure anticipates an upside reversal. The coin price may reverse and turn around soon. The selling pressure may subside, and the coin price could continue and remain bullish. Based on the outlook, a positive breakout confirmation reflecting the increased market sentiment will occur should the bulls exchange hands with the sell traders at the $0.00127 current support and turn the coin price positive to the $0.00430 barrier line. Doing so will offer a higher footing for buyers to prolong this recovery, reaching the $0.01000 upper resistance level, signaling the potential for significant gains as the uptrend resumes soon.

Key Levels:
Resistance levels: $0.00145, $0.00146, $0.00147
Support levels: $0.00127, $0.00126, $0.00125

D2T (USD) Long-term Trend: Bullish (Daily)

D2TUSD anticipates an upside reversal in its long-term view. The price is in red above the EMA-50, indicating an uptrend and the high impact of buyers in the market.
Dash 2 Trade Price Prediction for Today, January 14: D2TUSD Anticipates an upside Reversal
The sustained bullish pressure in the past few days has kept the cryptocurrency price at its recent level above the supply trend levels.

Actions from the short traders dropped the crypto price to a low of $0.00127 above the resistance line as the daily chart opens today. Hence, buyers must step up their efforts to predict a bullish rise in the market above the $0.00430 previous high level.

Additionally, the Dash 2 Trade pair indicates an uptrend on the daily stochastic, suggesting a possibility of an upside reversal at the $0.00127 support level. As a result, the price of Dash 2 Trade could pump or surge upsides to hit the $0.01000 upper resistance value soon in its higher time frame.

D2T (USD) Medium-term Trend: Bullish (4H)

Despite the interference of sellers, the D2TUSD pair remains in a bullish trend market in the medium-term outlook.
Dash 2 Trade Price Prediction for Today, January 14: D2TUSD Anticipates an upside Reversal
Meanwhile, the current price of Dash 2 Trade at a $0.00217 low value above the supply trend lines has not stale the market condition of the coin as it remains intact. Further, investors may seize the opportunity to buy the coin at a lower price and look for more gains.

All eyes are on the $0.00265 previous barrier, but sellers’ congestion at the $0.00127 low value has become impenetrable.

Thus, if the bulls can change their orientation and add more strength to their buying power, the coin may turn positive and close above this level, resulting in a turnaround for D2TUSD buy traders.

Further, staying above the supply levels will give the D2TUSD pair the tendency to experience an upside reversal at the $0.00127 current support level. As a result, the crypto price may turn upside to hit the $0.01000 upper high mark soon in its medium-term perspective.

The Best Backtested Bots of the Week. These machines are producing amazing outcomes. Are you prepared to create your own successful plan? Try it out on Dash 2 Trade right now!

📊 This Week’s Top Backtested Bots


Leading the pack:
$AAVE Grid +24.16% gains!
🚀 $XMR Grid +15.81%!

These bots are delivering incredible results. Ready to build your own winning strategy?

Test it now on Dash 2 Trade!

👉https://t.co/XGONAuNkPM pic.twitter.com/YT02KJSW8M

— Dash 2 Trade (@dash2_trade) January 6, 2025

Want a coin that has a huge potential for massive returns? That coin is Dash 2 Trade. Buy D2T now.


U.S. Court Tells SEC to Explain Its Rejection of Coinbase’s Crypto Rules Request

The Securities and Exchange Commission (SEC) has been asked by the United States Court of Appeals to explain its decision to deny Coinbase’s request for cryptocurrency-specific rules.

The organization was chastised by the court for failing to provide specific justifications, but it was not ordered to draft new regulations. This case highlights the ongoing debate between Coinbase and the Securities andCover how to regulate the crypto industry.

The Court’s Decision on SEC Actions

Coinbase requested the exchange Comis  in 2022 for clear standards for the crypto industry, but the SEC declined the request, claiming that present regulations already apply to crypto. The court deemed this ruling “arbitrary and capricious” because the SEC did not provide adequate justification. It sent the case back to the orgfor further review but did not require new rules to be made.

U.S. Court Tells SEC to Explain Its Rejection of Coinbase’s Crypto Rules Request
The U.S. Securities and Exchange Commission (SEC).

The SEC has argued that creating specific crypto rules isn’t necessary and said its resources should focus on larger financial markets. However, the court said the the commission must give stronger reasons for ignoring Coinbase’s request. Judge Stephanos Bibas added that old financial rules don’t fit with new crypto technologies, raising fairness and constitutional concerns. 

Broader Implications

Coinbase believes the SEC’s actions are unclear and unfair, making it hard for companies to follow the rules. The Securitie and Exchange Commission has introduced some guidelines for crypto, like requiring custodians to meet specific standards. However, Coinbase says these don’t suit the unique nature of digital assets.

U.S. Court Tells SEC to Explain Its Rejection of Coinbase’s Crypto Rules Request

This decision is a step toward holding the SEC accountable for its crypto regulation management. As the industry grows, clearer rules could help companies and regulators navigate this new financial space.


In order to place winning trades with us via Bybit, you can open an account here.

MoonPay Buys Helio for $175 Million to Grow Crypto Payments

MoonPay, a crypto payments company, has paid $175 million for Helio, a distributed ledger payment processor, Helio. This is MoonPay’s largest transaction yet, and it will help the company extend its services by utilizing the company’s tools for less expensive and quicker cryptocurrency payments. The acquisition emphasizes the growing role of decentralized finance (DeFi) in changing traditional financial institutions.

MoonPay’s Vision for Growth

MoonPay’s acquisition of Helio aims to improve crypto payments. Helio’s technology supports quick and affordable transactions on platforms like Shopify and Discord. However, Stijn Paumen, Helio’s CEO, has stated that by joining forces with MoonPay, Helio aims to replace slow and costly payments with modern, decentralized solutions.

MoonPay Buys Helio for $175 Million to Grow Crypto Payments

In recent years, MoonPay has collaborates with major payment platforms like PayPal and Venmo, allowing users to buy cryptocurrencies easily. MoonPay, however, aims to provide more effective and safe tools for cryptocurrency trading, e-commerce, and other online markets using Helio’s experience. In light of this, MoonPay CEO Ivan Soto-Wright has stated that this action would improve their capacity to offer dependable payment solutions to both individuals and enterprises alike.

What This Means for the Crypto Industry

In addition to being a significant step for MoonPay, this acquisition is a sign of the potential growth of the cryptocurrency industry. Donald Trump, the president-elect, has pledged to make the United States an international leader in cryptocurrency, and his business-friendly policies may lead to further collaborations and commitments in the crypto sector, which would facilitate innovation and growth for businesses in the digital space.

MoonPay’s purchase of Helio shows the growing importance of Decentralized Finance (DeFi) and the push for a faster, more affordable payment system. This deal could pave the way for more exciting changes in the crypto world.


In order to place winning trades with us via Bybit, you can open an account here.

JITO (JTO/USD) Bounces Back From Four-Month Lows

The critical $2.5 price level has served as a significant support zone in the JITO market for approximately four months, consistently holding the price above itself and the $3.00 level. In December, the bearish momentum noticeably slowed as the price approached this key level, even triggering a rebound. This price behavior highlights the strong bullish bias prevalent around this area.

However, despite this resilience, today’s trading activities reveal that the market has broken below this critical support level amid significant downward volatility in the broader crypto market. This breakdown may present an opportunity for investors to buy the dip and potentially facilitate a rebound.

Jito Market Data

  • JTO/USD Price Now: $2.27
  • JTO/USD Market Cap: $642 million
  • JTO/USD Circulating Supply:281.7 million JTO
  • JTO/USD Total Supply: 1 billion JTO
  • JTO/USD CoinMarketCap Ranking: #120

JITO (JTO/USD) Bounces Back From Four-Month Lows

Key Levels

  • Resistance: $3.00, $3.30, and $3.50
  • Support: $2.00, $1.80, and $1.50.

The Jito Market Through the Lens of Indicators

Since January 9, when the market broke below the critical support level at $3.00, downward volatility appears to have been triggered. This is evident in the expansion of the Bollinger Bands, signaling increased market volatility as the bearish crypto price action drives the market lower.

Examining the candlestick patterns, January 9 reflected strong selling activity, which set the tone for subsequent bearish moves. Similarly, today’s trading activity, January 13, has also shown significant selling pressure, causing the price to break below the critical $2.50 support level—a key bullish stronghold.

At this stage, there are signs that the bearish momentum may be nearing its climax, despite the general downward trend in the broader cryptocurrency market. With the market currently trading at $2.27, this level could present a compelling opportunity for Jito investors to buy the dip. Indicators such as the Bollinger Bands and the Relative Strength Index (RSI) are signaling oversold conditions, suggesting a potential market reversal.

As selling pressure begins to subside, it may pave the way for renewed buying interest, potentially triggering a strong upward swing. Historically, intense selling action often precedes robust buying activity, which could lead to a significant market recovery.

JITO (JTO/USD) Bounces Back From Four-Month Lows

JTO/USD Price Prediction: 4-Hour Chart Analysis

From the perspective of the 4-hour chart, the market remains under strong selling pressure, with the Bollinger Bands indicator reflecting a downward-trending price channel. However, a lower support level appears to be forming around $2.27. Bullish activity at this level has successfully rejected bearish pressure over the past two to three trading sessions.

This emerging support suggests that buyers may hold their ground here, potentially resisting the prevailing bearish momentum. If this support level holds, it could pave the way for a strong bullish price move.

The market appears primed for a potential bounce, as the Relative Strength Index (RSI) currently sits below the 30 level, signaling oversold conditions and hinting at the possibility of a reversal.

Trade crypto coins on BYBIT!

$SPONGE (SPONGE/USD): Resilient Amid Market Volatility

The $SPONGE market appeared primed for an uptrend, as highlighted in the previous analysis. The market demonstrated strong bullish potential, with the price holding steady at $0.000023. However, renewed bearish pressure emerged at the $0.00004 resistance level, resulting in a significant rejection at that point.

There was also a marginal shift in the support level, moving from $0.000023 to approximately $0.000025. This adjustment reflects lingering bullish sentiment in the market, despite facing considerable volatility.

Key Market Dynamics:

  • Resistance Levels: $0.00005, $0.000055, $0.000060
  • Support Levels: $0.000020, $0.0000195, $0.000019

$SPONGE (SPONGE/USD): Resilient Amid Market Volatility

$SPONGE (SPONGE/USD) Technical Analysis

While many markets are feeling the impact of the downward volatility sweeping across the broader cryptocurrency sector, the $SPONGE market has demonstrated resilience, maintaining stability around the $0.000024 price level. Notably, the Relative Strength Index (RSI) indicates a balanced crypt0 signal, with buying and selling forces in equilibrium, as the RSI line settles near the midpoint of the indicator.

Additionally, the trade volume indicators show smaller histograms, suggesting a decline in trading activity as both demand and supply wane. This reduction in activity could signal that the market is poised for renewed bullish momentum.

$SPONGE (SPONGE/USD): Resilient Amid Market Volatility

$SPONGE (SPONGE/USD) 1-Hour Chart Observations

On a shorter timeframe, such as the 1-hour chart, the Bollinger Bands reveal a more active and volatile $SPONGE market, characterized by significant price swings. Notably, there was a sharp surge in price from $0.000025 to nearly $0.000030, highlighting bullish activity during this period.

With the 20-day moving average currently positioned around the $0.000030 level, there are strong indications that the market may establish support at this point. The indicators suggest a potential convergence of price action around this level, further reinforcing the likelihood of stabilization.

Buy SPONGE/USD!

Join the SPONGE community and be part of the next big crypto sensation! Buy Sponge ($SPONGE) today!

From Valley to Mountain: Solana’s Two-Year Rally

Two winters ago, Solana (SOL) traded in the icy depths of a crypto winter, languishing as the 18th largest coin, its price shivering between $9.99 and $11.16. January 2nd, 2023, it found it huddled at a meager $4.1 billion market cap, still reeling from the twin earthquakes of Terra and FTX that had shattered the crypto world. Bitcoin itself was shivering below $17,000, and the entire crypto market, a once-mighty kingdom, was reduced to a mere $832 billion.

But then, a remarkable resurgence began. Fueled by a thriving ecosystem and an explosion of meme-coin mania, Solana embarked on a dramatic price climb. Its L1 blockchain, renowned for its speed and affordability, became the breeding ground for a new breed of playful tokens—BONK, FRONK, POPCAT, and their mischievous kin. Solana, once a forgotten corner of the crypto realm, had found a new lease on life, dancing to the infectious rhythm of meme-coin fever.

From Valley to Mountain: Solana's Two-Year Rally

In January 2024, a lighter fluid was splashed onto the Solana fire: Pump.fun. This user-friendly, decentralized platform made creating and trading meme tokens a breeze. The result? A record-breaking inferno of on-chain transfer volume, reaching a scorching $318 billion by November 2024. The party wasn’t just for whales; the number of active addresses on Solana skyrocketed from a modest 12.7 million in early 2023 to a bustling 123 million by year’s end. This surge was fueled by the infectious energy of meme tokens and the ease of use offered by platforms like Pump.fun.

From Valley to Mountain: Solana's Two-Year Rally

Solana’s Spectacular Rise and Uncertain Future

Solana’s comeback has been nothing short of spectacular. By December 31st, 2024, a single SOL token commanded a hefty $196, a staggering 1,656% leap from its January 2nd, 2023 nadir of $11.16. While still shy of its November 23rd, 2024 peak of $263, this resurgence is impressive. A year ago, SOL traded at a comparatively modest $107.88. Today, its market capitalization eclipses $94 billion, claiming a substantial 2.87% slice of the burgeoning $3.28 trillion crypto market.

This dramatic turnaround underscores the remarkable resilience of blockchain ecosystems. Solana’s ability to recover and attract new users and developers exemplifies the crypto industry’s relentless evolution. However, its future is not without challenges.

Solana’s future is a tightrope walk between innovation and stability. Can it maintain its breakneck pace while navigating a crowded crypto landscape? The jury’s still out on the longevity of its growth. Its current reliance on meme coins and volatile platforms like Pump. fun is a double-edged sword. Sure, they’ve fueled the recent surge, but their speculative nature makes them susceptible to crashing down, potentially dragging Solana with them.

History teaches us a harsh lesson: blockchains that prioritize short-term gains over long-term stability often falter. To truly reign supreme, Solana must strike a delicate balance between cutting-edge development, unwavering reliability, and fostering a strong, engaged community. Only then can it secure investor confidence and solidify its position as a crypto leader..

IMPTUSDT Price: Sellers Reject Further Increase at $0.0055

There is a Bearish engulfing candle signal

IMPT (IMPTUSDT) Price Analysis – January 13

In case sellers put in more asset the key support level of $0.0047 may be broken downside and the low of $0.0045 and $0.0043 may be reached. When buyers increase their momentum, resistance level of $0.0049 may be broken upside then, $0.0052 and $0.0055 levels may be tested.

IMPTUSDT Market

Key Levels:

Resistance levels: $0.0049, $0.0052, $0.0055

Support levels: $0.0047, $0.0045, $0.0043

IMPTUSDT Long-term Trend: Bearish

IMPT is under sellers’ control. The price peaked at the resistance level of $0.0067. The price consolidate for many days at the same level. The bears gained momentum and push the price to break down the support levels of $0.0055 and $0.0052. It pulled back and retest the $0.0055. The price break down the support level of $0.0049 and tested the support level of $0.0047 on January 9. The price pulled back but currently trying to break down the just mentioned level.

IMPTUSDT Price: Sellers Reject Further Increase at $0.0055

The daily chart has shown that sellers are dominating the market. IMPTUSDT action has formed a double top chart pattern on the daily chart. At the moment, the price is carrying out retracement. In case sellers put in more asset the key support level of $0.0047 may be broken downside and the low of $0.0045 and $0.0043 may be reached. When buyers increase their momentum, resistance level of $0.0049 may be broken upside then, $0.0052 and $0.0055 levels may be tested. The QQE MOD with its histogram below zero level indicating sell signal.

IMPTUSDT Medium-term Trend: Bearish

IMPT is bearish in the 4-hour chart pattern. The crypto performance has been under the bears’ pressure in the 4 hour chart. After the breakout from the long time consolidation. The price steadily increase. The resistance level of $0.0065 was tested on December 12. The sellers’ pressure rejected the increase and it is currently testing $0.0047 level.

IMPTUSDT Price: Sellers Reject Further Increase at $0.0055

The price is trading below Hull suite crypto indicator as an indication that the sellers are in control. The QQE MOD bend down below zero level indicating sell signal.

Buy IMPT token on Exchanges!: IMPT (IMPT) https://impt.io/investors/#buy-impt