$SPONGE (SPONGE/USD): Demonstrating Resilience in a Volatile Market

The $SPONGE market remains in a consolidation channel, with bulls holding firm around the $0.00003 level to prevent a downward drift. In the current trading session, the price is testing the critical $0.0000006 level but has encountered a swift and sharp bullish response at this point. This price action highlights the strength of the bulls in maintaining market stability.

The market continues to uphold its marginally ascending support level. Yesterday, we observed an upward shift in the market low from $0.000023 to $0.000025. In today’s session, there is a possibility that the $0.00003 level could be reclaimed as a new bullish support, signaling continued strength in the crypto market.

Key Market Dynamics:

  • Resistance Levels: $0.00005, $0.000055, $0.000060
  • Support Levels: $0.000020, $0.0000195, $0.000019

$SPONGE (SPONGE/USD): Demonstrating Resilience in a Volatile Market

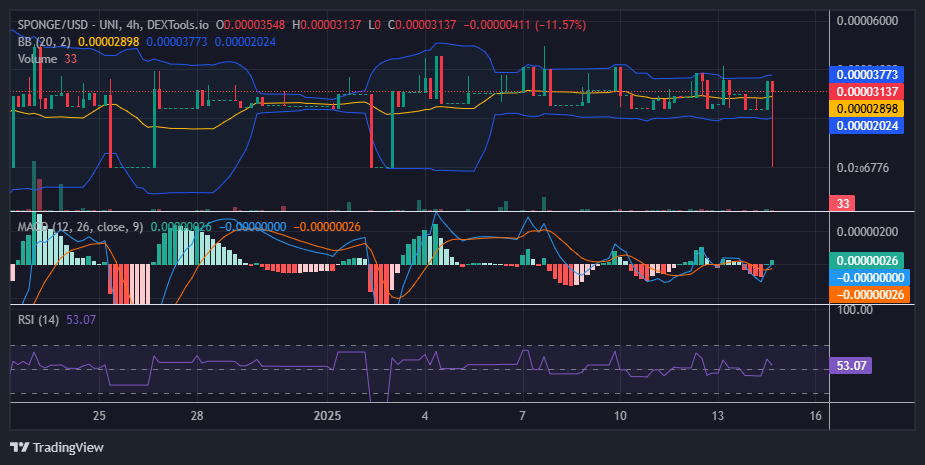
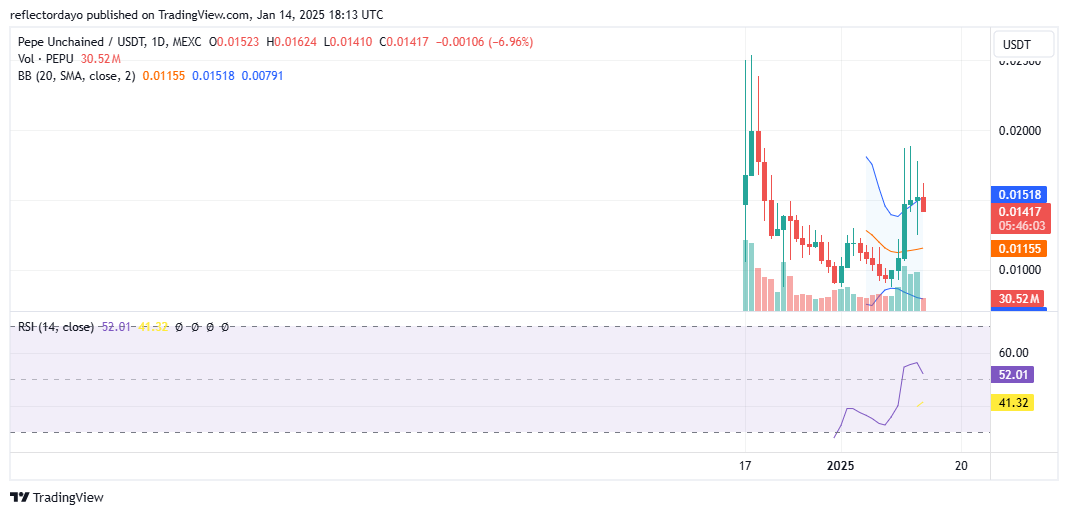
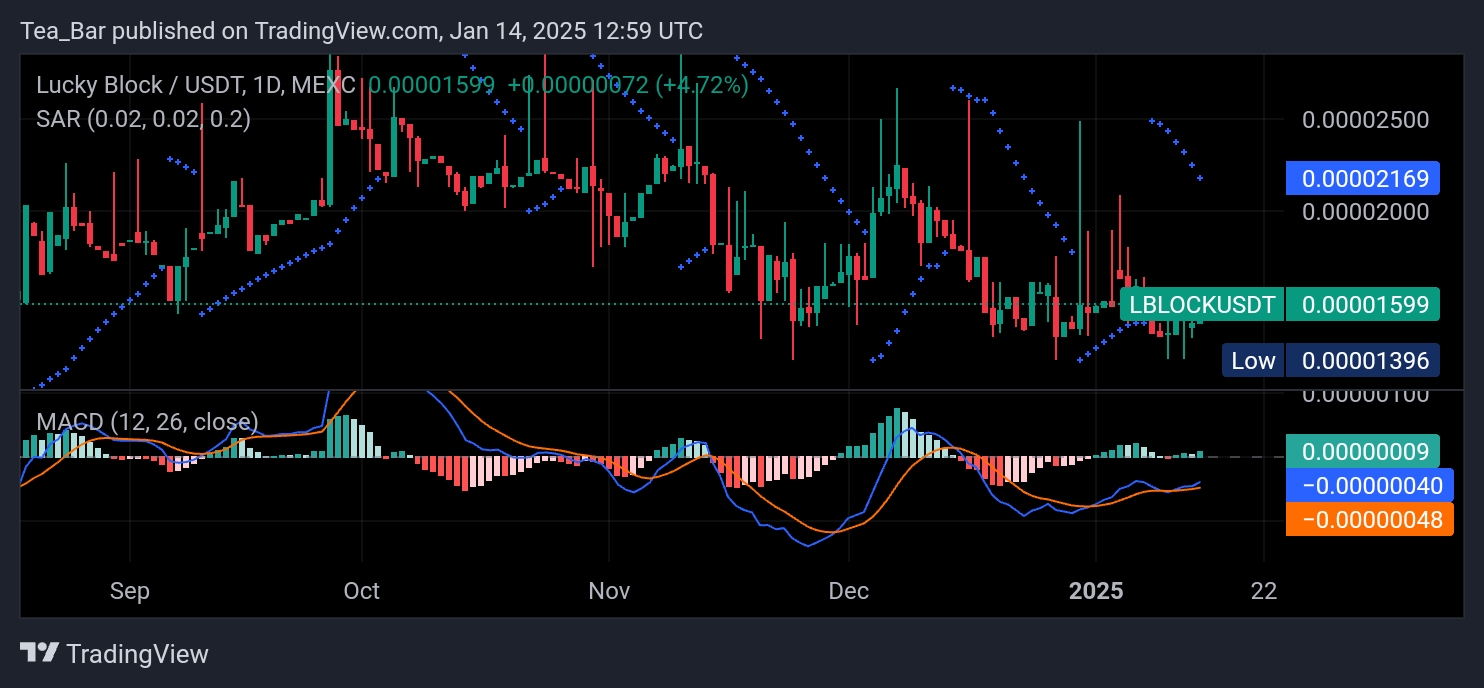
$SPONGE (SPONGE/USD) Technical Analysis

As the broader crypto market recovers from its recent downturn, the $SPONGE market has demonstrated resilience, successfully avoiding a drop to the critical support level at $0.0000006. Although the price briefly fell sharply to this level in the current trading session, the bulls quickly regained control, driving the price back above the $0.00003 mark.

The market’s recovery above this level, coupled with a break above the 20-day moving average, is a positive indicator. Holding above the 20-day moving average signals bullish dominance and suggests the potential for continued upward momentum.

$SPONGE (SPONGE/USD): Demonstrating Resilience in a Volatile Market

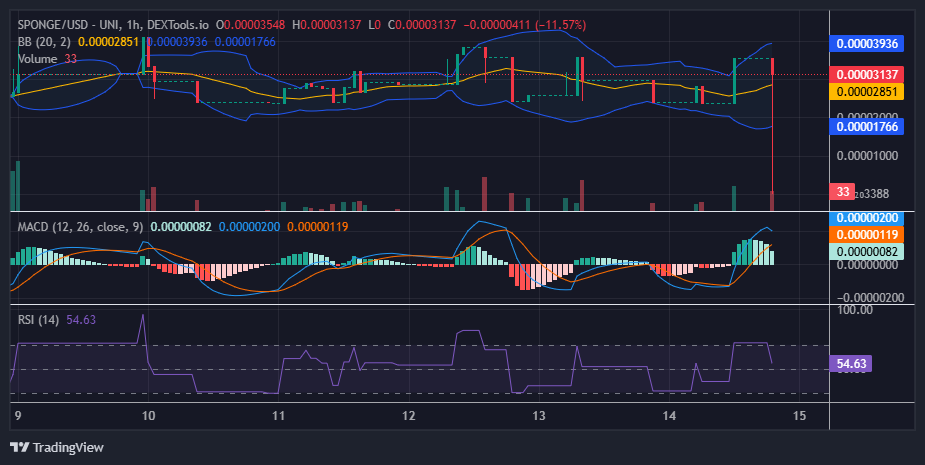
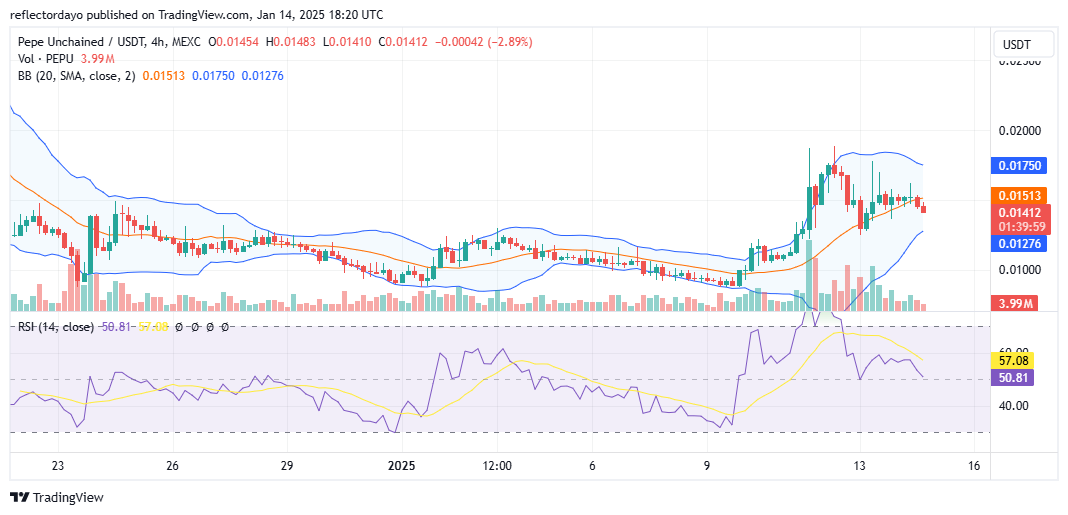
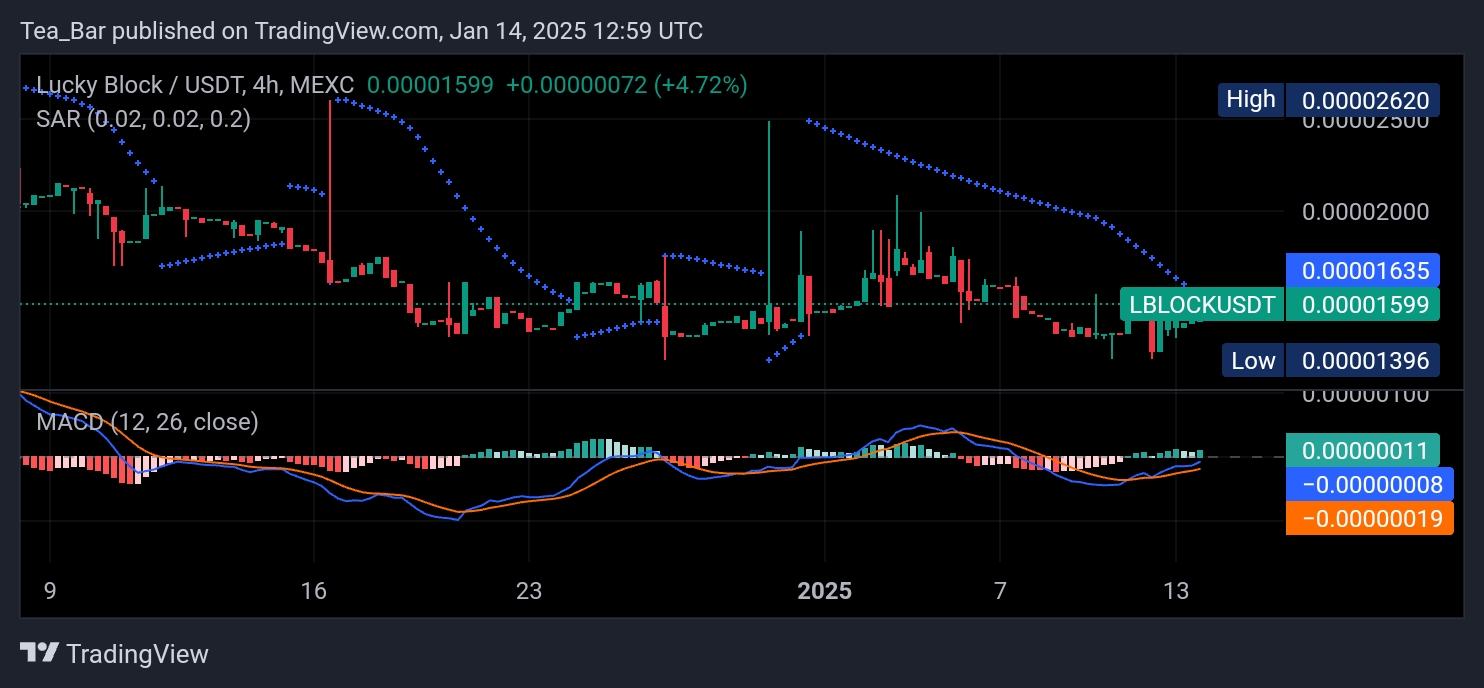
$SPONGE (SPONGE/USD) 1-Hour Chart Observations

Zooming into the 1-hour timeframe, the Bollinger Bands reveal heightened market activity and increased volatility. The wide bands on this shorter timeframe indicate significant price fluctuations, reflecting the market’s dynamic nature.

A standout feature during this period, particularly in the ongoing 1-hour trading session, is a sharp price surge from $0.0000006 to above $0.000030—a clear demonstration of bullish momentum. This rapid ascent underscores the strength of the bulls and their ability to push prices higher.

With the 20-day moving average currently positioned near the $0.000030 level, this price point is likely to serve as a strong support for the market’s upward trajectory. The confluence of price action around the moving average suggests the potential for consolidation and heightened buying interest at this level.

Buy SPONGE/USD!

Join the SPONGE community and be part of the next big crypto sensation! Buy Sponge ($SPONGE) today!

XRP (XRP/USDT) Prepares for More Upside Movement

XRP Long-term Analysis: Bullish

XRP against the Tether on a weekly timeframe has recently experienced a significant bullish breakout after recovering from a short-term price dip. However, this sharp rally is supported by strong trading volumes, indicating renewed buying momentum with the potential to hit the $3.000 psychological level soon.

Recently, the price actions have bounced above the widened Guppy Multiple Moving Averages (GMMAs), confirming a strong bullish interest. However, with the oscillator near the overbought region, a potential retracement or consolidation may follow. Traders should monitor price actions around the $2.7500 or immediate support level to make proper decisions.

Currently, XRP trades at $2.6878 with over 800 million weekly traded volumes.

XRP (XRP/USDT) Prepares for More Upside Movement
XRPUSDT-Weekly Chart

Technical Indicators

Major Resistance Levels: $2.750, $3.000, and $3.500

Major Support Levels: $2.425, $2.107, and $1.838

XRP Technical Analysis

The analysis of XRP against the Tether shows that the pair has recorded a 7.31% gain this week after the previous week’s price dip. This signals the pair has experienced a significant rally as prices move above prior resistance levels.

The GMMAs suggest a strong bullish movement with the current divergence, as the trading volume bar within the chart shows the market condition is bullish.

On the other hand, the Stochastic RSI operates near the overbought zone, suggesting the pair has the potential to improve further with the possibility that the price may slow down in the near term.

On this note, a break above the $2.750 resistance level would confirm more upside movement; otherwise, the price may oscillate around the current level.

XRP/USDT Analysis: What’s Next?

On the daily timeframe, XRP/USDT signals a short-term gain, as the pair remains bullish. With a moderate trading volume of over 300 million, the GMMAs project upward with a relatively tight line. This indicates a sustained trend strength.

On the other hand, the oscillator at the bottom of the chart shows the pair operating deep in the overbought region. Therefore, soon a retest of the immediate support level may surface.

To this end, a break below $2.600 would indicate a potential retracement despite the bullish position.

XRP (XRP/USDT) Prepares for More Upside Movement
XRPUSDT-Daily Chart


You can purchase crypto coins here. Buy LBlock

BNB (BNB/USDT) Bullish Traders May Flood the Market Soon

BNB Long-term Analysis: Bullish

BNB against the Tether has shown consistent bullish momentum in recent weeks, trading above major indicators. The pair has grown significantly since 2024, with occasional spikes and dips in price levels.

Recently, BNB/USDT appears to have been in a strong uptrend after a prolonged consolidation phase, and the Guppy Multiple Moving Averages (GMMAs) are trending upward indicating a sustained bullish momentum. Additionally, the volume bar within the chart has no spike indicating steady participation in the market. To this end, bullish traders must re-enter the market to maintain an uptrend, as the Stochastic RSI indicates potential consolidation in the near term.

Currently, BNB/USDT trades at $698.15 with a 0.69% positive change in trade from the previous session.

BNB (BNB/USDT) Bullish Traders May Flood the Market Soon
BNBUSDT-Weekly Chart

Technical Indicators

Major Resistance Levels: $700, $750, and $800

Major Support Levels: $659, $614, and $575

BNB Technical Analysis

The analysis of BNB against the Tether on the weekly timeframe reflects a strong bullish trend as the pair sees steady growth toward the $700 resistance level. Though the GMMAs indicate a short-term upside toward the immediate resistance level, the oscillator at the bottom of the chart shows the market lacks direction. 

To this end, BNB has the potential to advance to the North with a break above the $700 psychological level; otherwise, a spike in the volume with more bearish actions might pull the price below $659.

BNB/USDT Analysis: What to Expect

On the daily timeframe, BNB/USDT is consolidating despite recording a 1.37% gain above the previous session. However, as the pair oscillates near its near height, the sets of EMAs seem to be converging pointing at the indecision among the bulls and the bears.

On the other hand, the oscillator beneath the chart shows the pair operates deep in the oversold region, suggesting BNB could see a short-term bounce if buying pressure increases.

To this end, traders should watch out for price actions around the $700 level; a break above this level might see the price operating near $715 in the near term. Conversely, a break below the abovementioned level would suggest range-bound activities till a major spike in volume is observed.

BNB (BNB/USDT) Bullish Traders May Flood the Market Soon
BNBUSDT-Daily Chart


You can purchase crypto coins here. Buy LBlock

Polkadot (DOT/USDT) Seeks Support Near a Critical $6.592 Level


Polkadot Long-term Analysis: Bearish

The performance of Polkadot against the Tether seems to be waiting for a catalyst, as the price oscillates near the dynamic 20-period moving average of the Bollinger Bands. However, recent price action suggests the pair has encountered resistance around the $10.000 level while maintaining a holding above the $6.000 level. This reflects cautious optimism in the long run.

Expectations remain hinged on potential action around the mid-band of the Bollinger bands, as the Stochastic RSI position moves to the south.

Currently, Polkadot trades at $6.592 with 14.43 million weekly traded volumes.

Polkadot (DOT/USDT) Seeks Support Near a Critical $6.592 Level
DOTUSDT-Weekly Chart

Technical Indicators

Major Resistance Levels: $8.500, $10.076, and $12.000

Major Support Levels: $6.064, $5.000, and $4.000

Polkadot Technical Analysis

On a weekly timeframe, Polkadot against the Tether seems to be consolidating after a recent short upside movement, but the momentum appears to be neutral as the market awaits a catalyst to determine the pair’s next direction. 

The current expansion of the Bollinger bands suggests an impending spike in volume. However, if the pair breaks above the $5.500, a sustained move towards the $12.000 may be guaranteed. Conversely, a break below the $6.064 support level might trigger a re-test of the $5.000 level as the oscillator’s lines point to the south.

DOT/USDT Analysis: Expectations

On the daily chart, DOT/USDT is up by 3.10 % with price trading between the lower section of the Bollinger bands. However, the bands seem to be contracting suggesting reduced volatility in the near term and potential accumulation in the short term despite the increase in trading figures above the previous candle.

On the other hand, the Stochastic RSI a potential reversal moves provided momentum builds, as the indicator’s lines operate below the 20-mark level.

To this end, if the price holds above the $6.159 level, it may retest resistance at $7.000 or higher; otherwise, failure to maintain this level could lead to further declines toward $5.000.

Polkadot (DOT/USDT) Seeks Support Near a Critical $6.592 Level
DOTUSDT-Daily Chart


You can purchase crypto coins here. Buy LBlock

IMPTUSDT Price Fluctuates Between $0.0049 and $0.0047 Zone

IMPT is at a reasonable price

SPONGEUSDT Price Analysis – 14 January

When the bulls continue to apply pressure, the price could go beyond $0.0049. Bullish momentum will accelerate after the price breaks over the $0.0049 resistance level, which is followed by the $0.0052 and $0.0055 barrier levels.

SPONGEUSDT Market

Key levels:

Resistance levels: $0.0049, $0.0052, $0.0055

Support levels: $0.0047, $0.0045, $0.0043


IMPTUSDT Long-term Trend: Bearish

On the daily chart, IMPTUSDT is bearish. The reason why IMPT’s price fluctuates between $0.0049 and $0.0047 levels is to provide investors more options, to make it possible for a large number of people to get IMPT at a reasonable price. It only now costs $0.0047. They stand to benefit from the upbeat trend that will soon start to affect the IMPTUSDT market. If there is a bullish breakout at the $0.0049 level, the high resistance levels that are now in place will quickly turn into support levels.

IMPTUSDT Price Fluctuates Between $0.0049 and $0.0047 Zone

The HULL SUITE crypto indicator are set to be surpassed by the price. When the bulls continue to apply pressure, the price could go beyond $0.0049. Bullish momentum will accelerate after the price breaks over the $0.0049 resistance level, which is followed by the $0.0052 and $0.0055 barrier levels.

IMPTUSDT medium-term Trend: Bullish

IMPTUSDT is the ideal option for shorter time frames. More people are investing in the coin as a result of the support level of $0.0049 failing to hold. The IMPT’s cost will rise soon. On January 13, the price movement came into contact with the $0.0049 resistance level before reversing course and hitting the $0.0047 support level. The price is lowered to entice more shoppers to the market.

IMPTUSDT Price Fluctuates Between $0.0049 and $0.0047 Zone

A buy signal will be shown on the QQE MOD forex indicator with the signal lines above zero.

IMPT is causing a stir!

Buy IMPT token on Exchanges!: IMPT (IMPT)

Pepe Unchained (PEPU/USD) Maintains Resilience at the Critical $0.015 Level

As Pepe Unchained continues to climb in price, a strong battle between buyers and sellers is evident around the $0.015 level. The previous daily trading session featured a candlestick resembling a long-legged doji, reflecting the intense struggle among traders to gain control at this critical price point.

The recent surge from lower price levels to $0.015 highlights the clash between bullish traders anticipating further gains and those looking to secure profits. The ability of the Pepe Unchained price to sustain itself at this level underscores the resilience of the bulls and suggests a potential continuation of the upward trend, as market speculation remains high.

Key Levels to Watch:

  • Resistance: $0.016, $0.018, and $0.020
  • Support: $0.015, $0.013, and $0.010

Pepe Unchained (PEPU/USD) Maintains Resilience at the Critical $0.015 Level

Pepe Unchained Price Analysis from an Indicator Perspective

Earlier today, the market experienced a strong price surge but failed to reach the previous high, with the recent peak appearing to trend lower compared to prior days. While this may signal the potential for a bearish move, it is important to note that the bulls are also exhibiting similar patterns, as ascending lows can be observed.

This sharp convergence between support and resistance levels, seemingly around the $0.015 mark, suggests the possibility of an impending consolidation phase. If the crypto signal consolidates at this level, the next target could be $0.016. A breakout above this point would signal the onset of a significant price surge.

Pepe Unchained (PEPU/USD) Maintains Resilience at the Critical $0.015 Level

Short-Term Outlook for PEPUUSD: 4-Hour Chart

The 4-hour chart reveals the bulls’ persistent efforts to establish control around the $0.015 level, with price action consistently holding near this range. However, recent trading sessions indicate bearish pressure is causing a slight divergence from the $0.015 mark.

While this may initially suggest a potential bearish trend, the declining histogram indicates a weakening bearish momentum. As this momentum fades, the market may soon create an opportunity for a bullish rebound. Notably, bullish sentiment remains strong at this level, suggesting the possibility of a recovery in the near term.

Buy and stake NOW on the L2 for DOUBLE staking rewards! Pepe Unchained (PEPU)

Wall Street Memes (WSM/USD) Price Is in Ranges, Holding Rises

Wall Street Memes Price Prediction – January 14

The pricing proceedings that have predominated the activities of movements in Wall Street Memes versus the trade stances of the US currency have continued to be in the form of letting long-term investors stake to garner points, given that the crypto economy is currently in ranges, holding rises.

Buyers should find it more advantageous to initiate longing orders and let the positions run without any obstacles in order to secure the best long-term rebounds, regardless of the bears’ tendency to push back downward from toward or eventually against the lower Bollinger Band positioning level.

WSM/USD Market
Key Levels
Resistance levels: $0.0012, $0.0017, $0.0022
Support levels: $0.0007, $0.0005, $0.0003

WSM/USD – 4-hour Chart

The WSM/USD 4-hour chart shows that the WSM/USD market is in ranges, holding rises within the stretching territories of the Bollinger Bands.

The stochastic oscillators are now freely swerving up and down through different points without any definite setting signal, causing a degree of indecision at this moment. The indicators of the Bollinger Bands are slightly getting a repositioning pattern to the upside in the horizontal boundary lines of $0.0012 and $0.00075.
Wall Street Memes (WSM/USD) Price Is in Ranges, Holding Rises

Given that the WSM/USD market is now trading in ranges, which area of the Bollinger Bands should be strategically chosen as the ideal location to place long orders?

Execution of purchases has to be between the zones of the middle and the lower Bollinger Bands, as the WSM/USD market operation features in ranges, holding rises.

It is also crucial for traders and investors to avoid the tendency to sell off the majority of position orders that have been placed around the $0.0012 horizontal line or around the upper Bollinger Band signal. Nevertheless, the trade optimism that underpins the dip-buy strategy is still rising and will soon see consistent rallying forces.
Wall Street Memes (WSM/USD) Price Is in Ranges, Holding Rises

WSM/USD 1-hour chart

The 1-hour chart showcases that the crypto-economic market is in ranges, holding rises at a particular lower trade zone.

There has been a steady stretching mode to denote the way that the Bollinger Bands indicators have been positioning. The stochastic oscillators have turned to the negative direction into the oversold region under a bearish signal note. Nevertheless, the decline is to potentially allow buying options to come up with a level of decency.

Buy and stake WSM now!: Wall Street Meme (WSM)

Lucky Block (LBLOCK) Surges Ahead: Price Analysis and Key Technical Insights

Lucky Block continues to show resilience in the cryptocurrency market, with its price gaining momentum over the past 24 hours. Trading at $0.00001599, the token has experienced a 4.72% increase, signaling renewed investor interest. This analysis delves into Lucky Block’s current performance and its potential trajectory based on recent chart patterns.

Daily Chart Analysis: Stable Uptrend for LBLOCK

On the daily chart, Lucky Block demonstrates a consistent upward trajectory, supported by technical indicators. The Parabolic SAR indicator places bullish dots below the price action, confirming the upward momentum. Furthermore, the MACD histogram showcases green bars, indicating strengthening buying pressure, though the MACD line remains close to the signal line, suggesting caution.

Lucky Block (LBLOCK) Surges Ahead: Price Analysis and Key Technical Insights

The token’s current high is $0.00002169, with a low of $0.00001396. Lucky Block is positioned to break past its key resistance at $0.00001700 if the bullish trend persists, while support lies around $0.00001400, providing stability for investors.

4-Hour Chart Analysis: Short-Term Signals for Lucky Block

Lucky Block (LBLOCK) Surges Ahead: Price Analysis and Key Technical Insights
LBLOCKUSDT – 4H Chart

In the 4-hour timeframe, Lucky Block’s price action reinforces its bullish momentum. The Parabolic SAR continues to support the price, while the MACD histogram signals increased buying interest with its positive divergence. The MACD line crossing above the signal line further emphasizes a potential short-term breakout.

The next target for LBLOCK is $0.00001635, with immediate support at $0.00001396. A sustained push above $0.00001600 could catalyze a sharper rally toward higher levels.

Conclusion: Positive Outlook for Lucky Block

Lucky Block’s technical indicators align with a bullish outlook, presenting an optimistic scenario for both short- and long-term holders. While challenges remain, the token’s resilience showcases its potential to climb higher in the market. Investors should keep an eye on key resistance levels and volume to gauge the strength of this momentum.

You can purchase Lucky Block here.  Buy LBLOCK.

Raydium (RAY/USD) Rebounds Sharply Below $5.00, Sparks Bullish Momentum

Looking at the Raydium market from a wider viewpoint, the market appears to be in a consolidation phase, with prices fluctuating around the $5.00 level. Although this period of consolidation is ongoing, there has been a noticeable formation of higher lows around the $4.50 mark, which is a significant improvement from the previous support level of $4.20. Today, the market surged with impressive bullish momentum, claiming the top position. However, the $5.00 level could present a strong resistance, despite the clear bullish sentiment observed in today’s trading session.

Raydium Market Data

  • RAY/USD Price Now: $4.989
  • RAY/USD Market Cap: $1.4 billion
  • RAY/USD Circulating Supply: 289.9 million RAY
  • RAY/USD Total Supply: 554.9 million RAY
  • RAY/USD CoinMarketCap Ranking: #71

Raydium (RAY/USD) Rebounds Sharply Below $5.00, Sparks Bullish Momentum

Key Levels

  • Resistance: $5.00, $5.50, and $6.00
  • Support: $4.50, $4.00, and $3.50.

The Raydium Market Through the Lens of Indicators

Although today’s market is largely driven by bullish sentiment, with Raydium‘s trading activity positioning it as a top mover of the day, it’s important to note that the ongoing bullish momentum, while visible on the chart, is accompanied by a relatively small histogram. This diminishes the credibility of the bullish trend, especially as the market may encounter significant resistance at the $5.00 level. The bullish candlestick pattern, combined with the small trading volume histogram, suggests that only a limited number of market participants may be fueling the current upward movement. While this crypto signal raises concerns about the strength of the current price action, it could also indicate that some investors are accumulating positions in anticipation of a more substantial upside. A break above the $5.00 resistance could trigger further bullish momentum, potentially driving the market higher.

Raydium (RAY/USD) Rebounds Sharply Below $5.00, Sparks Bullish Momentum

RAY/USD Price Prediction: 4-Hour Chart Analysis

Upon examining the 4-hour chart, we observed that yesterday saw a significant surge in trading volume, as indicated by the height of the volume histograms. However, this surge was essentially a battle between bullish and bearish forces, preventing the market from making any significant progress in either direction. Today, the market displayed upward movement, but as the price approached the critical $5.00 level, we noted the emergence of bearish momentum, with traders beginning to take profits. Another noteworthy observation is the growing balance between bearish and bullish forces, as reflected in the smaller histograms and candlesticks near the $5.00 level, indicating a potential equilibrium in market sentiment.

Trade crypto coins on BYBIT!