Chiliz (CHZUSD) Bears Eye $0.08900 Level as Selling Pressure Intensifies

CHZUSD Analysis – Chiliz Buyers Appear Weak to Fight Back

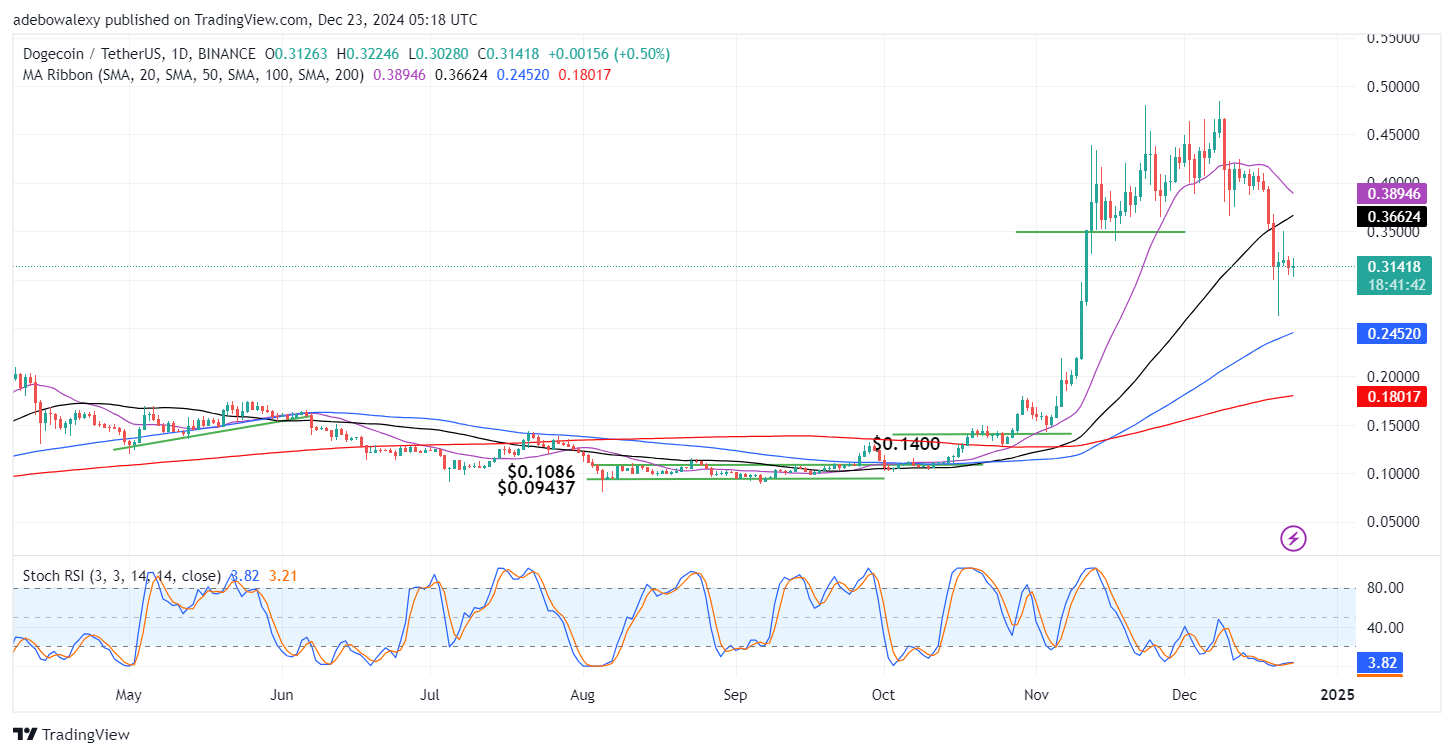
CHZUSD bears eye $0.08900 level as selling pressure intensifies. Chiliz is experiencing increased bearish momentum, with prices showing the potential to slip further toward the $0.08900 significant level. After an impressive bullish run last month, which began at the $0.05280 support level, the market’s bullish strength has faltered at the $0.14000 resistance zone this month. This failure to break higher has allowed sellers to take control, driving the price downward.

CHZUSD Key Levels

Resistance Levels: $0.14000, $0.01050
Support Levels: $0.08970, $0.08650

Chiliz (CHZUSD) Bears Eye $0.08900 Level as Selling Pressure Intensifies

Despite a strong rally last month, CHZUSD buyers have struggled to breach the $0.14000 resistance level. This has shifted the market sentiment, allowing bearish traders to step in and push prices lower.

The current market flow points to a strong bearish sentiment, with sellers appearing poised to penetrate deeper into the market. The price action now reflects increased sell-side activity, signaling a potential continuation of the downtrend.

A recent bearish crossover indicates that sellers are gaining traction, further solidifying the downtrend. The MACD indicator shows strong bearish interaction, with the histogram and signal line favoring a continuation of the bearish movement. For buyers to regain control, they will need to defend key support zones and stage a recovery above $0.10000. However, given the current bearish dominance and strong sell signals from the MACD and Moving Average indicators, any bullish recovery may face significant challenges.

Chiliz (CHZUSD) Bears Eye $0.08900 Level as Selling Pressure Intensifies

Market Expectation

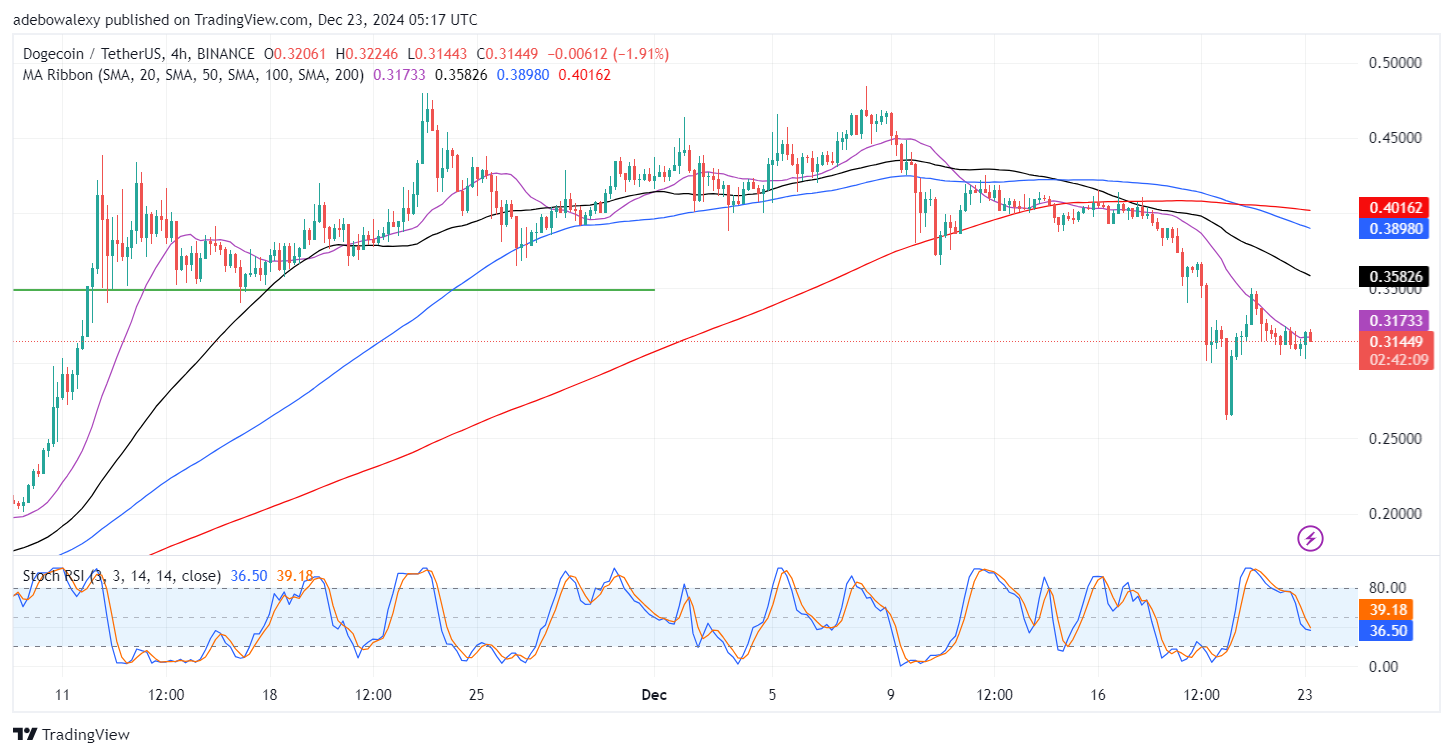
On the shorter time frame, sellers remain active, working to break key support levels. The technical indicators suggest further bearish potential, with the $0.08900 level likely to be the next target for sell traders.

Chiliz is expected to continue its bearish trajectory in the near term, with sellers targeting the $0.08900 significant level. If this level is breached, the market could face further declines, with additional support likely forming near $0.08000.

You can purchase Lucky Block here.  Buy LBLOCK

Note: Cryptosignals.org is not a financial advisor. Do your research before investing your funds in any financial asset or presented product or event. We are not responsible for your investing results

BNB (BNB/USDT) Eyes Recovery from Recent Dip

BNB Long-term Analysis: Ranging

The market for BNB, the Binance native coin, against the Tether (USDT) has been hovering within a close range. However, the price seems to be recovering as the pair eyes a potential breakout.

Recently, on a weekly timeframe, the pair appears to have been acting around the upper Bollinger band around $729.30 before correcting towards $600. However, BNB has shown signs of resilience by rebounding from this low, establishing a solid upward trend.

To this end, BNB/USDT approaches critical levels, hinting at a possible upside breakout as trading activities increase for the week.

Currently, BNB/USDT is trading at $670.49, with 227.76k traded volumes for the week.

BNB (BNB/USDT) Eyes Recovery from Recent Dip
BNBUSDT-Weekly Chart

Technical Indicators

Major Resistance Levels: $675, $730, and $800

Major Support Levels: $604, $550, and $480

BNB Technical Analysis

On a weekly timeframe, BNB has been trading near the upper Bollinger band, indicating the presence of bullish traders regardless of the recent price dip and a range-bound activity between $604 and $700. However, a breakout below $604 would lead to the continuation of the consolidation phase or the re-test of previous support levels. Conversely, with the formation of a bullish candlestick, a break above $700 could position the pair for $730.

Additionally, the Stochastic RSI suggests the pair operates in the neutral zone with the lines pointing downwards. On this note, for a bullish breakout, traders need to wait for a line crossover with some improvement towards the 60-mark level; otherwise, the pair may see another fall if the condition remains unchanged.

BNB/USDT Analysis: What are the Odds?

On the daily timeframe, BNB/USDT has seen a moderate rebound at $647.06 after facing mild selling pressure. This represents a 3.25% increase from the previous low, and an attempt to regain bullish momentum amid market uncertainty.

However, a recent increase of 21.12 above $647.06 may not be enough to ascertain a sustained uptrend. Therefore, a breakout above the $700 psychological level and a spike in volume would signal a bullish trend.

Additionally, the Stochastic oscillator at the bottom of the chart indicates a potential upside movement. However, a cross above the oversold region would confirm a bullish move in the short term. Therefore, a rejection at the current level may lead to the re-test of $649 or lower support levels.

BNB (BNB/USDT) Eyes Recovery from Recent Dip
BNBUSDT-Daily Chart


You can purchase crypto coins here. Buy LBlock

$SPONGE (SPONGE/USD): Navigating a Choppy Market

The SPONGE/USD market continues to reflect a tug-of-war between bullish and bearish forces. Recently, bearish momentum has gained the upper hand as the key support level at $0.00003 gradually declined to around $0.000025. Despite this downward trend, there was a recent attempt to breach the $0.000055 resistance level. However, strong resistance at $0.00005 rejected the price, further contributing to the shift in support from $0.00003 to $0.000025.

Key Market Dynamics:

  • Resistance Levels: $0.00005, $0.000055, $0.000060
  • Support Levels: $0.000020, $0.0000195, $0.000019

$SPONGE (SPONGE/USD): Navigating a Choppy Market

$SPONGE (SPONGE/USD) Technical Outlook

Following the recent bearish move that broke to new lows, the bulls responded by regaining ground around the $0.00003 price level. For most of the recent 4-hour trading sessions, they have successfully kept the crypto signal above this critical support. However, persistent bearish pressure at this level is gradually eroding the bullish position.

While the bears appear to be gaining momentum for now, an analysis of the Bollinger Bands suggests that the bearish trend may not sustain itself. The bands show a broad spread, indicating high volatility. A continued SPONGE/USD bearish move is unlikely unless the price breaks down below the $0.000006 level.

In the upcoming trading sessions, the market may find support and bounce back, potentially breaking above the resistance levels at $0.00005 and $0.000055.

$SPONGE (SPONGE/USD): Navigating a Choppy Market
$SPONGE 1-Hour Chart Insights

The 1-hour chart reveals a market in equilibrium, with the SPONGE/USD price currently holding steady at $0.000024. This stagnation may suggest that the market is preparing for a potential bounce from this level. However, the MACD indicator has already formed a bearish crossover above the zero line, signaling increased bearish pressure on the bulls at this critical support zone.

Despite the bears gaining the upper hand, a bearish takeover has not been confirmed, as the MACD lines have yet to cross below the zero level. Traders should remain vigilant and anticipate a possible bullish rebound, as the price has shown resilience at this support level.

Buy $SPONGE!

Join the SPONGE community and be part of the next big crypto sensation! Buy Sponge ($SPONGE) today!

Dogecoin Price Prediction: DOGE/USDT Consolidates, as Price Action Lacks Direction

Dogecoin Price Prediction (December 23):

The Dogecoin market has seen a strong bearish correction over the past sessions. As a result, the token’s price action has fallen through multiple technical supports. However, now, the market can be seen consolidating just above another one as it appears that bears are losing momentum.

DOGE/USDT Long-Term Trend: Bearish (Daily Chart)

Key Price Levels:

Resistance: $0.3500, $0.4000, $0.4500

Support: $0.3000, $0.2500, $0.2000

Dogecoin Price Prediction: DOGE/USDT Consolidates, as Price Action Lacks Direction

Since the past four sessions when price action tested the support at the $0.3000 price level, price action has continued to trend sideways. The last price candle on the chart is green but lies below the 20 and 50-day Moving Average (MA) lines. Similarly, the Stochastic Relative Strength Index lines are in the oversold region of the indicator with the lines of the indicator slightly lifted upwards.

Dogecoin Price Prediction: DOGE/USDT Buyers Aren’t Strongly Convinced

Ever since the downward correction in the Dogecoin daily market breached the $0.3000 support level, price activity in this market has been trending sideways. The last price candle on the chart is green but has a small body, indicating that buyers aren’t having considerable strength.

Also, price action lies at a significant distance below the 20- and 50-day MA lines. In addition, the Stochastic RSI lines can be seen appearing largely depressed in the oversold zone of the indicator. Consequently, traders in this market may want to rely more on fundamentals about the crypto market as well as the coin in question.

Dogecoin Price Prediction: DOGE/USDT Lurks Around the 20-day MA (4-Hour Chart)

By extending Dogecoin’s price analysis to a 4-hour market, it could be seen that price action has been lurking just around the 20-day MA line. This MA line lies below all other MA lines on this price chart. Meanwhile, the Stochastic RSI lines can be seen appearing convergent just around the 40 mark of the indicator.

Dogecoin Price Prediction: DOGE/USDT Consolidates, as Price Action Lacks Direction

This is happening at a time when the last price candle has appeared red. Technically, indications arising from this market seem mixed. However, the appearance of the corresponding price candle to the ongoing session suggests that the downward retracement may continue at least toward the $0.3000 technical support level.

Get Dogecoin here. Buy DOGE 

Dash 2 Trade Price Predictions for Today, December 23: D2TUSD Sitting at $0.00113 High Mark, Aiming to Rally

Dash 2 Trade Price Forecast: D2TUSD Sitting at $0.00113 High Mark, Aiming to Rally (December 23)

While sitting at the $0.00113 high level, the D2TUSD price aim is to rally further for the next bull cycle, and a swift increase is expected to follow soon. Therefore, a bullish crossover above the $0.00460 high point will encourage the buy investors for a longer correction, reaching a high at the $0.01000 upper supply trend line, offering investors lucrative opportunities.

Key Levels:
Resistance levels: $0.00115, $0.00116, $0.00117
Support levels: $0.000850, $0.000800, $0.000750

D2T (USD) Long-term Trend: Bearish (Daily Chart)

The D2TUSD pair is sitting below the supply levels, aiming to rally higher as it begins its bullish correction pattern in its long-term outlook. The price bar is below the moving average lines and has confirmed its bearishness.
Dash 2 Trade Price Predictions for Today, December 23: D2TUSD Sitting at $0.00113 High Mark, Aiming to Rally
The interference of short-term traders to the $0.000900 low level in the last few days has contributed to its bearish momentum in its recent high.

Today, we have also spotted a breakout and the start of a continuation to the upside. Currently, the Dash 2 Trade price made a pullback at the $0.00113 value below the EMA-50 as the daily chart resumes with intraday gains.

Such lower price rejection indicates that buyers are defending this level and aiming to rally higher. Hence, a strong push above the $0.00460 supply level will offer strong resistance to the crypto price.

Also, Dash 2 Trade is showing more upside possibilities. Therefore, more strength is expected from the coin buyers and this may likely reach a $0.01000 upper resistance level in the coming days in its long-term outlook.

D2T (USD) Medium-term Trend: Bearish (4H Chart)

D2TUSD rebounded after its downside moves, aiming to rally higher. The coin is now finding its way to the resistance level in its medium-term time frame, indicating that the price may soon be in an ascending channel.
Dash 2 Trade Price Predictions for Today, December 23: D2TUSD Sitting at $0.00113 High Mark, Aiming to Rally
The sustained bearish pressure in the past few hours at the $0.000102 support value has made the crypto price remain below the supply trend levels in its recent high.

The Dash 2 Trade price is aiming to rally as the bulls drive the crypto price to a $0.00113 high level below the EMA-50 as the 4-hourly chart resumes today, proving the impact of the bulls on the crypto.

In addition, the momentum indicator shows that the price of D2TUSD will still bounce up, so we expect the price distribution to reach the $0.01000 supply level and beyond in the coming days in its medium-term outlook.

Want a coin that has a huge potential for massive returns? That coin is Dash 2 Trade. Buy D2T now.

Chainlink (LINK/USDT) Bullish Rally Suspended, Dips Below $25.36 Critical Level

Chainlink Long-term Analysis: Bullish

For several weeks, Chainlink against the Tether has experienced an uptrend after breaking away from a consolidation phase at around $14.29 in late September. This can be seen in the rising trend and the formation of higher highs.

The recent price movement around the upper band at $25.36 shows that the pair is down by 23.21% this week alone. This sharp move suggests a strong bearish correction after recent months’ rally.

However, the position of the Stochastic and the price movement around the upper Bollinger band suggest the pair still operates in the overbought condition. Conversely, the formation of the bearish candlestick speaks otherwise as it extends towards the mid-band at $14.29.

Currently, Chainlink is trading at $22.47 with over 69 million weekly transactions.

Chainlink (LINK/USDT) Bullish Rally Suspended, Dips Below $25.36 Critical Level
LINKUSDT-Weekly Chart

Technical Indicators

Major Resistance Levels: $25.36, $30.00, and $35.00

Major Support Levels: $20.00, $14.29, and $10.00

Chainlink Technical Analysis

The weekly analysis of Chainlink against the Tether shows that the pair is experiencing a pullback after a major rally. However, the overall market setup remains bullish. The recent price action around the upper limit suggests an impending correction as the price seems to have seen a prolonged uptrend.

Therefore, a pullback to the $20.00 psychological level may be a good re-entry point for another rally. Additionally, the oscillator at the bottom of the chart also indicates an overbought condition as the lines read extreme values of 94.60 and 83.81. This suggests the recent fall in price may be a result of a minor take-profit.

To this end, traders should watch out for the spike in volume, changes in the behavior of the Stochastic lines, and potential signs of exhaustion of selling pressure for confirmation of a bullish trajectory above $25.36 towards $30.00.

LINK/USDT Analysis: What’s Next?

On the daily timeframe, LINK/USDT shows signs of a slight recovery of 1.65% from the recent low. This signals a potential pause in the recent bearish momentum as the price aims to break above the $22.49 level with 2.31 million traded volumes.

At the bottom of the chart, the Stochastic oscillator indicates an oversold condition. However, the upward curvature of the lines at 3.72 and 2.70 signals an impending upside movement.

Therefore, the $25.36 level remains an important point for a confirmed bullish reversal; otherwise, the selling pressure may continue.

Chainlink (LINK/USDT) Bullish Rally Suspended, Dips Below $25.36 Critical Level
LINKUSDT-Daily Chart


You can purchase crypto coins here. Buy LBlock

Tamadoge (TAMA/USD): Battle Between Bulls and Bears Intensifies at $0.0014

In the previous analysis of the TAMA/USD market, we observed an ongoing battle between buyers and sellers around the $0.0014 level. In today’s analysis, the price has settled below this threshold. However, as the crypto signal approaches the $0.0012 level, bearish momentum appears to be losing steam, suggesting that this level is acting as strong support.

The implication of this development is that the market may be preparing for a rebound, potentially rallying back toward the $0.0014 level.

Key Levels

  • Resistance: $0.0018, $0.0019, and $0.0020
  • Support: $0.001, $0.0009 and $0.0008

Tamadoge (TAMA/USD): Battle Between Bulls and Bears Intensifies at $0.0014

TAMA/USD Price Analysis: The Indicators Point of View

The indicators continue to suggest a consolidating TAMA/USD market, primarily ranging around the $0.0014 level. The Bollinger Bands reflect this scenario as they contract, indicating reduced volatility while maintaining a horizontal trajectory. The ongoing struggle between bulls and bears at this price point is evident.

Currently, the bears appear to have a slight edge, as the price has dipped below the $0.0014 threshold. However, their momentum seems insufficient to drive the market significantly lower. The $0.0012 level is emerging as a strong support zone, with potential for a rebound. This is supported by the formation of a doji candle in the current session, signaling a balance between buying and selling pressures. This pattern suggests that bearish momentum is likely peaking, and a convergence of bullish sentiment at this level could trigger a price bounce.

Tamadoge (TAMA/USD): Battle Between Bulls and Bears Intensifies at $0.0014

Tamadoge Short-Term Outlook: 1-Hour Chart

On a smaller timeframe, the consolidation phase persists, with bulls showing strong resilience at the $0.0012 support level. The Bollinger Bands remain widened, reflecting recent bullish activity highlighted in the previous analysis of TAMA/USD. Investors should pay attention, as the diminishing bearish momentum may indicate that the market is positioning itself for a potential rebound.

Buy Tamadoge!

Buy TAMA today!

Enjin Coin Buyers Aim for Recovery Amidst Recent Bearish Pressure

ENJUSD Analysis – Enjin Coin Buyers Reclaim Momentum After Bearish Phase

Enjin Coin is showing signs of recovery as buyers begin to push back against recent bearish dominance. After sellers drove the price below the $0.2540 significant level last week, the market appears to be shifting. The bearish trend followed a failed attempt by bulls to sustain gains above the $0.4000 resistance level earlier this month.

ENJUSD Key Levels

Resistance Levels: $0.4000, $0.3120
Support Levels: $0.2500, $0.1250

Enjin Coin Buyers Aim for Recovery Amidst Recent Bearish Pressure

The recent decline in Enjin Coin’s price was preceded by a strong bullish cycle in the previous month. While the sellers have dominated in recent weeks, buyers are now re-entering the market, aiming to reverse the downward trajectory.

The Momentum indicator is beginning to show increased bullish impulse, signaling renewed buyer interest after a period of market decline. The Stochastic Oscillator is approaching a potential crossover. This could give buyers an edge and inspire confidence for a stronger recovery.

Traders should keep an eye on the Stochastic Oscillator for confirmation of a bullish crossover, as well as the Momentum indicator for signs of increasing upward pressure. If bearish sentiment persists, the price may revisit lower support levels. Nevertheless, the current market setup favors buyers gradually reclaiming dominance, provided they maintain their current momentum.

Enjin Coin Buyers Aim for Recovery Amidst Recent Bearish Pressure

Market Expectation

On shorter time frames, buyers are showing more determination to regain control. While the market recovery may take some time, the technical indicators suggest growing bullish intent, which could lead to gradual price expansion.

Enjin Coin is poised for a potential recovery as buyers work to regain control of the market. A successful defense of the $0.2540 support level could pave the way for a rally toward $0.3000 and beyond. However, for a sustained bullish breakout, buyers will need to overcome key resistance zones, starting with the $0.2800 level.

You can purchase Lucky Block here.  Buy LBLOCK

Note: Cryptosignals.org is not a financial advisor. Do your research before investing your funds in any financial asset or presented product or event. We are not responsible for your investing results

Near Protocol (NEAR/USD) Market Indicators Signal Potential Bullish Reversal From Support

Near Protocol Price Forecast – December 22

NEARUSD market indicators signal a potential bullish reversal from support. The market is currently in a discount zone.

The Stochastic RSI is signaling oversold conditions, as both %K and %D lines are below 20, indicating a possible upward reversal. The 9-day Simple Moving Average (SMA), currently at $6.280, remains above the price but shows signs of flattening, suggesting weakening bearish momentum. This combination of indicators supports the notion that the downtrend might be losing steam, paving the way for a bullish recovery.

NEAR/USD Market Key Levels:

Resistance levels: $6.500, $8.000, $8.520
Support levels: $4.300, $3.600, $3.070

NEAR/USD – Daily Chart

The daily chart for NEARUSD remains bullish as the price is strongly retracted from the discount zone.

NEARUSD has retraced sharply from its recent high of $8.520 and is now testing strong support at $4.300. This level aligns with the 0.786 Fibonacci retracement, adding to its significance as a potential reversal zone.

A bullish pin bar has formed near this support level, further reinforcing the likelihood of a trend reversal. The earlier break below $5.880 acted as a bearish trigger, but the current bounce hints at buyers stepping in.

Near Protocol (NEAR/USD) Market Indicators Signal Potential Bullish Reversal From Support

What is the outlook of NEARUSD?

If NEARUSD sustains above $4.300, an initial recovery towards $5.300 (the 0.618 Fibonacci level) appears likely, with further upside potential toward $6.500. A successful reclaim of $6.500 could pave the way for a retest of $8.520 in the medium term.

Near Protocol (NEAR/USD) Market Indicators Signal Potential Bullish Reversal From Support

NEAR/BTC Price Analysis

NEARBTC is currently in a corrective phase after hitting support at 0.00005230. The price is expected to retest the 0.00006180 level, where an order block resistance exists.

The Stochastic RSI remains oversold, suggesting a temporary bounce before the resumption of bearish momentum. A breakdown below 0.00005230 could lead to further declines toward the next key support at 0.00004020.

Near Protocol (NEAR) Current Statistics
Current price: $5.240
Market Capitalization: $6,830,000,000
Trading Volume: $2,060,000,000

Place winning NEAR/USD trades with us. Get NEAR here