The top trending markets this week showcase a dynamic shift, with several utility-focused tokens emerging in the top five positions on the trending coins list. Notably, these markets have demonstrated impressive performance over the past 24 hours and the last seven days. According to data from CoinMarketCap, the trend reflects a significant bullish momentum.
For a deeper understanding of these markets and their analysis, let’s take a closer look at their performance and potential.
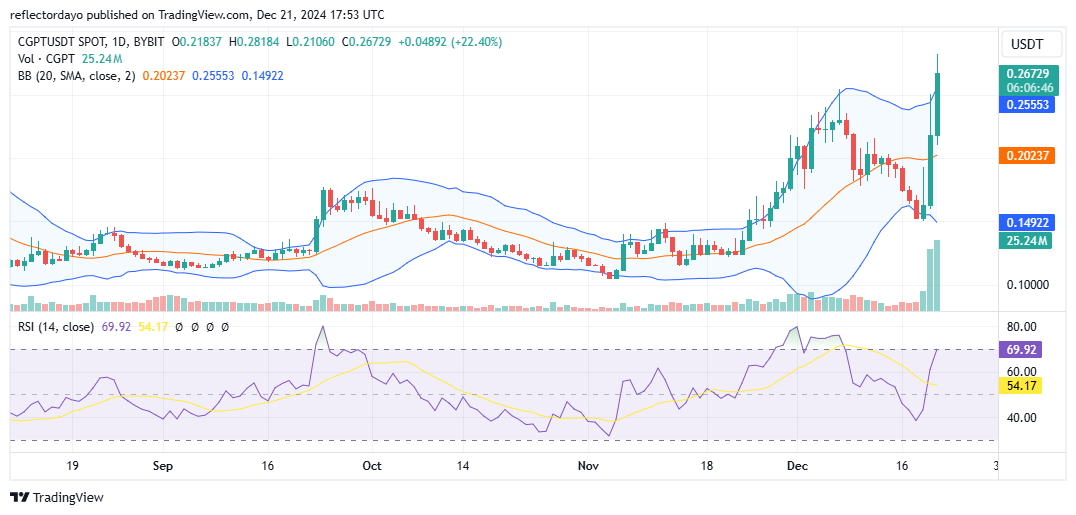
ChainGPT (CGPT)
Major Bias: Bullish
In recent days, there has been a surge in demand for this market, propelling it to the top spot on the trending markets list. The bullish trend began on Thursday, following a rebound from the $0.15 price level, which had been tested during a bearish phase. This renewed bullish sentiment sparked a price rally, driving the market upward until it encountered resistance at the $0.25 level. Interestingly, this same $0.25 resistance level previously initiated the bearish trend that pushed the market down to $0.15.
Over the past week, the market has experienced significant volatility, which likely contributed to its top position on the trending list. Beyond the volatility, bullish traders may find the market’s recent activity particularly noteworthy. During today’s session, the price broke through the $0.25 resistance level, and the sustained bullish momentum suggests that this level may now act as support.
Additionally, the trading volume indicator shows substantial activity, reflected by prominent histogram readings, further confirming the strong bullish sentiment. With this robust momentum, the market appears poised to sustain its upward trajectory, maintaining a favorable outlook for bullish traders.
Current Price: $0.26
Market Capitalization: $198 million
Trading Volume: $92 million
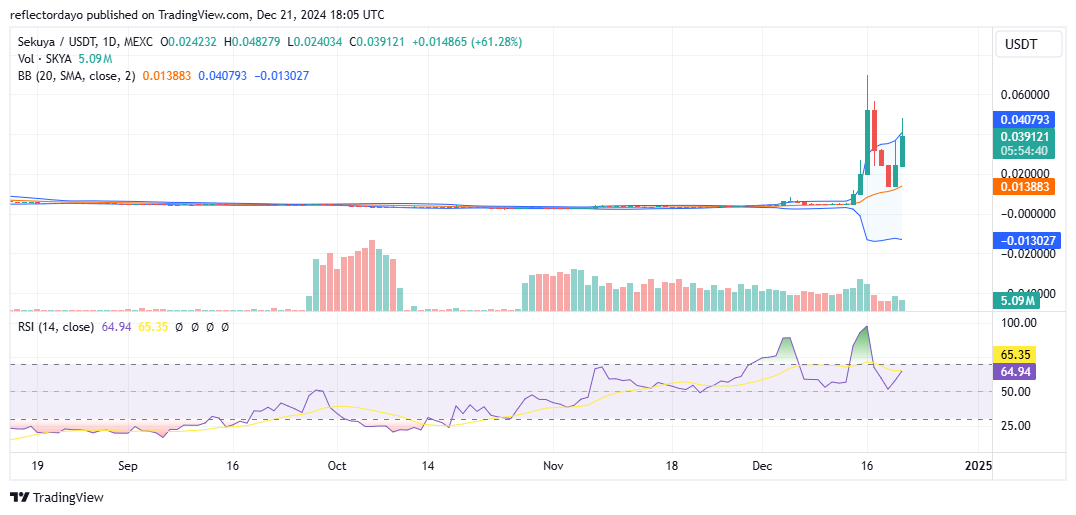
Sekuya Multiverse (SKYA)
Major Bias: Bullish
Historical data from the market chart suggests that this market was likely launched in late May. Since its inception, the market has shown limited activity, initially drifting slowly downward. Between August and early December, the market remained largely stagnant, with minimal price movement and flat, short trading volume histograms indicating low activity.
In September, trading volume showed signs of increased activity, with tall and significant histograms appearing. However, the price action remained unaffected, staying flat at $0.004. It wasn’t until early December that the market began to show signs of life, as bullish momentum started to push the price upward.
A significant bullish breakout occurred in mid-December, with the price surging higher and peaking at $0.07. This rally eventually triggered a bearish pullback, but the bulls managed to maintain control, establishing a higher support level at $0.013.
During this period, it is possible that some investors were quietly accumulating the asset, contributing to the subsequent bullish breakout. Given this upward momentum, the market may continue to rise in the coming days, presenting potential opportunities for bullish traders.
Current Price: $0.039
Market Capitalization: $15 million
Trading Volume: $2.4 million
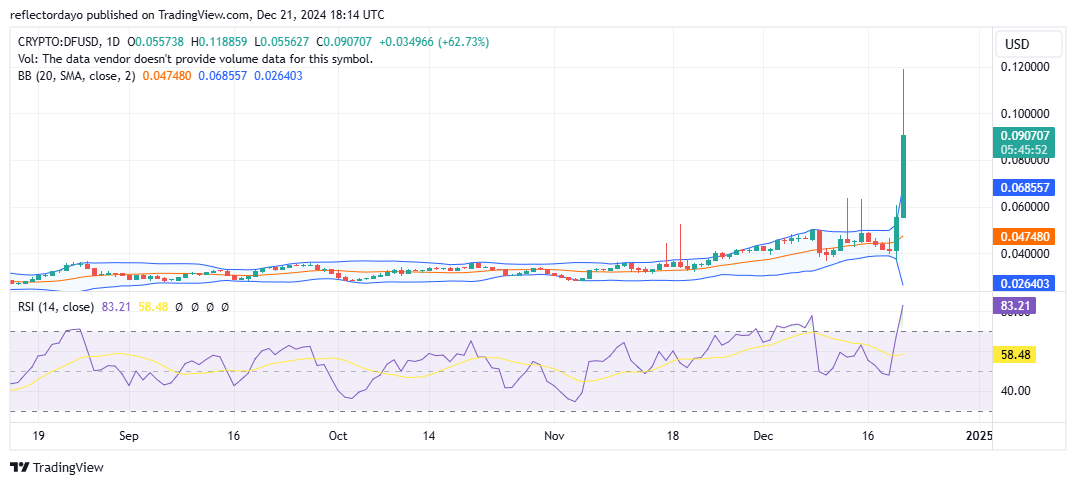
dForce (DF)
Major Bias: Bullish
Ranking third on today’s list of trending markets is the dForce (DF) market. This market has secured its position with a remarkable bullish price surge, characterized by hyper-accelerated momentum. The surge has caused a significant divergence in the Bollinger Bands, suggesting explosive market activity.
The Relative Strength Index (RSI) further highlights the strength of the market’s momentum, with the RSI line climbing almost vertically—a clear indication of intense bullish activity. In today’s trading session, the market peaked at $0.12, rallying from a starting level of around $0.04.
While such hyper-bullish movements often precede similarly intense bearish corrections, there is potential for the bulls to capitalize on this momentum by securing higher support levels. Specifically, the $0.08 level could serve as a strong support zone, providing a foundation for the bull market to sustain its upward trajectory.
Current Price: $0.096
Market Capitalization: $96 million
Trading Volume: $275 million
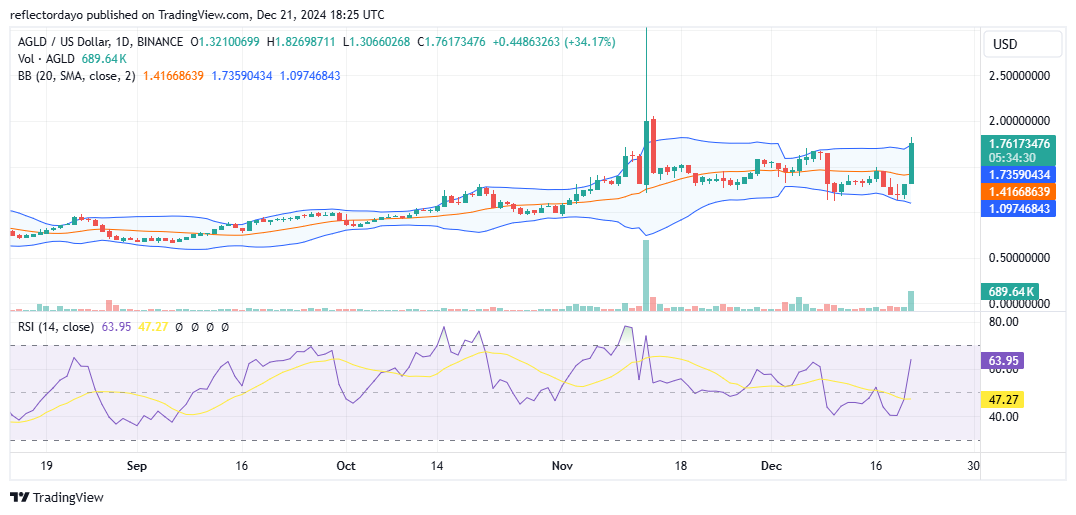
Adventure Gold (AGLD)
Major Bias: Indecision
The Adventure Gold (AGLD) market takes the fourth position on today’s trending list. This market has largely been consolidating within the $1.176–$1.68 price range. Its ascent to fourth place may be attributed to the remarkable and persistent performance of the bulls during today’s trading session.
Historically, the trading volume histograms have remained flat, indicating low trading activity and explaining the prolonged consolidation phase. However, today’s market session tells a different story. A significant spike in trading volume, accompanied by a bullish candlestick, signals increased liquidity in the market, which has driven the price higher.
Currently, the bulls are challenging the resistance at $1.70. Their persistent efforts suggest they may break through this resistance level, as they continue to demonstrate resilience against bearish pressure.
Current Price: $1.76
Market Capitalization: $138 million
Trading Volume: $659 million
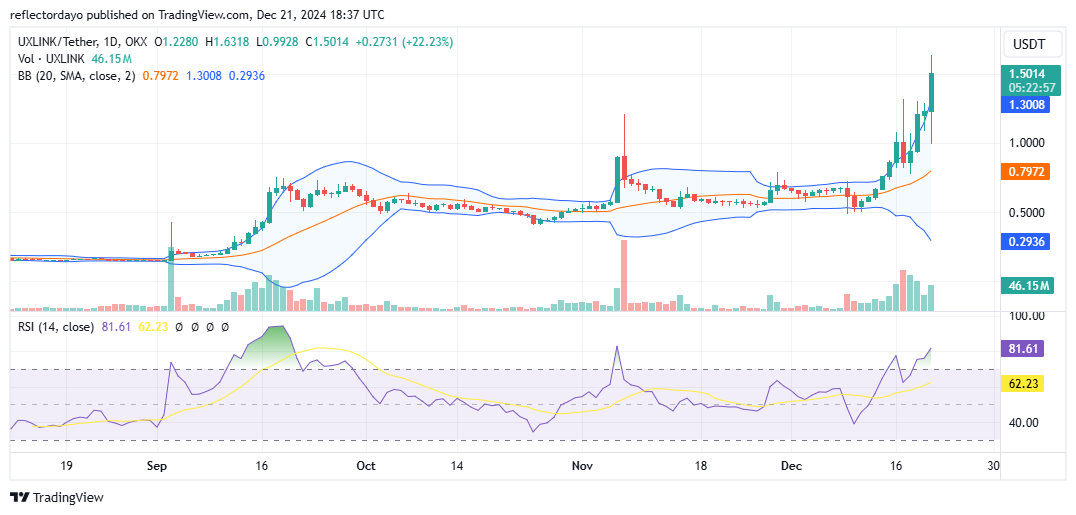
UXLINK (UXLINK)
Major Bias: Bullish
The UXLINK market has sustained a continuous bullish trend since last week, with the rally appearing to reach its peak in today’s trading session. Prior to this peak, the market demonstrated remarkable bullish activity, achieving a new high above the $1.50 price level. Approaching this level triggered significant market volatility, as indicated by the Bollinger Bands, which have diverged further in response.
Despite the heightened volatility, the bulls have maintained control of the market. The Relative Strength Index (RSI) is currently at 81, reflecting strong bullish momentum but also signaling an overbought condition.
Given these indicator readings, the market appears poised for a potential correction following its surge above the $1.50 level. Traders should remain cautious and watch for signs of consolidation or a pullback in the coming sessions.
Current Price: $1.50
Market Capitalization: $258 million
Trading Volume: $2.6 billion
Trade crypto coins on BYBIT!