Cardano (ADA/USDT) Targets Previous Consolidation Zone

Cardano Long-term Analysis: Bearish

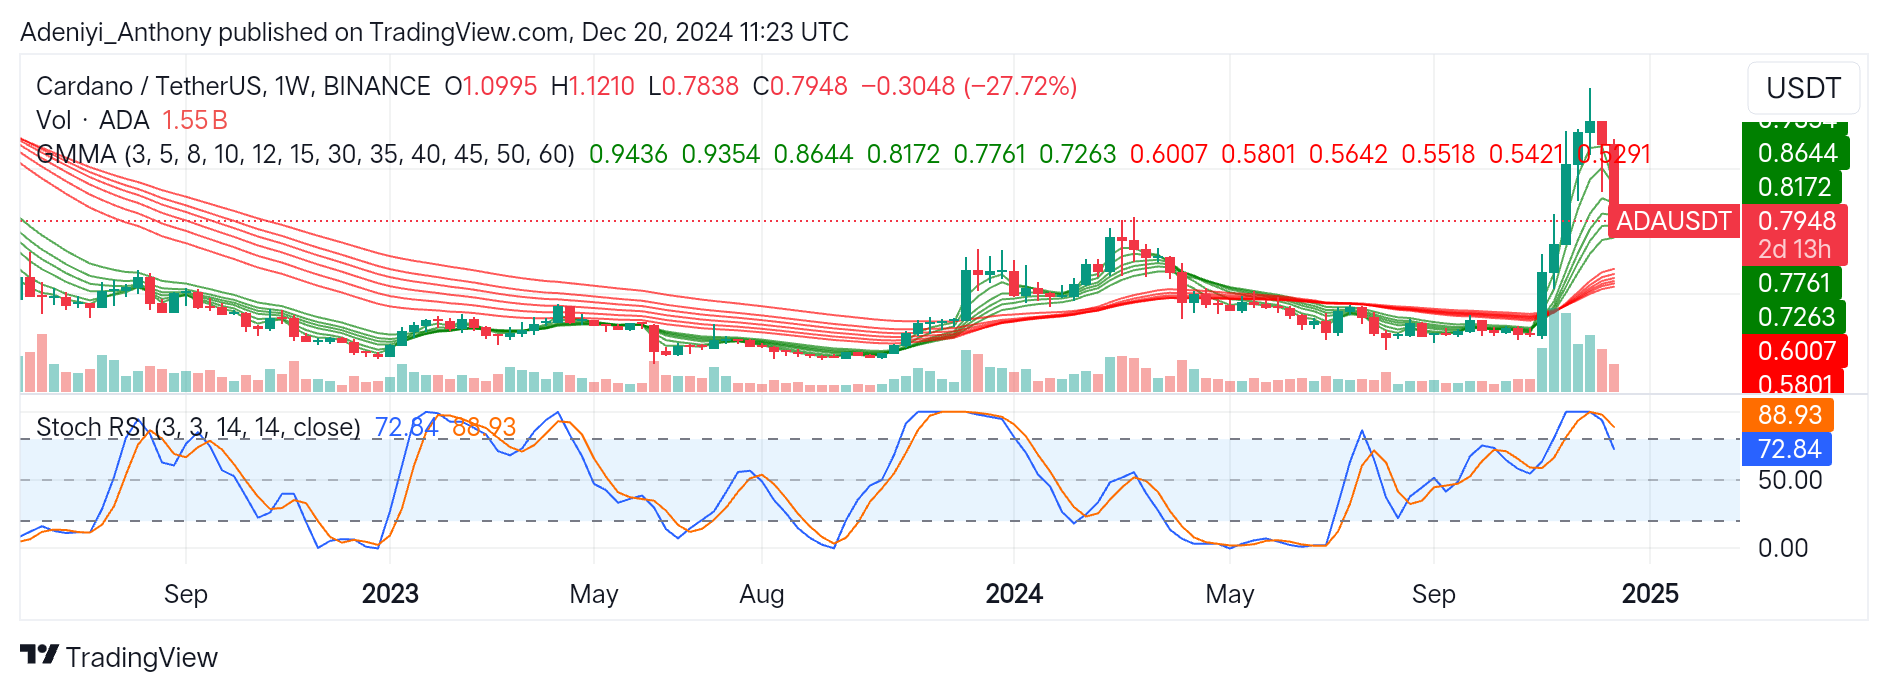
The Cardano and Tether pair has climbed strongly, breaking out of an extended consolidation phase and reaching a new high near $1.0995 in previous weeks. However, recent profit-taking and a larger correction have resulted in a downturn, increasing concerns about potential negative risks.

To this end, the recent decline reflects market uncertainty about whether ADA/USDT will resume its uptrend or retest lower support levels.

Currently, ADA/USDT trades at 0.7948 with 1.55 billion weekly traded volumes.

Cardano (ADA/USDT) Targets Previous Consolidation Zone
ADAUSDT-Weekly Chart

Technical Indicators

Major Resistance Levels: $0.8172, $0.9436, and $1.1210

Major Support Levels: $0.7263, $0.6007, and $0.5801

Cardano Technical Analysis

The analysis of Cardano against the Tether shows the pair’s price is falling back into a previous ranging zone after failing to sustain momentum above the newly set height. The Guppy Multiple Moving Averages (GMMAs) suggest a recent weakened uptrend, as the shorter-term EMAs flatten out, converging towards the longer-term EMAs.

Also, at the bottom of the chart, the Stochastic RSI signals a downtrend, as the lines indicate a move away from the overbought zone with the indicator’s lines pointing to the South.

In the near term, Cardano needs to hold above the $0.7263 level to prevent further downtrend; otherwise, a dip below this level would lead to a retest of $0.6007 or lower support.

ADA/USDT Analysis: Expectations

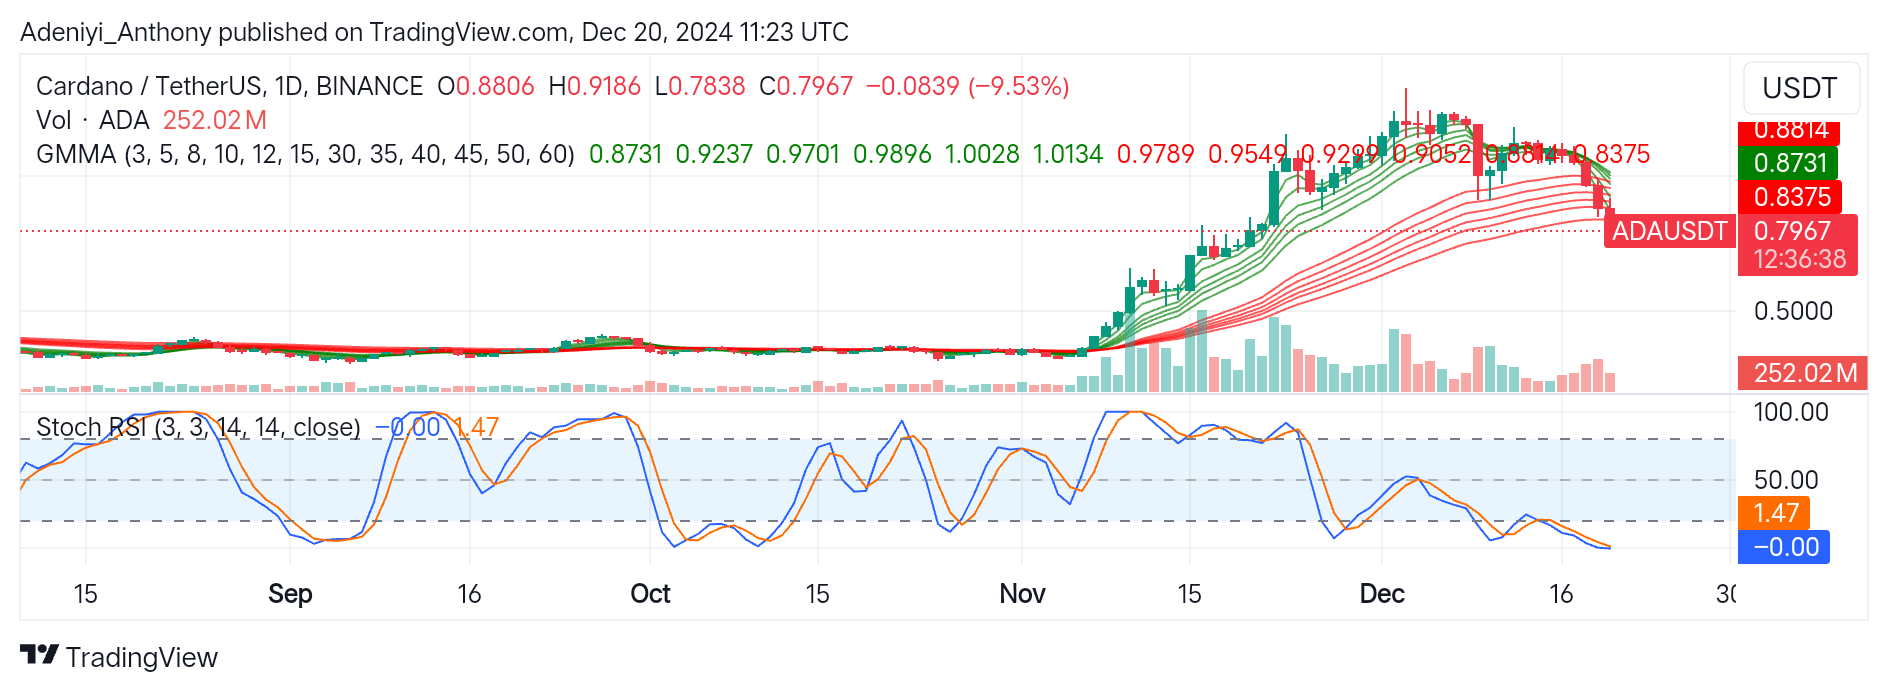
ADA/USDT on the daily timeframe has shown a sharp price decline, with the pair facing selling pressure.

Recent price action shows the price is below the $0.7967 key support level. However, this bearish sentiment appears to be driven by weakening momentum, as seen in the declining trading volume, as prices slide further to the South.

The GMMAs on the chart have displayed a bearish crossover, with the short EMAs mixing with the long EMAs, signaling increased downward pressure as buying interest decreases.

On the other hand, the Stochastic oscillator indicates an oversold condition with both lines operating in the extremely lower values. This suggests that the downtrend may persist without a strong bullish catalyst anytime soon.

To this end, ADA/USDT needs to break above $0.8814 with strong buying interest for an upside recovery; otherwise, a dip below $0.7967, the current price, could lead to further stretch to the South.

Cardano (ADA/USDT) Targets Previous Consolidation Zone
ADAUSDT-Daily Chart


You can purchase crypto coins here. Buy LBlock

JITO (JTO/USD) Bear Market Slows as Price Nears $2.50

Recently, the Jito market has experienced a persistent bearish trend, primarily driven by profit-taking triggered near the $4.50 price level. Since then, the price action has consistently moved downward, gaining further bearish momentum and significantly increasing market volatility. However, despite this heightened volatility, the bearish trend appears to be slowing as the price approaches the $2.50 level. Bulls are becoming active in this price zone, capitalizing on the increased volatility to curb the bears’ momentum and gradually shift the market back into an upward trajectory.

Jito Market Data

  • JTO/USD Price Now: $2.87
  • JTO/USD Market Cap: $372 million
  • JTO/USD Circulating Supply: 131 million JTO
  • JTO/USD Total Supply: 1 billion JTO
  • JTO/USD CoinMarketCap Ranking: #166

JITO (JTO/USD) Bears Market Slows Down As Price Nears $2.5

Key Levels

  • Resistance: $3.00, $3.50, and $4.00
  • Support: $2.30, $2.00, and $1.50.

The Jito Market Through the Lens of Indicators

In November, the Jito market experienced significant upward momentum, successfully breaking through multiple price levels. However, as the price approached the $4.00 level, bearish sentiment emerged, gradually eroding the bullish momentum. The price struggled to overcome this critical resistance, leading to a shift in market dynamics.

By mid-December, a bearish trend had taken hold, although the market showed notable pivot points in its price action. A price rebound occurred, but resistance quickly formed at the $3.00 level. Despite the bounce, a long-legged doji candlestick emerged at this level, signaling indecision and a balanced struggle between demand and supply.

This indecisiveness has heightened the pressure on the bulls, leaving the recovery uncertain. A decisive test of bullish strength will occur if the price successfully breaks above the $3.00 resistance. If the breakout fails but bullish sentiment remains intact, the market may consolidate at this level, consistent with its historical performance, as it did during November’s rally.

JITO (JTO/USD) Bears Market Slows Down As Price Nears $2.5

JTO/USD Price Prediction: 4-Hour Chart Analysis

A closer analysis of the 4-hour chart reveals that the $3.00 level has emerged as a significant resistance point, consistently rejecting bullish price attempts in recent sessions. This resistance persists despite the trade volume indicator showing substantial histograms, signaling an increase in buying activity. However, these efforts have so far been countered by strong bearish pressure at the $3.00 mark.

Notably, the Relative Strength Index (RSI) provides a basis for optimism. It indicates oversold market conditions, suggesting the potential for a bullish reversal. This RSI crypto signal could foster renewed bullish sentiment, increasing the likelihood of upward price movement in the near term.

Trade crypto coins on BYBIT!

Solana (SOL) Price Prediction: SOL/USDT Eyes Support of Over One Month  

Solana Price Prediction (December 20):

The Solana market has been retracing sharply downward. This downward retracement has spanned three sessions now. As a result, the market has fallen below more key technical landmarks as the market now eyes a very important support level.

SOL/USDT Long-Term Trend: Bearish (Daily Chart)

Key Price Levels:

Resistance: $200, $220, $240

Support: $190, $170, $150

Solana (SOL) Price Prediction: SOL/USDT Eyes Support of Over One Month  

Price activity in the Solana market fell below the $200 support level in the previous session. The ongoing session remains on the same track but has produced a much smaller downward retracement. The market now hovers just above the support level at the $185.00 threshold. Consequently, the more recent price candle lies below the 20- and 50-day Moving Average curves. In addition, the Stochastic Relative Strength Index (RSI) lines are also falling sharply into the oversold region of the indicator.

Solana Price Prediction: SOL/USDT Bears Slow Down

Solana’s price action has been under strong headwinds for the past two sessions. As can be seen, price action retraced to lower price levels very strongly during the past two sessions. As a result, price action now lies below the 20- and 50-day MA curves. Also, the Stochastic RSI lines continue to descend into the oversold region of the indicator.

However, the last price candle, corresponding to the ongoing session, can be seen appearing red but seems to have produced a lesser downward retracement than that of the previous two sessions. The corresponding price candle has appeared as an inverted hammer, which suggests a possible trend reversal in this market.

Solana Price Prediction: SOL/USDT Oscillates Just Below the $200 Threshold (4-Hour Chart)

Following price action’s dip below the $200 price level, the market has been oscillating between the $190 and $200 price levels. However, the ongoing session has delivered a moderate downward retracement in the Solana 4-hour market. Also, here, price action now lies below all the MA curves. Meanwhile, the Stochastic RSI lines still have an upward trajectory in the oversold region.

Solana (SOL) Price Prediction: SOL/USDT Eyes Support of Over One Month  

Technically, it appears that this market has two nearby support levels: one at the $190 mark and the other at the $185 threshold level. Consequently, a potential rebound may occur at the $190 or the $185 price level, toward the ceiling at the $200 price level.

Get Solana here. Buy SOL 

Skynet Gets $1.2 Million to Make AI Smarter

Skynet has raised $1.2 million to improve how artificial intelligence (AI) is used for making payments for services globally.

Investors from big companies like GitHub and Polygon gave money to help Skynet build a system called “The World’s Resource Blockchain™.” This system will help AI do tasks and make payments on its own, without needing humans.

The Problems Mitigating the Growth of AI and Skynet’s Roles

Even though AI has become very advanced, it still struggles with some challenges. Therefore, AI often needs secret codes, special logins, or approvals to use services called KYC (Know Your Customer). These problems mean humans have to step in, stopping AI from working fully on its own.

To this end, Vishnu Korde, the CEO of Skynet, has said “The future is about creating tools for AI, not just people.” Skynet’s new system will let AI connect to services, pay for what it needs, and do jobs independently.

Skynet Gets $1.2 Million to Make AI Smarter
Source: Cryptonews.com

Introducing Skynet’s Special Tools

Skynet uses a special tool called Smart Access Points. These tools let AI easily connect to services like AWS, Shopify, or Booking.com. With this tool, AI can find resources and make payments without needing lots of different wallets or systems. 

Additionally, the firm uses advanced technology from Arbitrum to make things faster and smoother. This helps AI do tasks like booking trips or handling money easily. By 2030, Skynet’s CEO thinks AI will become a digital helper, handling jobs for people and using the internet in new ways.

Skynet Innovation: A Smarter Future for AI 

As AI continues to improve, Skynet’s tools will make it even more useful. By helping AI work in many industries, Skynet is creating a future where AI can do its tasks without human help. 

With Skynet leading the way for a smarter future, an exciting step towards a world where AI can handle almost anything independently has been created.


In order to place winning trades with us via Bybit, you can open an account here.


Tamadoge (TAMA/USD): Bulls and Bears Clash at the $0.0014 Level

Tamadoge (TAMA) is currently experiencing a fierce struggle between bullish and bearish forces following its failure to break above the critical $0.0016 resistance level. The bullish momentum has faced repeated rejection at this level for some time. After the latest rejection, the price dropped to approximately $0.00125 before rebounding, establishing support around the $0.0014 level. As a result, the market remains in a consolidation phase, with volatility persisting.

Key Levels

  • Resistance: $0.0018, $0.0019, and $0.0020
  • Support: $0.001, $0.0009 and $0.0008

Tamadoge (TAMA/USD): Bulls and Bears Clash at the $0.0014 Level

TAMA/USD Price Analysis: The Indicators’ Point of View

The indicators suggest a phase of consolidation as the Tamadoge price action remains range-bound despite notable market volatility. The Bollinger Bands highlight that, as bulls and bears continue their struggle at this level, the bands’ convergence indicates a significant decline in volatility. Price swings are gradually stabilizing around the $0.0014 level. This crypto signal suggests that the market is preparing for a significant move, potentially a breakout above the $0.0016 resistance level.

Tamadoge (TAMA/USD): Bulls and Bears Clash at the $0.0014 Level

Tamadoge Short-Term Outlook: 1-Hour Chart

On a smaller timeframe, the consolidation persists, with bulls maintaining a firm hold at a critical support level within the horizontally moving price channel. The key support level is $0.0013, and recent bearish attempts to approach this level have shown diminishing momentum. This indicates that the market may be preparing for a bounce, potentially targeting the $0.0016 resistance level. Additionally, higher support levels could form at $0.00145 or $0.0015.

Buy TAMA!

Buy TAMA today!

$SPONGE (SPONGE/USD): Poised for a Bullish Breakout

In our previous analysis of the SPONGE/USD market, we observed a sharp decline in price to $0.0000006. As anticipated, the market bounced back and is now stabilizing at $0.0000368, above the critical $0.00003 support level. The bulls are maintaining a firm position at this level, possibly setting the stage for a rally toward the key $0.00006 price level. Let’s delve deeper into the market analysis by examining the insights provided by key technical indicators.

Key Market Dynamics:

  • Resistance Levels: $0.00005, $0.000055, $0.000060
  • Support Levels: $0.000020, $0.0000195, $0.000019

$SPONGE (SPONGE/USD): Poised for a Bullish Breakout

$SPONGE Technical Outlook

In recent trading sessions, we observed increased downward volatility as the price of SPONGE/USD reached a new low. Despite this, bullish sentiment remains strong around the $0.00003 support level, extending its influence toward the $0.00006 resistance level. This dynamic has contributed to heightened market volatility.

However, the bulls continue to hold firm above the $0.00003 level. Notably, technical indicators suggest the possibility of a breakout, highlighted by a bullish divergence. Analyzing the chart reveals a divergence between price action and the Moving Average Convergence and Divergence (MACD) indicator: while the price declined from approximately $0.000054 to $0.000037, the MACD histogram within the same trading session trended upward.

This discrepancy may signal an impending bullish move in the crypto market, suggesting that traders should anticipate a potential bounce, with the price likely rallying back toward the $0.000054 level.

$SPONGE (SPONGE/USD): Poised for a Bullish Breakout

$SPONGE (SPONGE/USD) 1-Hour Chart Insights

In the recent trading session, a shooting star candlestick pattern has appeared on the chart. Typically, this signals a potential move for the market to trend lower. However, the tall histogram accompanying the pattern indicates significant bearish pressure. Despite this, the bulls have shown resilience in defending their position. As a result, the price may hold its ground and, instead of breaking lower, could potentially bounce higher.

Buy $SPONGE!

Join the SPONGE community and be part of the next big crypto sensation! Buy Sponge ($SPONGE) today!

The Amp Market (AMP/USD): Bulls Target Potential Rebound at $0.008

The AMP market has shifted downward following a bullish peak above the $0.014 price level. Profit-taking at this high triggered bearish momentum, driving the price downward and eventually breaking below the critical $0.010 support level. With this breach, optimistic traders redirected their focus to the $0.008 price level, which emerged as a significant support zone. Notably, the price action displayed a bounce after testing this critical level, highlighting its importance in the market’s dynamics.

AMP Market Data

  • AMP/USD Price Now: $0.0089
  • AMP/USD Market Cap: $734 million
  • AMP/USD Circulating Supply: 81 billion AMP
  • AMP/USD Total Supply: 99.2 billion AMP
  • AMP/USD CoinMarketCap Ranking: #124

The Amp Market (AMP/USD): Bulls Target Potential Rebound at $0.008

Key Levels

  • Resistance: $0.010, $0.011, and $0.012.
  • Support: $0.007, $0.006, and $0.005.

Price Prediction for The Amp Market: The Indicators’ Point of View

The correction in the AMP market was just as strong as the preceding bullish run, which peaked above the $0.014 price level. The rapid surge in price triggered heightened volatility, leaving the bulls vulnerable and empowering the bears at the $0.014 level. This shift in momentum allowed the bears to overrun the market, with increased volatility amplifying their dominance.

As the bearish price action reached the $0.01 level, a brief struggle emerged. Some traders anticipated a potential bounce from this critical level, especially given the significant decline in trading volume. However, contrary to these expectations, the bears prevailed, even as volatility began to subside.

Looking ahead, the $0.008 price level offers a potential point of interest for bullish traders. Historically, during the last bull run, the market faced notable resistance at this level. Once the price broke above and captured it, this resistance likely transitioned into support. This historical significance could explain the immediate bounce observed when the price tested this level, fostering bullish sentiment among some traders.

That said, the descending peaks in the price chart suggest that the bears may still hold an advantage. If the $0.008 level manages to maintain its bullish bias, the crypto signal may consolidate at this zone before finding a clearer direction, potentially moving to the upside.

The Amp Market (AMP/USD): Bulls Target Potential Rebound at $0.008

AMP/USD 4-Hour Chart Outlook

The low participation of demand and supply in the market is evident when analyzing the 4-hour chart. Trade volume is represented by histograms of consistently low height, indicating minimal activity. Initially, price action moved sideways, but gradually, the bears began to gain control, driving the price downward toward the $0.008 level.

The market’s downward slide reflects the bears exerting only a small amount of pressure, yet it significantly impacted the market, pushing prices lower. While the low volatility and gradual bearish movement may encourage the development of bearish sentiment, traders should remain cautious and observe the behavior around the $0.008 price level.

If consolidation persists at this level, it could weaken bearish momentum and eventually pave the way for a bullish rebound, pushing the price toward higher levels. Patience is advised to assess whether the bulls can establish dominance at this critical zone.

Trade crypto coins on BYBIT!

Ethereum (ETH/USDT) Signals a Pullback After a Prolonged Uptrend

Ethereum Long-term Analysis: Bullish

The market for Ethereum against Tether is currently facing a correction after an overextended rally above $4,100. The weekly chart for the pair shows that there has been a bullish trend with a persistent aim for new heights since late 2023. However, current price action suggests a potential pullback to $3,542 might be near.

Recently, the price of Ethereum extended above $4,000, after which the formation of the next candlestick signals a short correction. However, it seems the current move lacks strong conviction, as seen in the moderate weekly trading volume.

Currently, Ethereum is trading at $3,713.79, with a 6.20% decline from the previous trading session.

Ethereum (ETH/USDT) Signals a Pullback After a Prolonged Uptrend
ETHUSDT-Weekly Chart

Technical Indicators

Major Resistance Levels: $3,992.05, $4,107.80, and $4,500

Major Support Levels: $3,542.22, $2,890.89, and $1,789.73

Ethereum Technical Analysis

The analysis of Ethereum against the USDT on a weekly timeframe shows that the pair is currently overbought as seen in the price actions around the upper Bollinger band and the positioning of the Stochastic lines. However, the current dip lacks the traders’ support. Therefore, a spike in volume would confirm either a breakout or breakdown.

Therefore, a breakout towards $4,500 will be seen if the pair’s price closes above the $3,992 level. conversely, a dip below $3,542.22 would push the price down to $2,890.89.

ETH/USDT Analysis: A Recovery or Continued Downtrend?

On the daily timeframe, ETH/USDT’s price action shows early signs of recovery after finding support at the lower Bollinger band. However, the Stochastic oscillator suggests an oversold condition with a reversal attempt. Therefore, a spike in the trading volume beyond the daily $310.17k might fully change the direction of the lines.

Till then, traders should watch price action for a breakout above the midline at $3,814.96 or rejection for range-bound activities at the same level.

Ethereum (ETH/USDT) Signals a Pullback After a Prolonged Uptrend
ETHUSDT-Daily Chart


You can purchase crypto coins here. Buy LBlock

Uniswap (UNI) Price Prediction: UNI/USDT Bearish Correction Is Pulling the Brakes

Uniswap Price Prediction (December 19):

The Uniswap market has been volatile, resulting in the market moving widely between the $18.50 and $14.00 threshold levels. Currently, there are indications that suggest the market may be resisting further downward corrections.

UNI/USDT Long-Term Trend: Bearish (Daily Chart)

Key Price Levels:

Resistance: $15, $16, $17

Support: $14, $13, $12

Uniswap (UNI) Price Prediction: UNI/USDT Bearish Correction Is Pulling the Brakes

The last price candle on the chart corresponding to the ongoing session has appeared to contract upward above the $14 mark. However, this price candle has appeared below the 20-day Moving Average (MA) lines but still stands above the rest of the MA curves. Simultaneously, the Stochastic Relative Strength Index lines have reached deep into the oversold region. Likewise, the terminal part of the indicator line has now turned sideways while the lagging line of the indicator closes in for a possible crossover.

Uniswap Price Prediction: UNI/USDT Bulls Look Threatening

Indications arising from the UNI/USDT market suggest that downward forces may be fizzling out. Also, it seems like upside forces have the just grounds to regain control of the market, seeing that price action lies above most of the MA lines. The last price candle on the chart appears contracted upward, and this suggests that upside forces are active.

However, more efforts may be needed as it appears that the downward troops aren’t ready to give up that easily. Meanwhile, the Stochastic RSI lines are now in the oversold region but seem to be converging for an upward crossover there.

Uniswap Price Prediction: UNI/USDT Bearish Momentum Grows Thinner (4-Hour Chart)

Price action in the Uniswap 4-hour market appears to have more downward progress across the MA lines. Price activity here has fallen below most of the MA lines. As a result, price action only lies above the 200-day MA curve.

However, the last price candle has appeared very small, indicating that downward forces are getting weaker. Likewise, the Stochastic RSI lines are converging for a bullish crossover in the depth of the indicator’s oversold cone. Consequently, market participants can expect an upward price rebound in this market.

Get Uniswap here. Buy UNI