Dash 2 Trade Price Predictions for Today, December 19: D2TUSD May Breakup the $0.00460 Resistance Level

<strong<>

Dash 2 Trade Price Forecast: D2TUSD May Breakup the $0.00460 Resistance Level (December 19)

D2TUSD has been in a downtrend for a while; the rice may likely resume an uptrend and this may break up the $0.00460 resistance level soon. The crypto price is set for another upward rally after a long dip dump by the bears. Therefore, if buyers can put more effort into their tension in the market, a shift in the trend upward to a $0.01000 upper resistance level could be achieved.

Key Levels:
Resistance levels: $0.00113, $0.00114, $0.00115
Support levels: $0.000850, $0.000840, $0.000830

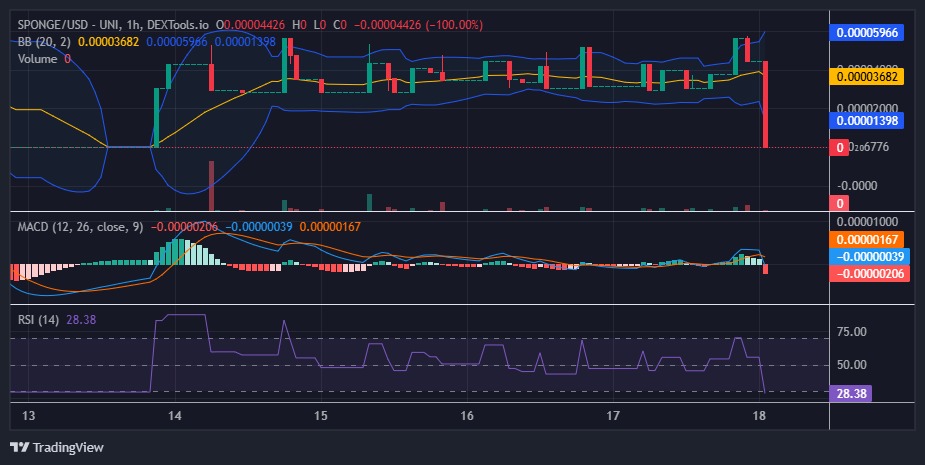
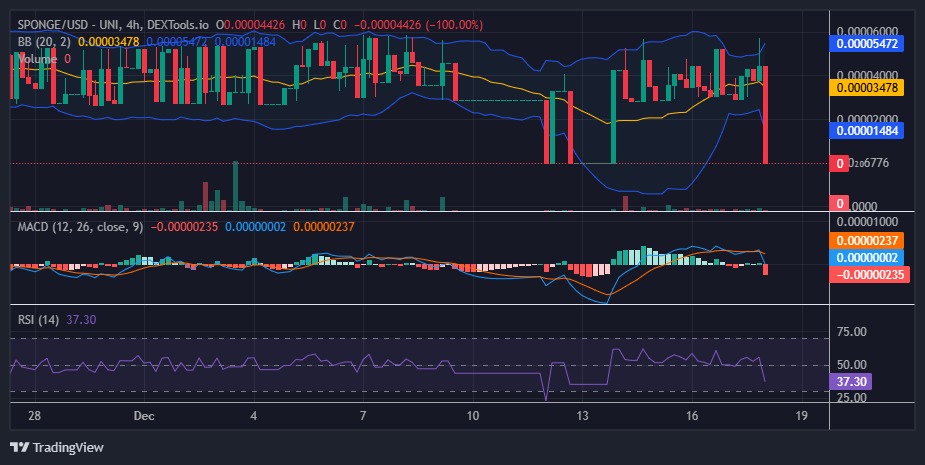
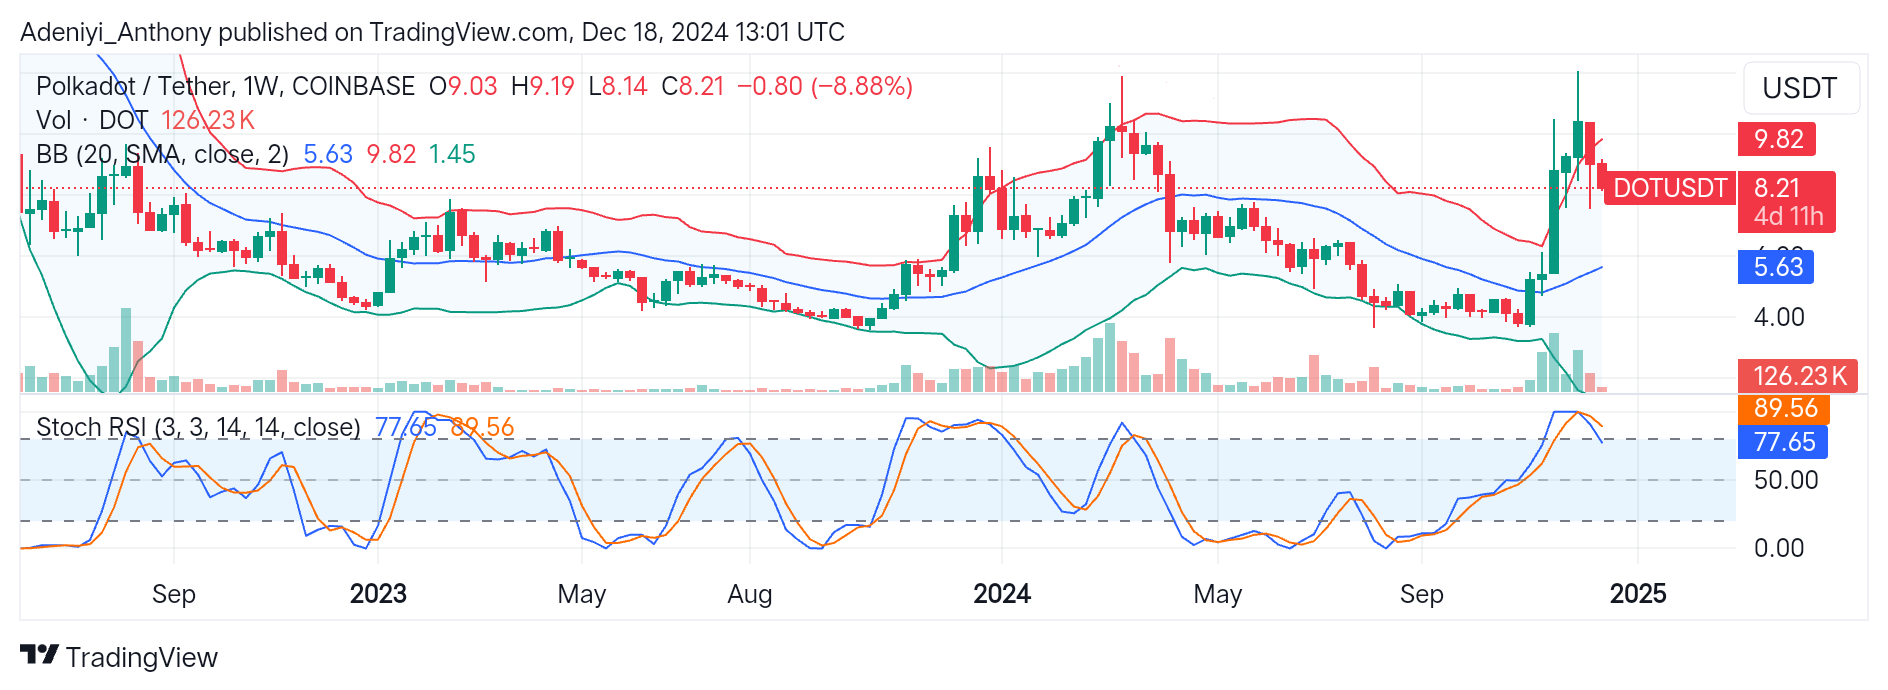
D2T (USD) Long-term Trend: Bearish (Daily Chart)

D2TUSD indicates a downward trend in its long-term perspective. The crypto price has been below the supply trend levels since its most recent low due to the persistent bearish pressure over the last few days. The coin is about to turn positive and may break the mentioned supply level as the market is already oversold.
Dash 2 Trade Price Predictions for Today, December 19: D2TUSD May Breakup the $0.00460 Resistance Level
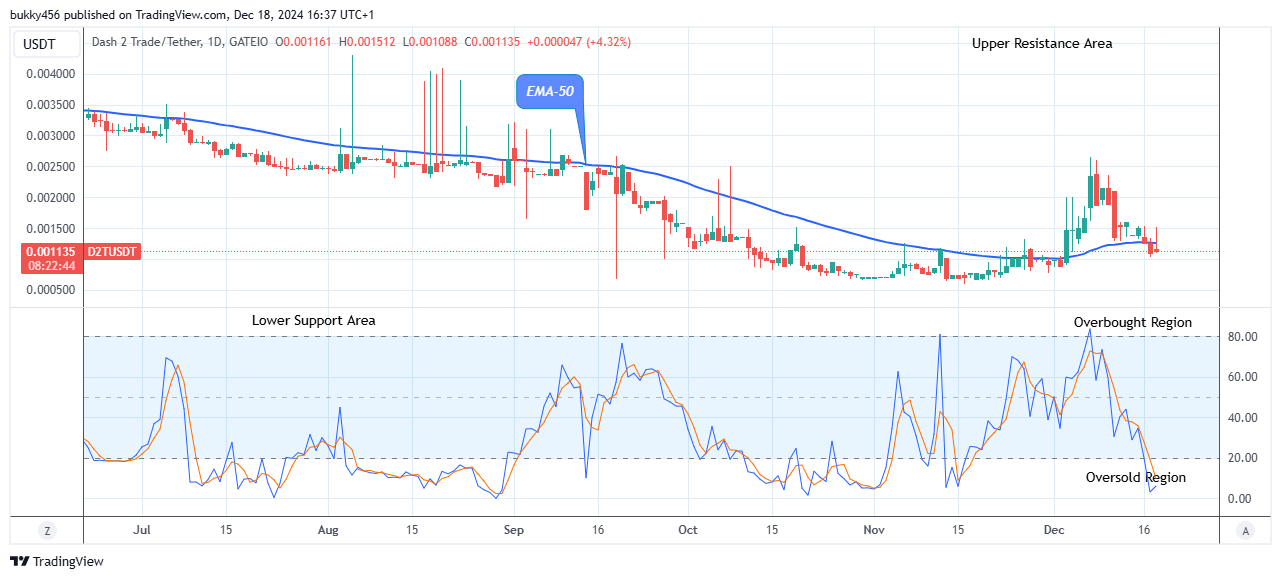
Actions from the bears with a bearish pin bar hammer candle at the $0.00108 supply value below the EMA-50 as the daily chart opens today, indicate the Dash 2 Trade pair may experience a price reversal at the $0.00108 low point and a break up at the $0.00460 peak level is possible soon, if the bulls could add more speed to their buying forces.

Notably, the market price of D2TUSD is pointing up in the oversold region, suggesting that the momentum in the coin price will turn upside down sooner.

Hence, the next jump by the bulls may surge to break up at $0.00460 and extend to reach a $0.01000 upper resistance level in the days ahead in its higher time frame.

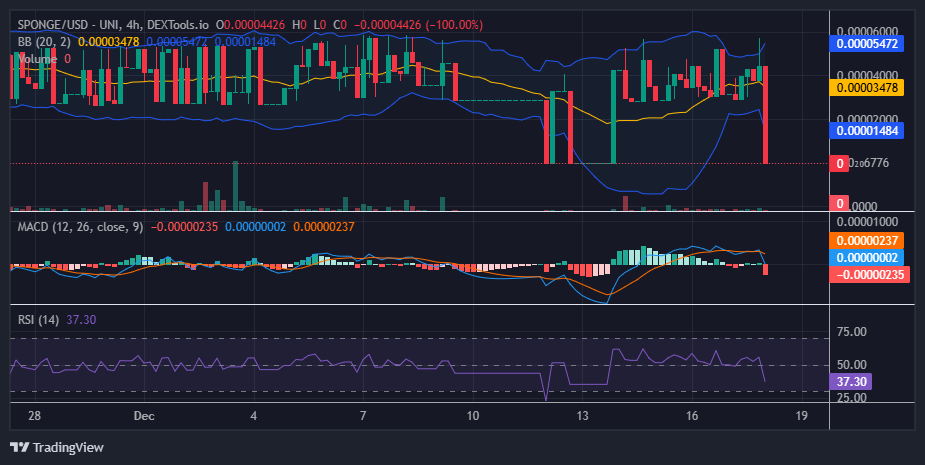
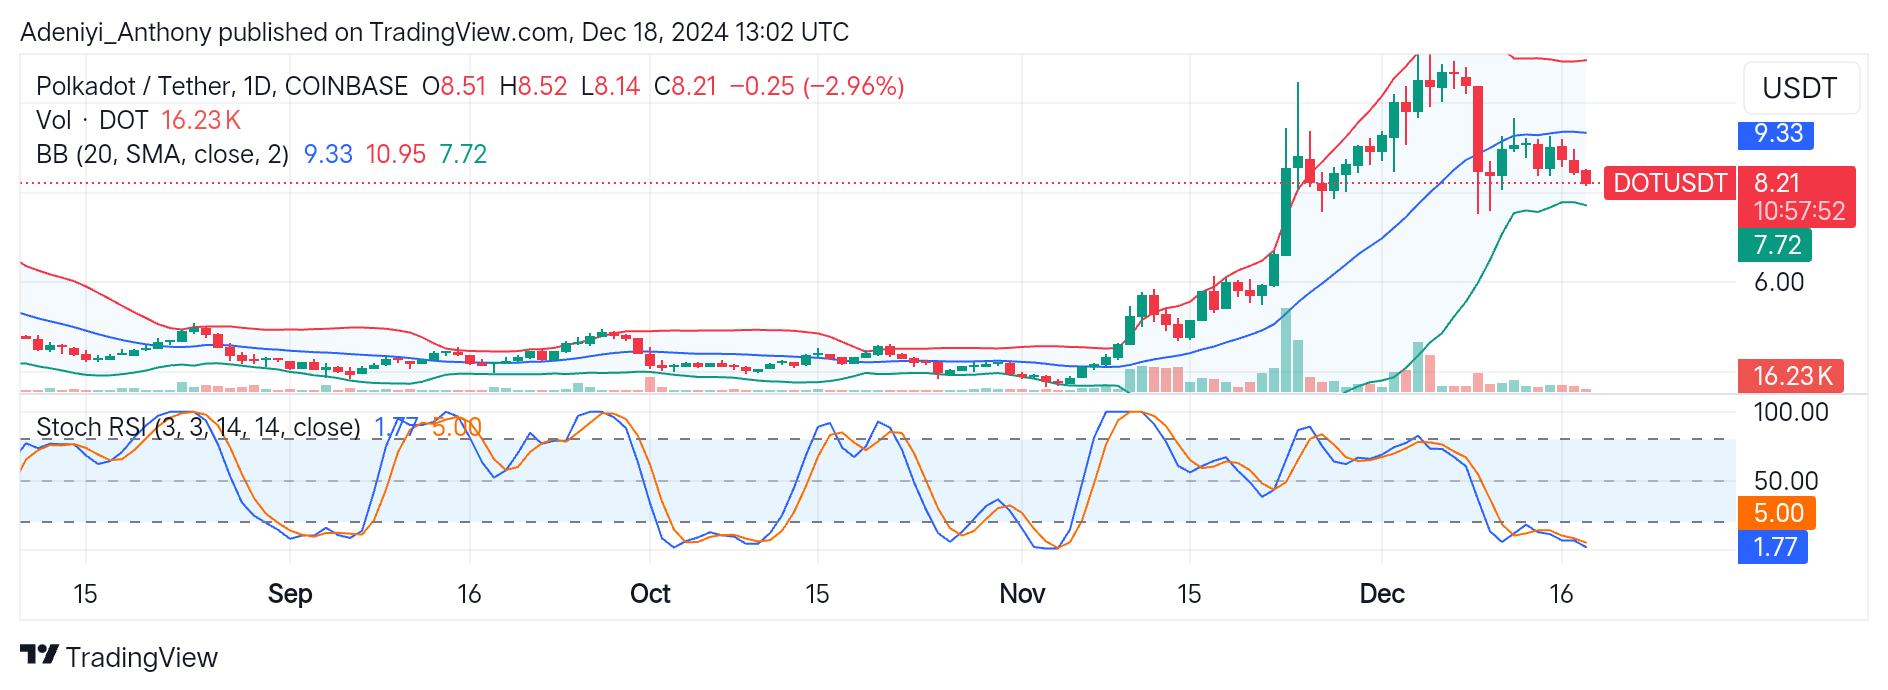
D2T (USD) Medium-term Trend: Bearish (4H Chart)

The momentum on the medium-term outlook looks bearish, but it is starting to turn bullish as seen from the chart.
Dash 2 Trade Price Predictions for Today, December 19: D2TUSD May Breakup the $0.00460 Resistance Level
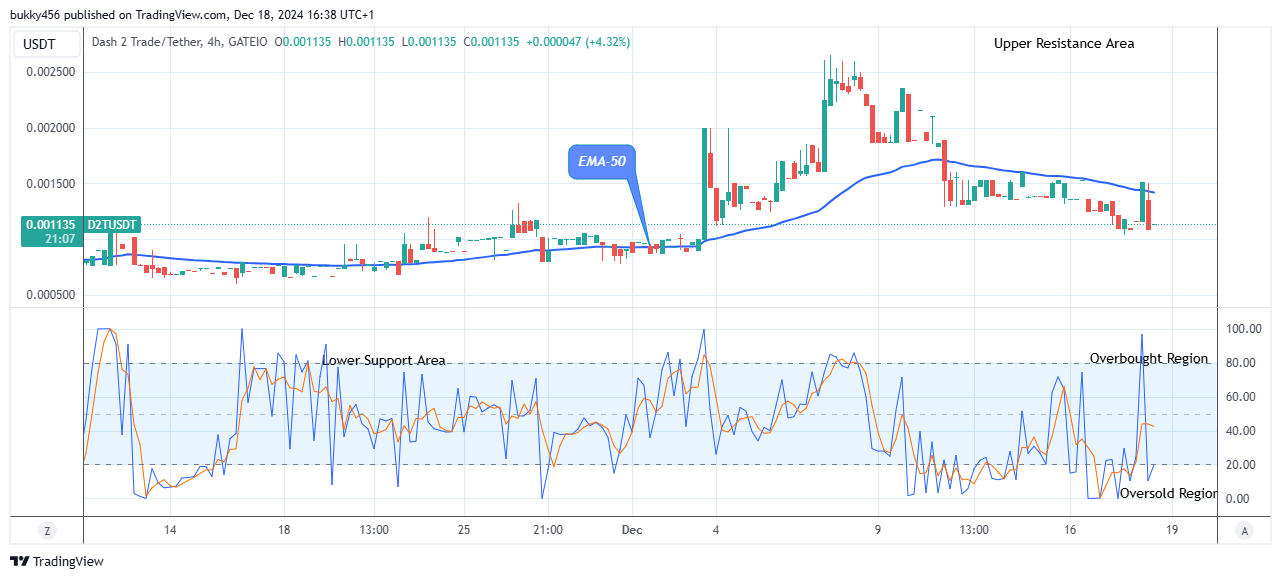
The price of D2TUSD is currently trading at the resistance close to the EMA-50. So, it seems likely that the bulls are about to take over and may likely break the $0.00265 supply level as soon as we see a new correction in place.

Despite the interference of the short traders, the bulls caused a rise to a $0.00113 high level below the EMA shortly after the commencement of the 4-hourly chart opens today, indicating a genuine reversal that may break up the resistance levels soon.

Thus, buyers must add more pressure to their activities to move the market beyond the current price level.

In addition, the market is pointing up in the oversold region, indicating a buy potential is near. As a result, the long traders may emerge and push the market price of Dash 2 Trade to break the $0.00460 resistance level soon in its medium-term time frame.

The most recent cryptocurrency news from across the world is now sent straight to our Discord channel by Dash 2 Trade.


Want a coin that has a huge potential for massive returns? That coin is Dash 2 Trade. Buy D2T now.

$SPONGE (SPONGE/USD) Positioned for Potential Upswing

The $SPONGE market has recently witnessed a surge in buying pressure, reigniting volatility and propelling prices toward the $0.00006 mark—an established resistance level that has been tested multiple times. Despite this bullish push, the market retraced sharply to a new low of $0.000006, reflecting heightened volatility as noted in earlier analyses.

While such a dramatic dip might raise concerns of a bearish shift, historical patterns suggest otherwise. This movement could represent a calculated buying opportunity for traders looking to leverage the market’s inherent resilience for future gains.

Key Levels to Monitor:

  • Resistance: $0.00005, $0.000055, $0.000060
  • Support: $0.000020, $0.0000195, $0.000019

$SPONGE (SPONGE/USD) Positioned for Potential Upswing

$SPONGE (SPONGE/USD) Technical Analysis

Today’s trading session saw notable bullish activity driving $SPONGE toward the crucial $0.00006 resistance level. However, the momentum faltered, resulting in a sharp retracement to $0.000006, amplifying volatility. This heightened activity in the crypto signal could pave the way for a rebound, with traders eyeing $0.00003 as a pivotal support zone.

The $0.00003 level presents an attractive entry point for strategic trades, offering both new and seasoned investors a chance to capitalize on the market’s potential recovery. With the current dip in prices, there is room for significant gains if bullish momentum resurfaces.

$SPONGE (SPONGE/USD) Positioned for Potential Upswing

SPONGE/USD 1-Hour Chart Analysis

Insights from the Bollinger Bands on the 4-hour chart align with previous observations. Despite the recent sharp price drop, the bands remain steady, reinforcing $0.00003 as a robust support level for long positions.

This stability diminishes the likelihood of a prolonged bearish trend. With the market’s recent attempts to test higher levels, a significant breakout could be on the horizon, making this a critical moment for traders to position themselves strategically.

Buy SPONGE/USD!

Join the SPONGE community and be part of the next big crypto sensation! Buy Sponge ($SPONGE) today!

$SPONGE (SPONGE/USD) Poised for Potential Upside Movement

Recently, the SPONGE/USD market experienced a surge in buying momentum, reigniting market volatility. This buying activity pushed the price close to the $0.00006 level, a critical resistance that has been tested multiple times. However, the heightened volatility was evident as the market sharply declined to a new low of $0.000006, as highlighted in the previous analysis.

While this sharp decline may raise concerns about potential downward movement, historical data suggests otherwise. Rather than signaling an immediate bearish trend, this could represent a strategic buying opportunity for traders looking to capitalize on the market’s resilience.

$SPONGE (SPONGE/USD) Poised for Potential Upside Movement

Key Market Dynamics:

  • Resistance Levels: $0.00005, $0.000055, $0.000060
  • Support Levels: $0.000020, $0.0000195, $0.000019

$SPONGE (SPONGE/USD) Technical Outlook

Earlier today, the market experienced significant bullish activity, driving the price toward the critical $0.00006 level. However, the SPONGE/USD bulls were unable to sustain the momentum at this threshold, resulting in a sharp decline to the $0.000006 level, which further heightened market volatility. This increased volatility raises the potential for a sharp price rebound in the near term.

A key level for traders to watch remains $0.00003, which continues to act as a strong support zone. This level could serve as an ideal entry point for strategic trades. Additionally, new investors may consider taking advantage of the current dip in price, presenting a potential opportunity to maximize profits if the market rebounds.

$SPONGE (SPONGE/USD) Poised for Potential Upside Movement

$SPONGE (SPONGE/USD) 1-Hour Chart Insights

The Bollinger Bands indicator on the 4-hour chart provides a similar insight as observed previously. Despite the recent sharp decline in price action, the bands remain relatively unchanged, indicating that the $0.00003 level continues to be a favorable entry point for a long position.

This stability suggests that the market is unlikely to adopt a sustained downward trend. Given the market’s recent attempts to test higher levels, there is a strong possibility of a significant breakout in the near future.


Join the SPONGE community and be part of the next big crypto sensation! Buy Sponge ($SPONGE) today!

TrueUSD Under Fire: Transparency Concerns Plague Popular Stablecoin

The Securities and Exchange Commission (SEC) recently directed its focus toward TrueUSD (TUSD), one of the prominent stablecoins in the cryptocurrency market, with an estimated circulation nearing half a billion dollars. Widely regarded as a reliable option for digital transactions and investments due to its promise of being fully backed by reserves, TUSD has now come under scrutiny for alleged practices that could undermine its credibility. The SEC’s allegations suggest a troubling narrative of potential mismanagement, misuse of user funds, and a pervasive lack of transparency in operations. This development not only raises questions about TUSD’s integrity but also casts a broader shadow over the stablecoin sector, which is often seen as a bridge between traditional finance and the digital asset economy.

Allegations of Misconduct:

According to the SEC, TrueUSD allegedly engaged in a series of questionable practices. These include:

  • Phony Attestation Reports: The reports verifying TUSD’s backing may have been fabricated.
  • Opaque Ownership Structure: The true ownership of TrueUSD may not have been transparent.
  • Risky Investments: The assets supposedly backing TUSD were allegedly funneled into an illiquid “commodity fund” instead of safe havens like government bonds.

These practices call into question the stability and trustworthiness of TrueUSD. The SEC settlement, which neither confirms nor denies the allegations, adds another layer of frustration for investors seeking clarity.

Expanded Timeline of Alleged Misconduct:

The SEC’s complaint outlines a detailed history of potential misconduct involving TrueUSD (TUSD), alleging actions that may have compromised the trust and safety of investors and users. Below is an expanded timeline of key events that highlight the unfolding situation:

March 2020: Alleged Risky Investments Begin
The complaint asserts that TrueUSD’s operators began diverting user funds under the guise of operating a “commodity fund.” Instead of maintaining the required reserves to back TUSD tokens fully, these funds were allegedly channeled into high-risk investments, undermining the stability and trustworthiness of the stablecoin.

August 2021: Capital Injections from Major Investment Firms
During this period, prominent investment firms reportedly injected significant capital into TrueUSD. However, the SEC alleges that these firms were unaware of the misappropriation of user funds and the risky financial maneuvers taking place behind the scenes. This infusion of capital seemingly lent credibility to TUSD, potentially attracting more users and exchanges to the stablecoin ecosystem.

September 2022: Adoption by Major Exchanges
The SEC’s timeline highlights that leading cryptocurrency exchanges, including Binance.US and Binance, began supporting TUSD. By listing the stablecoin, these exchanges inadvertently provided broader exposure to users, which the complaint suggests may have amplified the risks to those investing in or using the token.

March 2023: Incentivization of TUSD Trading
In a move aimed at increasing trading volumes, Binance reportedly introduced incentives for trading TUSD. This led to a sharp rise in the creation of new tokens, many of which the SEC claims were potentially unbacked. This surge in TUSD issuance without proper reserves further exacerbated the risks for users, as it allegedly undermined the token’s promise of stability and transparency.

This timeline reflects the SEC’s allegations of systemic misconduct, portraying a narrative of deceptive practices, risk amplification, and breaches of user trust over the years. If proven, these claims could have significant ramifications for TrueUSD and the broader cryptocurrency ecosystem.

Lessons Learned:

The TrueUSD case highlights the importance of transparency in the crypto space. Traditional stablecoin models invest in highly liquid assets, ensuring quick redemption for users. TrueUSD’s alleged approach created a risk of user funds becoming locked in an illiquid investment.

TrueUSD Under Fire: Transparency Concerns Plague Popular Stablecoin
Source: create.vista.com

Moving Forward:

There’s a growing sentiment that blatant fraud might become less common with increased scrutiny. However, the industry needs to move beyond superficial measures like questionable attestations. True and radical transparency, both on and off-chain, is crucial for building a trustworthy future for crypto.

The Bigger the Project, the Greater the Scrutiny:

This incident serves as a reminder: the bigger and more popular the project, the more critical it is to demand continuous and thorough scrutiny. Ultimately, fostering a culture of transparency within the crypto space may be the most effective way to prevent future mishaps and build user trust.

Trade crypto coins on BYBIT!

UNUS SED LEO (LEO/USD) Market Displays Strong Bullish Momentum Towards Higher Price Levels

UNUS SED LEO Price Prediction – December 18

UNUS SED LEO market displays strong bullish momentum towards higher price levels. There seems to be no sign of any major crash as the price keeps breaking major resistance.

The 9-day SMA, currently at $9.480, remains below the price, acting as dynamic support and confirming the ongoing uptrend. Additionally, the RSI hovers at 69.27, signaling strong bullish strength but remaining just below the overbought zone. This suggests there is still room for further upward movement before any significant pullback occurs. The confluence of these indicators supports the continuation of the bullish trend.

LEO/USD Market Key Levels:

Resistance levels: $9.000, $9.620, $10.710
Support levels: $7.940, $5.900, $5.390

LEO/USD – Daily Chart

The daily chart for LEO/USD shows that the market’s overall trend remains bullish.

Price action shows consistently higher highs and higher lows, reinforcing the bullish structure. LEOUSD recently broke through key resistance at $9.620, now acting as support, and is maintaining this breakout zone.

There is also a clear bullish order block near $9.000, which aligns with further support. As long as prices remain above these levels, buyers are likely to dominate and push prices higher.

UNUS SED LEO (LEO/USD) Market Displays Strong Bullish Momentum Towards Higher Price Levels

What is the projection for the LEOUSD market?

Given the current momentum, LEOUSD is projected to test the $10.710 resistance level, marking the next major target for buyers. If this level is broken, a continuation of the rally could see prices extending further into uncharted territory.

However, a minor pullback to retest $9.620 or the $9.000 order block may occur before the next leg up. The overall outlook remains bullish as long as support zones hold.

UNUS SED LEO (LEO/USD) Market Displays Strong Bullish Momentum Towards Higher Price Levels

LEO/BTC Price Analysis

LEOBTC is currently holding above the 0.00008870 support zone, with the 9-day SMA at 0.00009380 acting as immediate resistance. The RSI at 46.97 indicates mild bearish pressure but signals the potential for reversal as it nears oversold conditions.

A bounce from the 0.00008870 level could propel prices back to test 0.00009910, where a breakout would target the descending trendline near 0.00010640. As long as the price respects the support zone, the overall direction remains bullish in the medium term.

UNUS SEO LEO (LEO) Current Statistics
The current price: $9.6660
Market Capitalization: $8,820,000,000
Trading Volume: $416,759,000

Place winning LEO trades with us. Get LEO here

Polkadot (DOT/USDT) Signals a Potential Pullback at $9.82 After a Strong Rally

Polkadot Long-term Analysis: Bullish

The weekly chart of Polkadot (DOT) against the Tether (USDT) has shown a sharp upward movement followed by a retracement after a period of overextended upside trajectory since late September. This marks the significant gains recorded by the pair. However, since hitting the peak around $9.82, the pair is now back to the current level, aiming at the mid-Bollinger band. This movement signals a potential short-term pullback might be on the horizon.

Also, the analysis captures the current expansion of the Bollinger bands, indicating increased volatility. However, the positioning of the oscillator at the bottom of the chart suggests a cool-off as the pair seems to be near overbought.

Currently, Polkadot trades at $8.21 with a weekly traded volume of 126.23k.

Polkadot (DOT/USDT) Signals a Potential Pullback at $9.82 After a Strong Rally
DOTUSDT-Weekly Chart

Technical Indicators

Major Resistance Levels: $9.82, $10.50, and $12.00

Major Support Levels: $8.00, $6.50, and $5.63

Polkadot Technical Analysis

With the previous breakout at the $6.00 level, Polkadot against the Tether has experienced a surge in price towards $9.82. However, the current resistance seems to be strong as the pair is currently on a decline. Though the price of the pair is declining, an uptrend is expected if the $8.21 level is maintained with increased volume; otherwise, a breakdown from the mid-line would invalidate the bullish trend.

At the bottom of the chart, the Stochastic RSI suggests the price is cooling off, and a dip below the overbought region would confirm the bearish movement. To this end, traders should wait for a break below the $8.00 psychological level for a downtrend, while a break above the $9.82 level would indicate the continuation of the bullish trend.

DOT/USDT Analysis: An Uptrend or Continued Downtrend?

On the daily timeframe, DOT/USDT had reached a significant height in October. However, the price seems to be consolidating since dropping below the mid-band at $9.33 earlier this month.

Recent price actions on the daily chart show that the pair’s price is ranging after dropping below the mid-band due to significant profit-taking actions.

Additionally, the Stochastic RSI shows that the pair operates deep in the oversold region. However, a reversal to the North could be made if the lines make a bullish crossover; otherwise, the price may continue the range-bound movement or experience further dips. To this end, a rebound may occur soon, provided key support at $7.72 is strong.

Polkadot (DOT/USDT) Signals a Potential Pullback at $9.82 After a Strong Rally
DOTUSDT-Daily Chart


You can purchase crypto coins here. Buy LBlock

Avalanche (AVAX/USD) Market Bullish Continuation Signals Upward Move Toward Major Resistance

Avalanche Price Prediction – December 17

AVAXUSD market bullish continuation signals an upward move toward major resistance. The ongoing price action shows that the market is attempting to break through the $55.860 resistance.

The AVAXUSD daily chart indicates a bullish bias, supported by the 9-period SMA at $49.750, which currently aligns as dynamic support for the pair. The Moving Average Convergence Divergence (MACD) histogram shows weakening momentum as the MACD line at 3.80 stays slightly above the signal line at 3.15, reflecting temporary indecision but no confirmed bearish reversal. The price holding above the $45.000 zone indicates the continuation of bullish control, with any retracements likely to find support around this area.

AVAX/USD Market Key Levels

Resistance: $55.860, $65.380, $81.870
Support: $33.020, $17.280, $8.620

Avalanche (AVAX/USD) Market Bullish Continuation Signals Upward Move Toward Major Resistance

AVAX/USD – Daily Chart

The daily chart for AVAXUSD shows that the bulls are still in control of the market.

AVAXUSD experienced a significant bounce off the bullish order block (OB) near $45.000. This demand zone aligns perfectly with a previous breakout structure and continues to act as a strong foundation for buyers.

Resistance at $55.860 has capped recent moves, but multiple bullish candles above $45.000 suggest that a breakout above this key resistance is likely. If the price breaks past $55.860, bullish momentum will accelerate significantly.

What is the projection for the AVAXUSD market?

Looking ahead, the projection remains bullish with the potential to reach $65.380, a critical resistance level that coincides with previous highs. Beyond this, the next major target lies at $81.870, where sellers could regain control.

Avalanche (AVAX/USD) Market Bullish Continuation Signals Upward Move Toward Major Resistance

AVAX/BTC Price Analysis

AVAXBTC remains in a bullish trend, maintaining higher highs and higher lows after a strong impulsive move. Price is currently retracing towards the 0.618 Fibonacci level, which aligns with a key support zone around 0.0004340.

The 9-day SMA is holding as dynamic support, signaling that buyers could regain control soon. A rebound from this zone could see a retest of the 0.0005810 resistance level, with further upside potential towards 0.0007130.

Avalanche (AVAX) Current Statistics
The current price: $49.050
Market Capitalisation: $19,090,000,000
Trading Volume: $809,630,000

Place winning AVAX/USD trades with us. Get AVAX here

ZKSync (ZK/USDT) Seeks Support Near the Critical $0.2050 Level

Over the past weeks, Zksync has demonstrated a notable price surge, accompanied by a strong trading volume. However, since peaking around $0.2300 earlier in December, the pair has been on a downtrend.

Recent price action suggests the pair is currently facing strong resistance at $0.2096 and appears to be retracing to test immediate support at $0.2050.

However, despite the decline, ZKsync’s price according to the indicators suggests an impending upside bounce from the current state as the oscillator below indicates a severe oversold condition.

Currently, Zksync is trading at $0.2058, 2.19% down compared to the previous session.

ZKSync (ZK/USDT) Seeks Support Near the Critical $0.2050 Level
ZKUSDT-Daily Chart

Technical Indicators

Major Resistance Levels: $0.2096, $0.2196, and $0.2211

Major Support Levels: $0.2050, $0.2012, and $0.1969

Zksync Technical Analysis

The analysis of the Zksync against the Tether on a daily timeframe shows that the pair remains within a bullish framework despite the current pullback towards $0.2050 shows as the pair’s price appears to be testing the immediate support.

However, despite the decline, the current price action around the short Guppy Multiple Moving Averages (GMMAs) suggests the possibility of a bullish reversal if trading volume increases and the $0.2050 level holds.

Additionally, the Stochastic RSI which reads extremely low values indicates an oversold condition, suggesting an imminent reversal might be on the horizon. To this end, a bounce to the immediate resistance would be possible with an increase in buyers’ confidence and a sign of a bullish crossover of the oscillator’s lines.

ZK/USDT Analysis: Expectations

The analysis of ZK/USDT on a 4-hour timeframe shows that the price has been bearish, evident in the formation of lower lows, reflecting a 2.80% decrease in trade compared to the previous session.

Additionally, the positioning of the price and GMMAs shows a bearish sentiment as seen in recent price movement below the longer EMAs. Though the trading volume seems moderate, the Stochastic RSI presents an opposite view as the indicator pictures the pair in an oversold region.

To this end, the ZKsync may see a further downtrend if the price dips below $0.2045. Conversely, a trend reversal would be possible with a break out above $0.2133.

ZKSync (ZK/USDT) Seeks Support Near the Critical $0.2050 Level
ZKUSDT-4H Chart


You can purchase crypto coins here. Buy LBlock


Hedera Hashgraph (HBAR/USD) Holds Strong Support Around $0.30

The Hedera Hashgraph (HBAR/USD) market has experienced a tug-of-war around the $0.30 price level. This trend followed a strong bullish rally that began in mid-November and peaked near $0.40 in early December. The peak triggered profit-taking, which caused a swift market reversal. However, support emerged at the $0.30 level on December 9, highlighting positive market sentiment. Bulls have consistently defended this level against bearish pressure, establishing it as a formidable line of support.

Hedera Hashgraph Market Data

  • HBAR/USD Price Now: $0.30
  • HBAR/USD Market Cap: $11.42 billion
  • HBAR/USD Circulating Supply: 38.24 billion HBAR
  • HBAR/USD Total Supply: 50 billion
  • HBAR/USD CoinMarketCap Ranking: #18

Hedera Hashgraph (HBAR/USD) Holds Strong Support Around $0.30

Key Levels

  • Resistance: $0.35, $0.40, and $0.45
  • Support: $0.25, $0.20, and $0.19

Hedera Hashgraph Market Through the Lens of Indicators

In recent days, the bullish sentiment around the $0.30 level has consistently rejected bearish pressure, reinforcing this level as a strong support zone. However, the presence of descending peaks signals increasing bearish momentum in the crypto market, gradually challenging the bulls’ position.

As the bulls maintain their stance at $0.30, the market has entered a consolidation phase, causing a significant drop in volatility. This is reflected in the sharp contraction of the Bollinger Bands, indicating reduced price movement as the battle between supply and demand continues. If this trend persists, the Bollinger Bands may form a narrow price channel around the horizontal price action, setting the stage for a decisive breakout.

For now, the Hedera Hashgraph market remains at a crossroads. If the bulls successfully withstand the bearish pressure, a rebound could occur. Conversely, failure to hold the $0.30 level may lead to a gradual market decline under sustained bearish dominance.

Hedera Hashgraph (HBAR/USD) Holds Strong Support Around $0.30

HBAR/USD Price Prediction: 4-Hour Chart Analysis

A closer analysis on a smaller timeframe reveals that the bulls have managed to hold their ground against bearish pressure for an extended period, potentially weakening bearish sentiment and paving the way for a rebound. However, a notable concern remains: with each bounce, the market continues to form lower peaks, even as the bulls maintain strong support near the $0.30 level.

Interestingly, the $0.30 level has now transitioned into a resistance zone. Traders should closely monitor the market for a breakout and sustained price action above this level. Such a development would signal the market’s readiness for a potential upward rally.

Trade crypto coins on BYBIT!